Abstract
Bone Morphogenetic Protein 2 (BMP2) regulates bone integrity by driving both osteogenesis and osteoclastogenesis. However, BMP2 as a therapeutic has significant drawbacks. We have designed a novel peptide CK2.3 that blocks the interaction of Casein Kinase 2 (CK2) with Bone Morphogenetic Protein Receptor type Ia (BMPRIa), thereby activating BMP signaling pathways in the absence of ligand. Here, we show that CK2.3 induced mineralization in primary osteoblast cultures isolated from calvaria and bone marrow stromal cells (BMSCs) of 8 week old mice. Further, systemic tail vein injections of CK2.3 in 8 week old mice resulted in increased bone mineral density (BMD) and mineral apposition rate (MAR). In situ immunohistochemistry of the femur found that CK2.3 injection induced phosphorylation of extracellular signal-related kinase (ERK), but not Smad in osteocytes and osteoblasts, suggesting that CK2.3 signaling occurred through Smad independent pathway. Finally mice injected with CK2.3 exhibited decreased osteoclast differentiation and osteoclast activity. These data indicate that the novel mimetic peptide CK2.3 activated BMPRIa downstream signaling to enhance bone formation without the increase in osteoclast activity that accompanies BMP 2 stimulation.
Keywords: Bone Morphogenetic Protein, Casein Kinase 2, Bone Mineral Density, Osteoporosis, Mimetic Peptide
Introduction
Bone is a dynamic tissue that is constantly remodeled through the action of osteoblasts that form bone and osteoclasts that resorb bone. However, the action of these cells must be balanced to maintain skeletal integrity. Continued increase in osteoclast activity over decreased osteoblast activity leads to decreased bone mass and metabolic bone diseases such as osteoporosis 1–3. Most of the therapeutic agents that protect the skeleton block osteoclastogenesis and osteoclast activity while only a few drugs promote bone formation. Among these are growth factors like bone morphogenetic proteins (BMPs). BMP2 is a potent stimulator of bone formation that enhances osteoblastogenesis and is approved for clinical use in healing of long bone fractures 3. However, long term BMP2 usage increases osteoclastogenesis and osteoclast activity, reducing the anabolic effects of BMP2 and raising concerns that bone loss could increase due to this catabolic action4. We recently identified a novel BMP type I receptor (BMPRIa) interacting protein, Casein Kinase 2 (CK2), that is released upon BMP2 stimulation 5. CK2 interacts with more than 300 substrates that regulates cell growth, proliferation, differentiation, apoptosis, and tumorigenesis 6.
We have designed a peptide, CK2.3 that blocks the interaction of CK2 with BMPRIa and contains an Antennapedia Homeodomain (HD) signal sequence for cellular uptake and localization to their respective binding sites 7; 8. We have previously shown that subcutaneous injections of the CK2.3 peptide induces bone formation and increases Mineral Apposition Rate (MAR) in mice calvaria 8. CK2.3 stimulation also results in decreased osteoclast activity in vitro 7. Mutation of the CK2.3 site (MCK2.3) on BMPRIa in C2C12 cells increased mineralization by these cells through the ERK pathway 9. In this study we investigate the effect of CK2.3 on bone formation by systemic injection in vivo and its potential mechanism in vitro and in vivo.
Materials and Methods
Mouse injections
C57BL/6J mice were obtained from The Jackson Laboratory (Bar Harbor, ME). At eight weeks of age, female C57BL/6J mice (n=7/group) were injected in the tail vein once a day for five consecutive days with CK2.3 (2.3μg/kg per mouse), BMP2 (5μg/kg per mouse) or 50μl of PBS as a vehicle control. The dosage equal to the 1:2.5 molar ratio of BMP2:CK2.3 concentration was based on previous experiments. There we found that 100nM CK2.3 responded similar to 40nM BMP27; 8. Three weeks after the initial injections, new bone formation was labeled by 100μl of calcein green (12mg/ml) via intraperitoneal injections. Five days later, second label of 100μl calcein green (12mg/ml) were injected intraperitoneally. Mice were sacrificed two days later and femurs were isolated and fixed using 10% neutral buffered formalin. Blood from all animals of each group was collected through peri-orbital sinus of the mouse at 2nd and 4th week after the last injection for bone marker analysis.
Alkaline phosphatase activity
Serum ALP activity was measured as previously described 10. Briefly, 5 μl of the serum was mixed with 295 μl of assay solution (1mM magnesium chloride, 10mM PNPP, 150mM sodium carbonate buffer (pH 10.3), and 10mM L-phenylalanine to inhibit circulating intestinal ALP activity). Serum samples were pooled and loaded onto one plate. The plate was protected from light and incubated at 37ºC for 15–30 min and read in triplicate at 405/410nm. Results were normalized to time 02; 10.
TRACP-5b assay
Serum TRACP-5b levels were quantified using the Mouse TRACP-5b ELISA kit from TSZ ELISA (Framingham MA) and followed the provided manufacture’s procedure. All samples were run on one plate in triplicate.
Osteocalcin assay
Serum osteocalcin levels were quantified using Mouse osteocalcin ELISA kit from Biomedical Technologies Inc. (Stoughton MA) as per manufacturer’s protocol. Serum and cell samples were run in triplicates. For cells three different experiments were performed.
Von Kossa Staining
Bone Marrow Stromal Cells (BMSCs) were extracted 11 and were plated at cell density of 1X10⁶ cells/cm2 in 35mm dishes using plating media for 7 days 8. Cells were grown to 90% confluence in plates and serum starved overnight before treatment. The next day cells were treated as noted per individual experiment with CK2.3 (100nM) or BMP2 (40nM). After 7 days cells were washed with cold PBS pH7.4, fixed using 4% (w/v) paraformaldehyde for 10 minutes, and washed with cold PBS pH7.4 again to remove remnants of fixative. Von Kossa stain (5% (w/v) silver nitrate in dH2O as previously described 7 These areas were analyzed by taking at least 10 random high magnification images of each well of treatment with a Nikon TMS automatic mode with phase 1 with a 20 x objective. Data was then quantified with the use of ImageJ (NIH, Bethesda), where images were converted to 8 bit and threshold was set to the positive control. Same threshold was used for all treatments in an individual experiment. The surface area of the stain was quantified by using the “analyzing particles function”, a function of ImageJ that can be used to calculate areas of black which represented mineralization.
Isolation of BMSCs
Mice were obtained from Charles River. BMSCs were collected from tibias and femurs of age matched female mice. At eight weeks, mice were sacrificed by CO2 and the hind limbs were removed. In sterile conditions, tibia and femur were cleaned and bone marrow was isolated by flushing the marrow with MEM alpha supplemented with 1% penicillin/streptomycin and 10% FBS. Cells were counted and plated at 10×105 cells. Primary cultures were grown in MEM alpha (Gibco, Carlsbad, California) supplemented with 1% penicillin/streptomycin and with 10% FBS for seven days at 5% CO2 and 37°C. Serum starvation started at 7 days in culture. The media was changed on day 3 and then every other day after that.
Calvarial Osteoblast Isolation
Calvaria were dissected from newborn mice (6–9 days old) and maintained in sterile conditions. Sutures were removed and the calvariae were subjected to four sequential 15 minute digestions in an enzyme mixture of collagenase P 1.5U/ml (Sigma-Aldrich) and 0.05% trypsin at 37°C. The cell fraction from the first digestion was discarded and the fractions 2–4 were collected and chilled using equal volumes of cold media (DMEM, 10% FBS, 1% penicillin/streptomycin). The remaining fractions were pooled, centrifuged, and re-suspended in media and filtered through a 70mm cell strainer. Cells were plated at a density of 1.5×10⁴ cells/cm2 in 35-mm culture plates in DMEM containing 10% FBS. Twenty-four hours later medium was exchanged and 3 days later cultures were changed again. At 7 days of culture, the medium was changed and serum starved for 12 hours then put in to differentiation medium (α-MEM containing 10% FBS, 25 mg/ml ascorbic acid, and 4 mM β-glycerophosphate) as well as the appropriate stimulation BMP2 (40nM), CK2.3 (100nM) and PBS 8.
Osteoclasts Isolation
Primary pre-osteoclasts were isolated from the spleens of five female C57BL/6J mice as described in 8. Spleen cells were flushed using a 26 gauge needle with plating media (alpha-MEM, 10% FBS, and 1% penicillin/streptomycin). Cells were centrifuged at 1000 rpm for five minutes at 4°C. The pellet was resuspended in osteoclast media (50mL plating media, 10μl RANKL (0.25μg/μl) and 6μl m-CSF (0.25μg/μl) from Pepro Tech, NJ, USA) and plated at 1X10⁶ cells/cm2 on bone chips in 48 well plate. On day seven media was changed and cells were stimulated with peptide CK2.3 (100nM) or BMP2 (40nM) for 7 days.
TRAP Staining
Cells were fixed with 4% paraformaldehyde and stained using the Sigma-Aldrich kit, 387A, following the manufacture’s procedure. Once cells were dried images were taken using a NikonTMS (model TMS-F #211153). Three random images per well per treatment were taken and images were quantified using ImageJ to calculate the number of osteoclasts per cell. The treatments were then normalized to the control. Osteoclasts were identified multinucleated cells.
Osteoclast Resorption Activity
Cells plated on bone slices were removed using hypoxic conditions followed by staining for 10 seconds with hematoxylin solution Gill No 3 from the 387A kit from Sigma-Aldrich. Images were taken using a Nikon TMS (model TMS-F #211153) at a 10x magnification. For each bone chip, the number of pits was counted as described previously 8
MicroCT40 and pQCT
Analyses of volumetric bone mineral density (vBMD) and trabecular bone volume (BV), tissue volume (TV), trabecular number (Tb.N), and trabecular thickness (Trab.th) were measured using MicroCT40 and pQCT as described. Tb.N is the average number of trabeculi, Tb.Th is the average thickness between each trabeculi and Tb.Sp is the space between the trabeculi themselves as described in 12; 13,14.
Histology
Femurs collected from mice (n= 7/group) were embedded in MMA as described 8; 15. Methyl Methacrylate (MMA) (Acros, New Jersey, USA), N- Butyl Phthalate, and Benzoyl Peroxide (Wet) (Fisher Scientific, Fair Lawn, New Jersey, USA) were dried carefully. All bones extracted from mice were fixed in 10% Neutral Buffered Formalin (NBF) for 24–48 hrs at 4°C. Subsequently, bones were washed with PBS and dehydrated using serial changes of ethanol gradients at 70% (8 to 16 hours), 70% (8 to 16 hours), 90% (8 to 16 hours), 95% (8 to 16 hours), 100% (8 to 16 hours), 100% (8 to 16 hours), 2 changes of 2-propanol (8 to 16 hours each rinse), and 2 changes of methyl salicylate (4 hours each). Samples were infiltrated in order, first with MMA I (765ml MMA + 140ml n-Butyl Phthalate) at room temperature for 48 hours, next MMA II (765ml MMA + 140ml n-Butyl Phthalate + 9.0g Dry Benzoyl Peroxide) at 4C for 48 hours, and last in MMA III (765ml MMA + 140ml n-Butyl Phthalate + 17.75g Dry Benzoyl Peroxide) at 4°C for 48 hours. Polymerized blocks were trimmed and sectioned at 200μm using (10.2cm X 0.3mm) Beuhler diamond watering blade and sanded down to even the surface. All samples were bisected longitudinally through the interchondular notch to separate medial and lateral condyles making sagittal plane cuts, with 3 or 4 slices per femur.
Immunostaining
Sectioned (n=7 per group) samples were imaged for Calcein using Zeiss LSM 780; plan Apochromat 20X (0.75NA, Main Beam Splitter (MBS) 488, 7% laser power). Calcein labelled sections were used to quantify Mineral Apposition Rate (distance between the labels/time between labels). Immunostaining of plastic embedded samples (n=3 out of 7/group) was performed by modification and optimization of this protocol 15. Samples were pretreated in testicular hyaluronidase for 30 minutes at 37°C followed by blocking with 3% BSA for one hour. Samples were labeled for 2 hours at room temperature with 2μg/ml of Antennapedia homeodomain antibody (Genetex, Irvin, CA, USA) followed by 4 μg/ml of Alexa 546 goat anti rabbit (Invitrogen, Eugene, OR, USA). Samples were imaged using Zeiss 510 NLO; Plan Apochromat 20X (0.8NA), Filters Long Pass (LP) 560, laser excitation of 543 nm, 10.9% laser power along with DIC filter. Smad1,5, and 8 and p-ERK labelling, samples were incubated for 2 hours at room temperature with either 40ng/ml of Rabbit Polyclonal Smad 1/5/8 IgG (Santa Cruz Biotech, CA, USA) followed by 4 μg/ml Alexa 546 goat anti-rabbit (Invitrogen, Eugene, OR, USA) or 2μg/ml mouse monoclonal p44/p42 MAPK (ERK1/2) antibody (cell signaling, MA, USA) pre-conjugated with 4 μg/ml of Alexa 633 goat anti-mouse IgG (Invitrogen, Eugene, OR, USA) for 1 hour and counterstained with Hoechst stain for 10 minutes. Samples were imaged using Zeiss LSM 510 NLO; with Plan Apochromat 20X/0.8, two photon excitation with Titanium:Sapphire(Ti:Al2O3) laser at wavelength 790 nm and Helium Neon (HeNe2) laser set at excitation 633 nm; both set to 35% power. Filters LP 560, LP 650, Band Pass (BP) 500 – 550IR and BP 390-465IR. Femurs were bleached to identify marrow cavities using autofluorescence. Images were processed using ImageJ.
Statistical Analysis
Data were analyzed by ANOVA, followed by Tukey-Kramer test. Outliers were removed using the Chauvenets Criterion. Error bars depict standard error of the mean.
Results
CK2.3 induces osteogenesis in primary calvaria as well as in BMSCs isolated from 8 week old mice
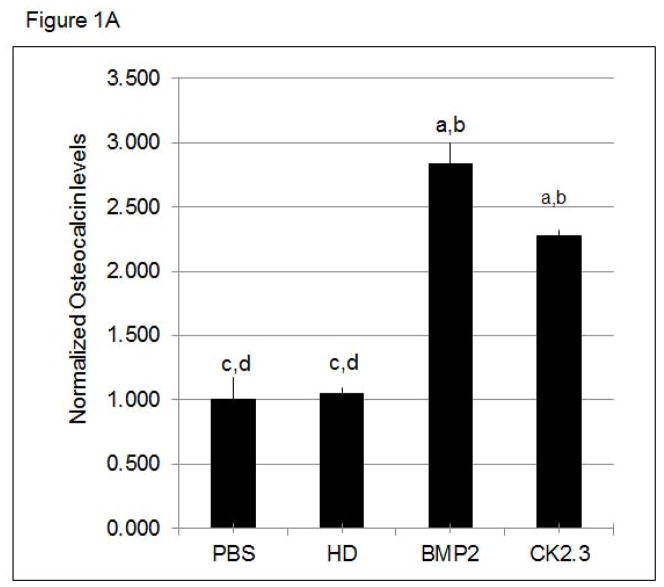
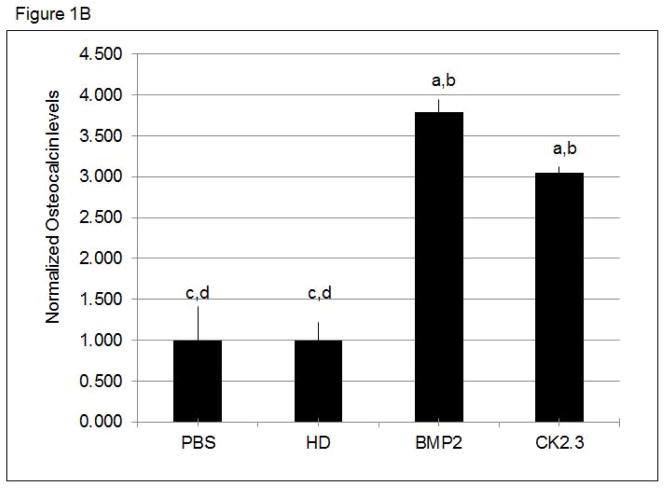
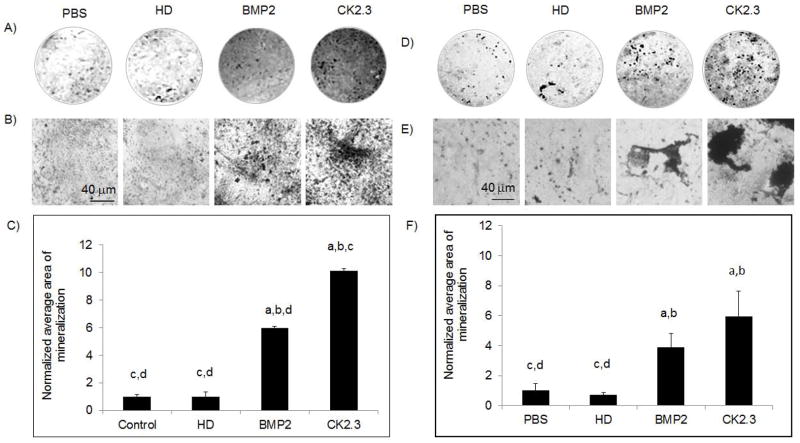
We have previously shown that CK2.3 induces mineralization in C2C12 cells, a myogenic cell line 7; 8. However, we still needed to determine the effect of CK2.3 on primary bone cells such as calvarial osteoblasts and BMSCs. First we measured osteocalcin, a marker for osteogenesis secreted by osteoblasts. Osteocalcin levels were increased in CK2.3 and BMP2 treated cells compared to control (Fig 1A, B). Next we determined the effect of CK2.3 on mineralization of isolated calvarial cells and BMSCs by Von Kossa staining (Fig 2). Both BMP2 and CK2.3 significantly increased mineralization above that of vehicle and HD controls. CK2.3 significantly increased mineralization over that of BMP2 treatment in isolated calvarial cells
Figure 1. CK2.3 stimulation of primary cells led to increased Osteoclacin levels.
Osteocalcin levels are increased in the supernatant of A) calvaria cells and B) BMSCs stimulated with PBS, HD (Antennapedia Homeodomain), 40nM BMP2, and 100nM CK2.3. At least 3 independent experiments were performed. Statistically significant as compared to (a) control, (b) antennapedia homeodomain (HD), (c) BMP2, (d) CK2.3. (p< 0.05).
Figure 2. CK2.3 stimulation of primary calvarial and BMSCs led to increased mineralization.
A),B),C) Primary calvarial cells and D),E),F) BMSCs stimulated with PBS, HD (Antennapedia Homeodomain), 40nM BMP2, and 100nM CK2.3. A),D) low resolution, B),E) high resolution of cells. C),F) Quantification of B),E). 3 independent experiments were performed. Statistically significant compared to (a) control, (b) HD, (c) BMP2, (d) CK2.3. (p< 0.05).
In vivo effects of CK2.3 on serum bone specific markers
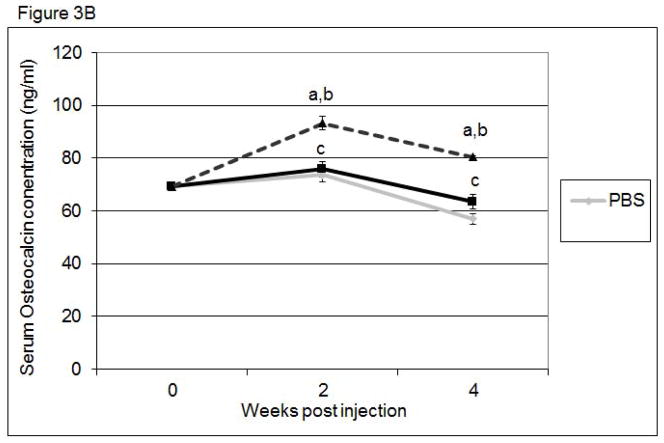
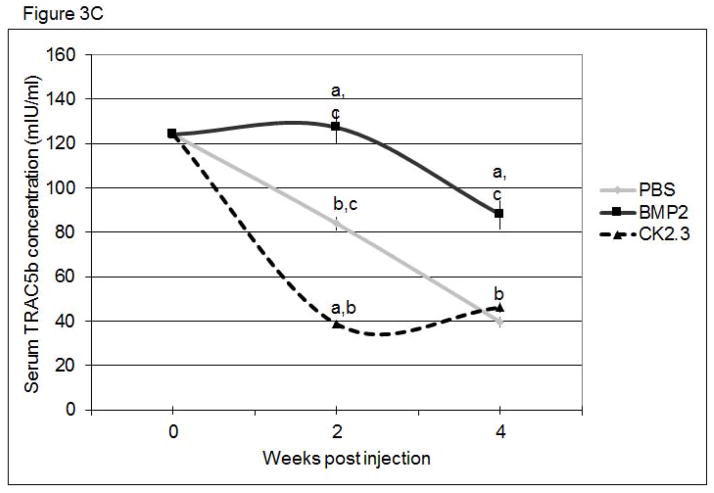
To determine if bone remodeling was altered in mice systemically injected with CK2.3, we first examined changes in the serum levels of the bone anabolic markers, alkaline phosphatase (ALP) and osteocalcin, and the catabolic marker, TRACP 5b. ALP (Figure 3A) and osteocalcin (Figure 3B) were significantly increased in CK2.3 injected mice, but were not significantly elevated in BMP2 treated or PBS control mice. Further, only the CK2.3 injected mice showed significant reduction in TRACP 5b levels (Figure 3C). Interestingly, BMP2 increased levels of TRACP 5b even 4 weeks after injection. These studies suggest that CK2.3 increases bone formation without the subsequent increase in osteoclast activity seen in BMP2 treated animals.
Figure 3. Systemic injection of CK2.3 led to increased ALP and Osteocalcin serum levels, while TRACP 5b serum level was decreased.
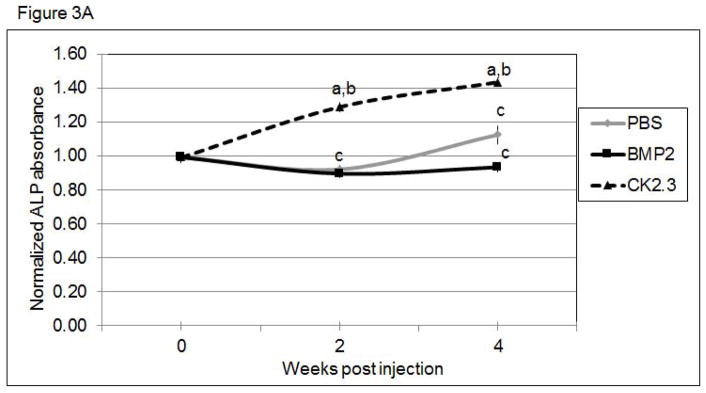
Serum analysis of mice injected with CK2.3, BMP2, and PBS at weeks 0, 2 and 4 for A) ALP, B) osteocalcin, C), TRACP5b. Blood from mice (n=7/group) were pooled and analysis was performed. Statistically significant compared to (a) control, (b) BMP2, (c) CK2.3. (p<0.05).
Altered bone architecture and density in mice treated with CK2.3
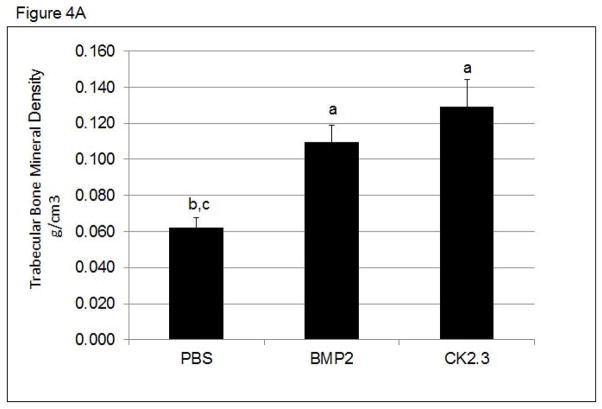
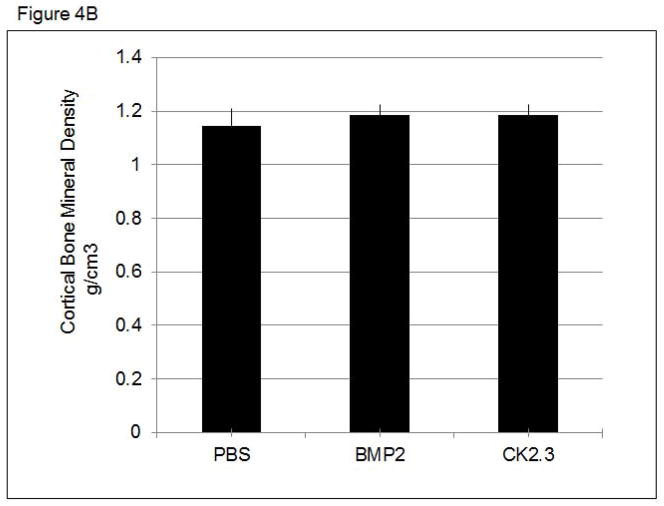
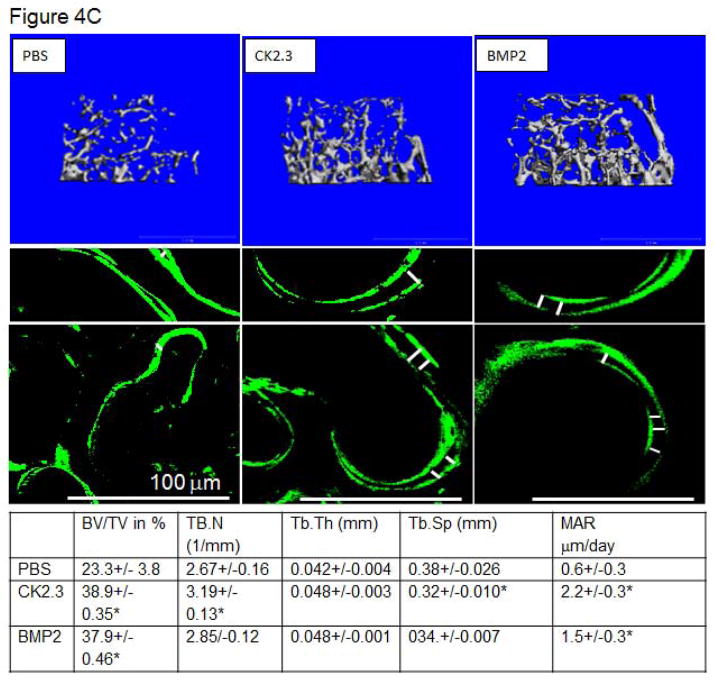
To determine changes in trabecular and cortical bone structure and density in mice treated with CK2.3, we imaged mice treated with CK2.3, BMP2, or PBS control using pQCT and MicroCT. Mice injected with either BMP2 or CK2.3 demonstrated a significant increase in trabecular BMD (Figure 4A.), but no change in cortical BMD was detected (Figure 4B). MicroCT measurements revealed increases in bone volume fraction, the number of trabeculi (Tb.N), trabecular thickness (Tb.Th), and decreases in trabecular spacing (Tb.Sp) (Figure 4C). These data were supported by histological measurements of bone formation using Calcein labeling measurements in femurs of CK2.3, BMP2, and PBS injected mice. These histological measurements also revealed higher MAR in CK2.3 injected mice compared to PBS injected mice (Figure 4C).
Figure 4. CK2.3 increased trabecular BMD as measured by pQCT and MicroCT.
pQCT and MicroCT analysis of femurs from mice injected with PBS, CK2.3 and BMP2 (n=7/group). A) Trabecular Bone Mineral Density, B) Cortical Bone Mineral Density C) MicroCT analysis and Calcein labelling of bone to determine MAR. (Top panel) Representative rendering of trabecular bone architecture (middle panel) calcein labeling. The white bar in middle panel represents bone growth over time. Statistically significant compared to (a) PBS, (b) BMP2, (c) CK2.3. (p<0.05).
SMAD and ERK in vivo signaling with CK2.3 treatment
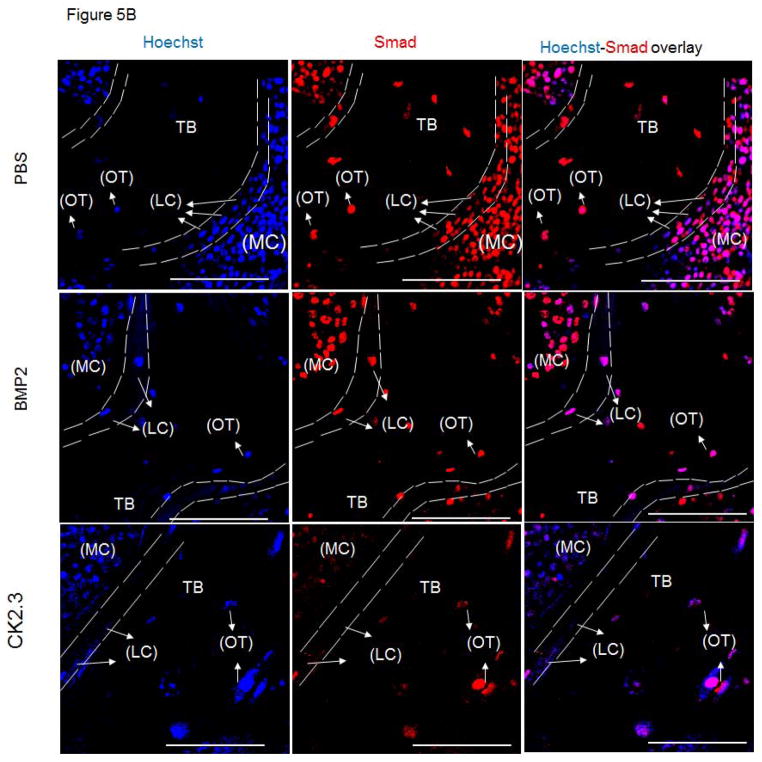
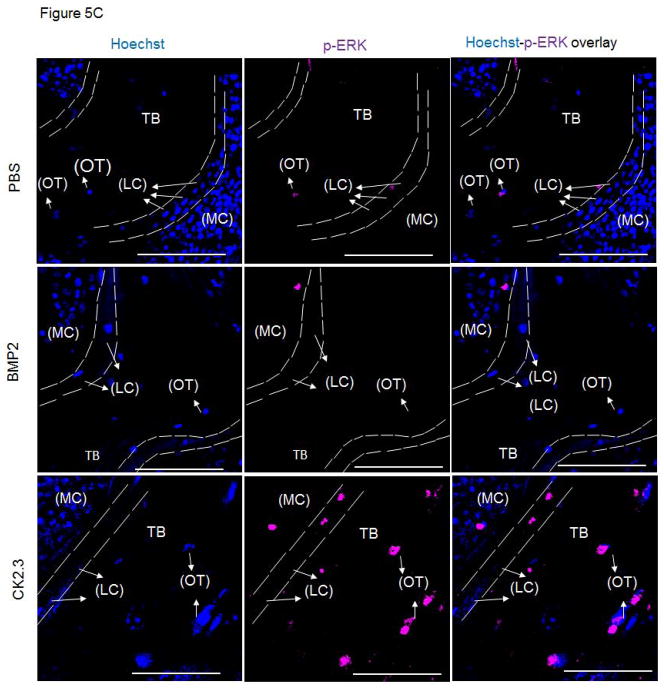
BMPs mediate their actions through both Smad and Smad-independent signaling pathways to enhance osteogenesis 16. In order to identify CK2.3 induced signaling in bone formation we stained MMA embedded femur slices for Smad1,5,8 and p-ERK to determine which pathway was prevalent in CK2.3 signaling. Osteoblasts lining the marrow cavity (MC), known as the lining cells (LC) aid in mineralization of the trabecular bone (TB). Osteoblasts and osteocytes (OT) actively expressed p-ERK in CK2.3 injected mice post 4 weeks (Fig 5). However, we did not observe p-ERK expression in femur samples of BMP2 and PBS injected mice (Fig 5).
Figure 5. Injection of CK2.3 into mice led to an increase in p-ERK.
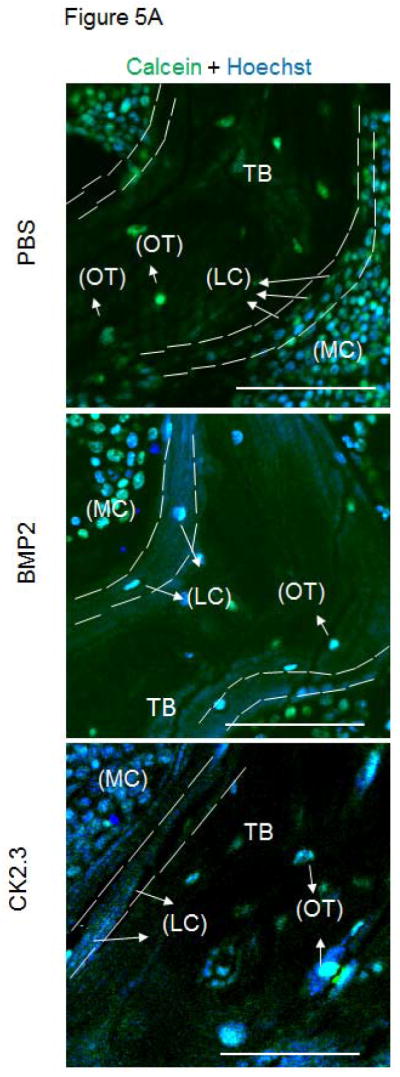
A) The autofluorescence image of the bone in combination with a nuclear stain was used to determine the cell type (LC=Lining Cells, OT=Osteocytes) and location (MC= Marrow Cavity, TB=Trabecular Bone) within the bone (green, blue). B) Femurs from PBS, BMP2, CK2.3 injected mice (n=3 per group) fluorescently labelled for the nucleus in blue, Smad in red followed by the overlay. C) Femurs from PBS, BMP2, CK2.3 injected mice (n=3 out of 7/group) fluorescently labelled for the nucleus in blue, p-ERK in magenta followed by the overlay. Sections were imaged in the Trabecular Bone (TB) around Marrow cavity where the Lining cells (LC) or the active osteoblasts reside alongside of osteocytes (OT) indicated by arrows. Immunostaining shows increased p-ERK in CK2.3 injected as indicated by the arrows but not Smad1,5 and 8. p-ERK was not observed in PBS, and BMP2 injected mice. Scale bar representing 50μm.
CK2.3 decreases osteoclastogenesis and osteoclast activity
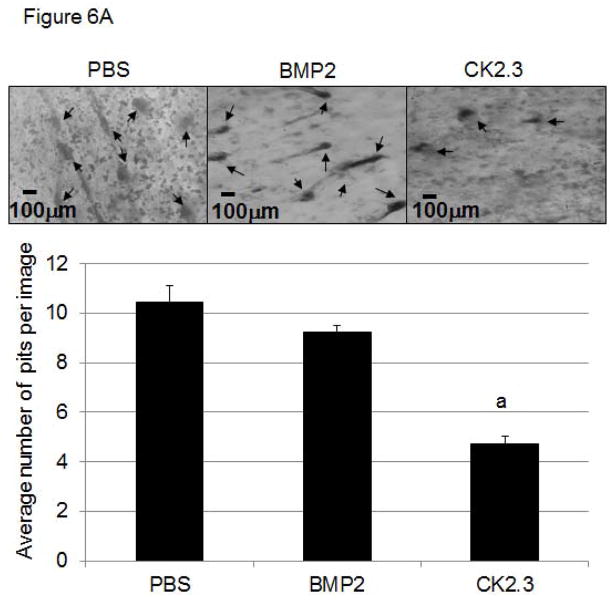
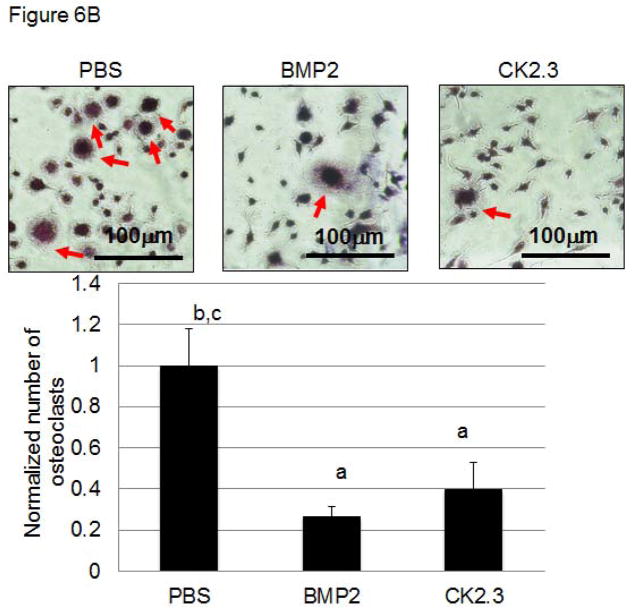
Next we determined if CK2.3 injected mice exhibit decreased osteoclastogenesis and osteoclast activity (Fig 6A, B). While increased osteoclast activity was observed in PBS and BMP2 injected mice, it was decreased in mice injected with CK2.3. These data are in accordance to previously shown data demonstrating reduced osteoclastogenesis and osteoclast activity in CK2.3 stimulated cultures 8.
Figure 6. Injection of CK2.3 into B6 mice caused decreased osteoclast activity (A) and osteoclastogenesis (B) in osteoclasts isolated from the spleen.
Spleen cells isolated from CK2.3, BMP2, and PBS injected mice are seeded on (A) Bovine femoral bone chips (n = 6 per treatment) and (B) cultured in 1.9cm2 dishes (n = 6 per treatment) using osteoclast differentiation media. Measured for (A) osteoclast activity in pit formations, and (B) number of differentiated osteoclasts and were normalized to the control. At least three independent experiments were performed from spleen cells isolated from mice (n=7/group).
Discussion
The discovery of Bone Morphogenetic Proteins revolutionized orthopaedic treatment of non-union fractures and bone loss. Injection of BMP2 significantly increases osteogenesis through increasing osteoblast production and stimulating these osteoblasts to increase bone formation. Moreover, systemic delivery of 5μg/kg BMP2 resulted in increased bone formation in mice after 20 days 17. However, there are drawbacks to BMP2 treatment. Including the limited half-life of BMP2 and its role in osteoclastogenesis and bone resorption. BMP2 induces osteoclast activity 4 and may cause increased bone turnover in the long term 18. Here, we studied the effects of a novel mimetic peptide, CK2.3. CK2.3 acts downstream of BMPRIa and activates BMP2 signaling by releasing CK2 from BMPRIa. Although CK2.3 activates the Smad signaling pathway we previously showed that ERK activation is crucial for its function 9. We found significant differences between BMP2 and CK2.3 treatment both in vitro and in vivo. Injection of BMP2 and CK2.3 resulted in an increase in BMD and bone formation. This was shown by increased trabecular thickness and a decrease in trabecular spacing. Also the number of trabeculi was increased. Calcein injections demonstrated that within the last week of injection the MAR of CK2.3 and BMP2 were increased. However, our data suggest the mechanism of action may be different. CK2.3 but not BMP2 injection led to increase ALP and osteocalcin serum levels. These data suggest that osteoblast activity is increased in the CK2.3 injected mice after two weeks. Since BMP2 mice also showed increased BMD the increase in ALP and osteocalcin may have taken place at a different time point. This is correlative of non-systemic adenoviral infections of BMP2 resulting in increased ALP and osteocalcin 19. Moreover, CK2.3 injection decreased TRACP 5b serum levels, suggesting a decrease in osteoclastogenesis. Interestingly, at 4 weeks TRACP 5C levels are similar to control, while BMP2 still showed high TRACP 5b level. This data were supported by our in vitro studies showing that CK2.3 treatment reduced osteoclast differentiation and decreased activity. While BMP2 decreased osteoclast differentiation, there was an increase in osteoclast activity. Previous research showed that BMP2 increases osteoclastogenesis in cultures 20. We did not see this increase. This effect may be caused by using spleen cultures instead of BMSCs to differentiate osteoclasts. Our data further demonstrated that CK2.3 was delivered to the femur and could be detected at the end of the study (Fig S1). This indicates the effects of CK2.3 were not caused by a breakdown of the peptide and suggests a longer half-life than that of BMP2.
Our study also uncovered the possible mechanism of bone formation induced by CK2.3. Immunostaining of femurs of CK2.3, but not BMP2 or PBS injected mice resulted in increased p-ERK levels in osteoblasts and osteocytes. However, we cannot exclude the possibility that ERK levels are changing rather than ERK activity is increased. Similar results suggesting the involvement of ERK in CK2.3 mediated mineralization was shown by our previous in vitro data. Overexpression of a mutant lacking the CK2.3 phosphorylation site lead to increased mineralization in vitro 9. Using an ERK inhibitor this effect seemed to be negated. These data suggest that ERK signaling is crucial for CK2.3 mediated mineralization. However, there is still the possibility that the ERK inhibitor PD98059 could have had off target side effects as reported earlier in a different cell line 21. Our immunostaining data suggest that activation of ERK is important for CK2.3 signaling. ERK signaling was shown to play an important role in Runx2 regulation, osteoblast differentiation, and skeletal development 22. However, little is known of BMP induced ERK signaling in bone formation in vivo. Mechanisms regulating these BMP induced pathways in bone formation remain unidentified. Furthermore, organ and blood analysis from mice did not demonstrate any signs of toxicity maintaining similar weights throughout these injected groups. All serum marker levels were within the normal ranges as explained (Fig S2, Tb S1) 23–25. In summary, we demonstrated the effect of the novel mimetic peptide of BMPRIa, CK2.3, as a mediator of osteogenesis and potent inducer of bone formation, without the secondary effects of osteoclastogenesis. This is in sharp contrast to BMP2 that enhanced both osteogenesis and osteoclast activity.
Supplementary Material
Acknowledgments
We want to thank Dr. Jeff Caplan and Dr. Deni Galileo at the University of Delaware. Finally would like to thank funding from NIH R01.
References
- 1.Boyle WJ, Simonet WS, Lacey DL. Osteoclast differentiation and activation. Nature. 2003;423:337–342. doi: 10.1038/nature01658. [DOI] [PubMed] [Google Scholar]
- 2.Ferguson VL, Ayers RA, Bateman TA, et al. Bone development and age-related bone loss in male C57BL/6J mice. Bone. 2003;33:387–398. doi: 10.1016/s8756-3282(03)00199-6. [DOI] [PubMed] [Google Scholar]
- 3.Marie PJ, Kassem M. Osteoblasts in osteoporosis: past, emerging, and future anabolic targets. Eur J Endocrinol. 2011;165:1–10. doi: 10.1530/EJE-11-0132. [DOI] [PubMed] [Google Scholar]
- 4.Jensen ED, Pham L, Billington CJ, et al. Bone morphogenic protein 2 directly enhances differentiation of murine osteoclast precursors. J Cell Biochem. 2010;109:672–682. doi: 10.1002/jcb.22462. [DOI] [PMC free article] [PubMed] [Google Scholar]
- 5.Bragdon B, Thinakaran S, Bonor J, et al. FRET reveals novel protein-receptor interaction of bone morphogenetic proteins receptors and adaptor protein 2 at the cell surface. Biophys J. 2009;97:1428–1435. doi: 10.1016/j.bpj.2009.05.061. [DOI] [PMC free article] [PubMed] [Google Scholar]
- 6.Litchfield DW. Protein kinase CK2: structure, regulation and role in cellular decisions of life and death. Biochem J. 2003;369:1–15. doi: 10.1042/BJ20021469. [DOI] [PMC free article] [PubMed] [Google Scholar]
- 7.Bragdon B, Thinakaran S, Moseychuk O, et al. Casein kinase 2 beta-subunit is a regulator of bone morphogenetic protein 2 signaling. Biophys J. 2010;99:897–904. doi: 10.1016/j.bpj.2010.04.070. [DOI] [PMC free article] [PubMed] [Google Scholar]
- 8.Bragdon B, Thinakaran S, Moseychuk O, et al. Casein kinase 2 regulates in vivo bone formation through its interaction with bone morphogenetic protein receptor type Ia. Bone. 2011;49:944–954. doi: 10.1016/j.bone.2011.06.037. [DOI] [PubMed] [Google Scholar]
- 9.Moseychuk O, Akkiraju H, Dutta J, et al. Inhibition of CK2 binding to BMPRIa induces C2C12 differentiation into osteoblasts and adipocytes. J Cell Commun Signal. 2013;7:265–278. doi: 10.1007/s12079-013-0199-1. [DOI] [PMC free article] [PubMed] [Google Scholar]
- 10.Dimai HP, Linkhart TA, Linkhart SG, et al. Alkaline phosphatase levels and osteoprogenitor cell numbers suggest bone formation may contribute to peak bone density differences between two inbred strains of mice. Bone. 1998;22:211–216. doi: 10.1016/s8756-3282(97)00268-8. [DOI] [PubMed] [Google Scholar]
- 11.Liao QC, Li YL, Qin YF, et al. Inhibition of adipocyte differentiation by phytoestrogen genistein through a potential downregulation of extracellular signal-regulated kinases 1/2 activity. J Cell Biochem. 2008;104:1853–1864. doi: 10.1002/jcb.21753. [DOI] [PMC free article] [PubMed] [Google Scholar]
- 12.Beamer WG, Shultz KL, Coombs HF, et al. Multiple quantitative trait loci for cortical and trabecular bone regulation map to mid-distal mouse chromosome 4 that shares linkage homology to human chromosome 1p36. J Bone Miner Res. 2012;27:47–57. doi: 10.1002/jbmr.515. [DOI] [PMC free article] [PubMed] [Google Scholar]
- 13.Bouxsein M, Uchiyama T, Rosen C, et al. Mapping quantitative trait loci for vertebral trabecular bone volume fraction and microarchitecture in mice. J Bone Miner Res. 2004;19:587–599. doi: 10.1359/JBMR.0301255. [DOI] [PubMed] [Google Scholar]
- 14.Bouxsein ML, Boyd SK, Christiansen BA, et al. Guidelines for assessment of bone microstructure in rodents using micro-computed tomography. J Bone Miner Res. 2010;25:1468–1486. doi: 10.1002/jbmr.141. [DOI] [PubMed] [Google Scholar]
- 15.O’Brien FJ, Taylor D, Dickson GR, et al. Visualisation of three-dimensional microcracks in compact bone. J Anat. 2000;197(Pt 3):413–420. doi: 10.1046/j.1469-7580.2000.19730413.x. [DOI] [PMC free article] [PubMed] [Google Scholar]
- 16.Ryoo HM, Lee MH, Kim YJ. Critical molecular switches involved in BMP-2-induced osteogenic differentiation of mesenchymal cells. Gene. 2006;366:51–57. doi: 10.1016/j.gene.2005.10.011. [DOI] [PubMed] [Google Scholar]
- 17.Turgeman G, Zilberman Y, Zhou S, et al. Systemically administered rhBMP-2 promotes MSC activity and reverses bone and cartilage loss in osteopenic mice. J Cell Biochem. 2002;86:461–474. doi: 10.1002/jcb.10231. [DOI] [PubMed] [Google Scholar]
- 18.Canalis E, Brunet LJ, Parker K, et al. Conditional inactivation of noggin in the postnatal skeleton causes osteopenia. Endocrinology. 2012;153:1616–1626. doi: 10.1210/en.2011-1604. [DOI] [PMC free article] [PubMed] [Google Scholar]
- 19.Tsuda H, Wada T, Ito Y, et al. Efficient BMP2 gene transfer and bone formation of mesenchymal stem cells by a fiber-mutant adenoviral vector. Mol Ther. 2003;7:354–365. doi: 10.1016/s1525-0016(02)00062-x. [DOI] [PubMed] [Google Scholar]
- 20.Itoh K, Udagawa N, Katagiri T, et al. Bone morphogenetic protein 2 stimulates osteoclast differentiation and survival supported by receptor activator of nuclear factor-kappaB ligand. Endocrinology. 2001;142:3656–3662. doi: 10.1210/endo.142.8.8300. [DOI] [PubMed] [Google Scholar]
- 21.Wauson EM, Guerra ML, Barylko B, et al. Off-target effects of MEK inhibitors. Biochemistry. 2013;52:5164–5166. doi: 10.1021/bi4007644. [DOI] [PMC free article] [PubMed] [Google Scholar]
- 22.Ge C, Xiao G, Jiang D, et al. Critical role of the extracellular signal-regulated kinase-MAPK pathway in osteoblast differentiation and skeletal development. J Cell Biol. 2007;176:709–718. doi: 10.1083/jcb.200610046. [DOI] [PMC free article] [PubMed] [Google Scholar]
- 23.Charles River. Biochemistry and Hematology for C57BL/6NCrl Mouse Colonies in North American for January 2008 – December 2011. Charles River; 2012. Technical Reference. [Google Scholar]
- 24.Boehm O, Zur B, Koch A, et al. Clinical chemistry reference database for Wistar rats and C57/BL6 mice. Biol Chem. 2007;388:547–554. doi: 10.1515/BC.2007.061. [DOI] [PubMed] [Google Scholar]
- 25.Mazzaccara C, Labruna G, Cito G, et al. Age-Related Reference Intervals of the Main Biochemical and Hematological Parameters in C57BL/6J, 129SV/EV and C3H/HeJ Mouse Strains. PLoS One. 2008;3:e3772. doi: 10.1371/journal.pone.0003772. [DOI] [PMC free article] [PubMed] [Google Scholar]
Associated Data
This section collects any data citations, data availability statements, or supplementary materials included in this article.


