

Abstract
Objective
During phonation, skewing of the glottal flow waveform (Q) during phonation refers to a phenomenon that occurs when the flow decelerates more rapidly than it accelerates. This skewing is clinically important because it increases the glottal efficiency, which is defined by the acoustic intensity (units are sound pressure level or SPL) divided by the subglottal pressure. Current theoretical models predict that the only mechanism to cause skewing of Q involves changes in the vocal tract inertance. The purpose of the current work is to show that other factors at the vocal fold level can also cause skewing of Q and to determine if the acoustic intensity is correlated with MFDR.
Study design
Basic Science
Methods
Intraglottal geometry and velocity measurements were taken in five canine larynges at the mid-membranous plane using two-dimensional particle imaging velocimetry (PIV). The flow rate at the glottal exit was computed from the PIV measurements for low, medium, and high subglottal pressures.
Results
Vortices form in the superior aspect of the divergent glottis during closing. These vortices produce negative pressure that increases both the maximum value of Q and the rapid deceleration of the flow. The skewing of the flow rate is increased as the intraglottal vortices are increased by increasing the subglottal pressure. The increase in the acoustic intensity is highly correlated with certain properties of the flow rate waveform, such as maximum flow rate.
Conclusion
Flow skewing and the acoustic intensity can be increased by increasing the intraglottal vortices.
Keywords: Vocal folds, Intraglottal velocity, Flow rate, Laryngeal aerodynamics
Introduction
In the classic source-filter theory, Fant1 proposed that during phonation, sound is produced at the glottis by a process known as flow modulation; in this case, “flow” specifically refers to the flow rate (Q) produced at the glottal exit during the phonation cycle. Q is described in terms of the volume of air exiting the glottis per time, and is also known as the volume velocity. Possible units for Q are liters/sec or cc3/sec. Flow modulation refers to the fact that Q is changing as the glottis opens and closes. It is the change in Q, not Q itself, which produces the sound.
Although the flow rate is constantly changing from glottal opening and closing, the greatest rate of change happens during the latter part of closing, when the volume velocity rapidly decreases. This rapid deceleration is quantified by the maximum flow declination rate (MFDR). MFDR has been shown to highly correlate with acoustic intensity (Stevens, 1988), the objective physical variable that roughly correlates with loudness.
In the case of phonation, the volume velocity (Q) is equal to the area (A) between the superior edge of the folds and the velocity (V) of the airflow exiting the glottis. Since Q = A · V, the maximum flow declination rate (MFDR) can be increased by increasing the maximal area declination rate (MADR) and/or the maximum velocity declination rate (MVDR). MADR is increased when the vocal fold closing speed is faster. Current theories suggest that MVDR and MFDR will increase as vocal tract inertance increases. The most common method to increase inertance is to decrease the area of a portion of the tract, such as is done in semi occluded vocal tract exercises2.
Clinically, MFDR is derived from the volumetric flow rate waveform, the latter is most commonly measured by a technique known as inverse filtering3. In this technique the volume velocity is first directly measured at the mouth, and then a calculation using a standardized transfer function for the vocal tract is performed to derive the flow rate at the glottal exit. This technique has been used in multiple clinical studies showing general agreement with theoretical models4, 5, 6. However, this technique is an indirect calculation of the glottal volume velocity, as opposed to a direct measure, and results can be difficult to correctly obtain and interpret7. In order to validate the method of inverse filtering or determine its accuracy, the method needs to be compared to a direct measurement of the volumetric flow rate at the glottal exit in a tissue model.
Verneuil et al.8 using a canine larynx model, simultaneously measured velocity and corresponding glottal area for multiple time points in the phonation vibratory cycle. The glottal area was measured using videostroboscopy, and the velocities were measured one centimeter above the glottis using one-dimensional hot-wire anemometry. Although the work of Verneuil et al.8 represents the most advanced published measurements of glottal flow, there are a few potential limitations to this work. First, the hot-wires could not be placed directly at the glottal exit, due to the risk of damaging the probes, but were located 1cm above the fold instead. Our previous work9, 10 shows that the velocity field 1cm above the glottal exit is significantly different than that at the glottal exit. The second potential limitation of Verneuil et al.8 work is that current two-dimensional videostroboscopy or even high-speed videography most accurately determines the edge of the air/vocal fold interface at the minimum glottal area. In the case of vocal fold closing, the minimum glottal area is at the inferior edge since the glottis is divergent. For multiple reasons, the waveform of the area at the glottal exit (superior edge) may not be similar to the waveform at the inferior edge.
Recently, we have developed a method that can measure velocity, the distance between the folds, and flow rate in the excised canine larynx. This technique uses particle imaging velocimetry (PIV) to determine the intraglottal geometry and velocity fields during closing in a 1mm thick coronal section centered around the mid-membranous point, a point halfway between the anterior commissure and the vocal process11, 12. Due to laser reflections off the medial surface of the folds, the intraglottal geometry in that coronal section is accurately determined. Since the length of the glottis is fixed throughout the cycle, the glottal area will be proportional to the mid-membranous distance between the folds; the exception to this is when there is an anterior-posterior (AP) zipper-like mucosal wave13; thus our technique is only valid when the mucosal wave is minimal in the AP direction. Velocity at the mid-membranous location has also shown to be proportional to velocity at other locations in the fold during the entire vibration cycle8, 10, 14. Thus it is expected that our measurements of Q in a 1mm thick section will be proportional to the total Q.
Our previous work has also shown that vortices occur between the folds during the closing phase if the glottis has a divergent shape. These intraglottal vortices, defined as flow separation vortices (FSV), produce negative pressures between the superior half of the folds15, which we hypothesize can cause an increase in MADR, MVDR and MFDR. In addition to increasing MFDR, we also hypothesize that the flow separation vortices will be highly correlated with skewing of Q, where skewing is viewed as a flow rate waveform that decreases at a more rapid rate than it increases. This skewing is clinically important because it is related to a greater SPL at the same subglottal pressure compared to a symmetric waveform; this can translate to greater loudness at the same vocal effort or increased SPL/subglottal pressure; this quantity is one measure of glottal efficiency. Theoretically, the effect of the FSV on skewing is important because current theoretical models predict that skewing of Q only occurs if vocal tract inertance is increased. While we do not question the importance of the vocal tract effect on the flow rate, the purpose of the current work is to show that other factors at the vocal fold level can also cause skewing of Q. If the intraglottal FSV affect skewing, it would suggest that further work be done on how laryngeal diseases and surgical treatments affect the FSV, and therefore acoustic intensity and glottal efficiency.
Methods
Five excised larynges were harvested from shared research mongrel canines immediately after the animals were euthanized. All the structures above the vocal folds were removed to obtain an unobscured view of the folds. The folds were adducted using a suture placed through the vocal processes, and the larynx was held in space using a four-pronged support that was attached to the cricoid. The trachea was placed over an aerodynamic nozzle that conditioned the airflow before it entered the glottis. The geometrical vocal characteristics and the fashion in which the velocity data was taken were described in details in Oren et al.12. Phonation of the folds was obtained at three subglottal pressures (low, medium, and high) and the data acquisition for each test was initiated about 10sec after the onset of phonation to allow for the vibration frequency to stabilize.
Velocity field measurements were taken using time-resolved PIV system by illuminating the vocal folds in the coronal plane, halfway between the vocal process and the anterior commissure (referred to as the mid-membranous plane). u and v are the velocity components in the axial, (i.e. the inferior-superior or x) and transverse (i.e. medial-lateral or y) directions, respectively. The phase of the velocity fields was determined by synchronizing the PIV measurements with an electroglottograph (EGG) having its electrodes attached to the cricoid, and comparing the time derivative of the EGG signal to the TTL signal of the PIV camera.
Acoustic measurements were taken using a microphone (Brüel & Kjær, 0.5″ free-field microphone, Model 4950), which was placed approximately 15cm laterally and superiorly to the glottis. The subglottal pressure (i.e. lung pressure), PSG, was measured upstream of the larynx using a pressure transducer (Honeywell, FPG). The acquisition of the EGG, microphone, and pressure transducer signals was taken at 80kHz and was synchronized with the PIV measurements using a data acquisition system (National Instruments, PXIe-6356).
The centerline velocity, defined as maximum axial velocity of the glottal jet, ucl = umax, was extracted from the intraglottal velocity fields at the superior edge. The volumetric flow rate was computed by integrating the velocity profile and multiplying it by the thickness of the laser sheet:
| (1) |
where dz is the 1mm thickness of the laser sheet, u is the axial velocity, and y2 − y1 is the distance between the superior-medial edge of the vocal folds in the mid-membranous plane.
Statistical analysis was done using a mixed linear model to assess the relationships between an outcome dependent variable (such as flow rate skewing, MFDR, or Qmax) vs. an independent variable of interest (such as PSG, or SPL). A random effect was added in the statistical model to account for within subject correlation caused by repeated measurements in the study design. The model was also used to calculate the correlation coefficient between dependent and independent variables from its variance-covariance matrix. P-values <0.05 were considered statistically significant.
Results
Figure 1 shows the intraglottal velocity field during closing for L4 at high subglottal pressure (PSG=27.2cmH2O). A flow separation vortex12 is observed near the superior aspect of the right fold. Flow separation also occurs near the superior aspect of the opposite fold. The flow separation that occurs near the superior aspect leads to ambient flow entering the glottis (entrainment flow) and formation of negative pressure near the superior edge of the folds15.
FIGURE 1.

Intraglottal velocity field for larynx L4 at high subglottal pressure during closing (PSG=27.2cmH2O). Flow separation vortex is observed near the right fold. The dashed line marks the location of the velocity profile shown in Fig. 2.
Figure 2 shows the axial velocity profile (component in the inferior-superior direction) at the glottal exit. The dashed lines in Fig 1 mark the location of the profile. The profile at the glottal exit shows negative values of velocity near the superior-medial aspect of the folds. These negative values indicate that airflow particles are entrained from the ambient into the larynx. The reversal of the flow direction stems from the pressure-drop that develops between the superior edge and the ambient due to flow separation.
FIGURE 2.

Axial velocity profile measured at the glottal exit from L4 at high PSG. The dashed area is used to calculate Q (see Eqn. 1). The approximate location of the profile in the superior aspect of the fold is shown in Fig 1.
The waveform of the centerline velocity, Ucl, is shown for L1–L5 at each subglottal pressure in Figure 3. The open, half-closed, and closed symbols are for the low, mid, and high PSG. The Ucl waveform is characterized by four distinct stages: Initial acceleration at the beginning of opening, uniform magnitude, acceleration during closing, and rapid deceleration at the end of closing. The maximum negative pressures produced by the intraglottal vortices occur just prior to the rapid deceleration15.
FIGURE 3.
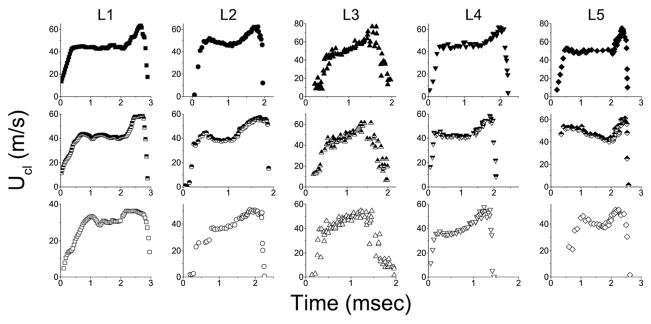
Centerline velocity measurements (defined as ucl=umax) at the glottal exit. Top row – high PSG (solid symbols). Middle row – medium PSG (half-full symbols). Bottom row – low PSG (open symbols).
The waveforms for the volumetric flow rate, Q, at the three subglottal pressures are shown in Figure 4. The Q curves are calculated using Equation (1) based on the velocities values measured at the glottal exit (shaded region in Fig. 2). The current data shows that the flow rate waveforms are not symmetric, but rather skew towards the closing phase. The effect of certain parameters derived from the volumetric flow rate on the vocal intensity was evaluated from the waveform plots. The value for MFDR was computed by applying a linear regression fit to the closing phase data shown in Fig. 4.
FIGURE 4.

Flow rate, Q, computed from velocity profiles taken at the glottal exit. Symbols are the same as in Fig. 3
The skewness index (SI) of Q was calculated as a ratio of the duration of increase in Q (Tp) to the duration of decrease in
| (2) |
. Figure 5 shows that Q always skews towards closing (i.e. QSI>1). There is also a strong correlation between the magnitude of QSI to the magnitude of the subglottal pressure (r=0.93, p<0.001).
FIGURE 5.

Skewing index of the flow rate, QSI, at different PSG. Symbols are the same as in Fig. 3.
Figure 6 plots Qmax and MFDR as a function of the sound pressure level (SPL). Qmax was taken as the maximum value in each waveform that is shown in Fig. 4. The SPL was calculated from the microphone measurements that were taken concurrently with the velocity measurements and using a c-weighting function. The statistical analysis showed that Qmax has the same high correlation coefficient (r=0.93, p<0.001) as the correlation coefficient of MFDR (r=−0.94, p<0.003). The SPL also has high correlation with the maximum magnitude of the negative pressures produced by the vortex (r=−0.92, p<0.002).
FIGURE 6.


FIGURE 6a. Relationship between vocal intensity and a) volumetric flow rate and b) MFDR. Symbols are the same as in Fig. 3
FIGURE 6b. Relationship between vocal intensity and a) volumetric flow rate and b) MFDR. Symbols are the same as in Fig. 3
Discussion
As mentioned previously, the majority of the acoustic energy is produced during this closing of the vocal folds, and the maximum flow declination rate (MFDR) is specifically highly correlated with acoustic intensity and the amount of acoustic energy in the higher harmonics4, 16, 17, 18. Since many voice professionals and dysphonic patients often complain about an inability to project their voice or be heard in a noisy environment, it is important to determine the underlying mechanisms that can cause an increase in MFDR.
We showed high correlations between SPL and both MFDR and the maximum flow rate. If only the positive velocity (i.e. forward velocity) was considered in the computations of the flow rate, the resultant correlation coefficient of SPL with Qmax was still high (r=0.91, p<0.006), but the correlation with MFDR was much lower (r=−0.36, p<0.006). This is an important observation because the flow rate measured in the clinic using a flow rate mask does not account for the flow that is been entrained into the glottis (i.e. only the positive velocity is being measured at the mouth).
In addition to MFDR, flow skewing is also an important mechanism that allows vibration at a single fundamental frequency to produce an acoustic wave with multiple harmonics19. In addition, greater skewing will increase the ratio of SPL/PSG, which would translate clinically into decreased effort for the same acoustic intensity. Previously published theoretical models propose that flow skewing is due to vocal tract inertance, which is related to the degree of obstruction in the vocal tract2. Decreasing vocal tract area will increase vocal tract inertance, thereby increasing the amount of glottal waveform skewing. The current study does not look at the effect of inertance since there is no vocal tract above the excised larynx, but it does show however that the vortices are associated with skewing of the velocity and flow rate waveform.
The skewing of the flow rate waveforms in our experiments is probably due to the negative pressures produced by the intraglottal vortices. These vortices produce negative pressures during closing11, 15 which cause rapid vocal fold closing. The rapid reduction in glottal area will first cause a rapid increase in velocity and then as flow shuts off, a rapid reduction in velocity. The rapid increase in velocity is also due to the fact that the negative pressure created by the FSV increases the transglottal pressure gradient, which is driving the glottal airflow. The effects on skewing are significant for two theoretical reasons that need further exploration: The first is that the hypothesis that vortices produce flow skewing has not been previously proposed in any work on analytical, computational, or mechanical models. The second is that the effects of the FSV on flow rate represents a mechanism to increase acoustic intensity and glottal efficiency that is affected by changes in the vocal fold. Specifically, we have previously shown that the vortices decrease in asymmetric tensions and vocal fold scarring20. This work suggests a new paradigm: studying how the vortices are affected by disease and surgical procedures will give new insights on how to maximize acoustic intensity and glottal efficiency, which is important since the increases in the former corresponds to loudness, and greater efficiency reduces fatigue. This is clinically relevant since three frequent patient complaints are a soft voice, the inability to be understood in a noisy room, and vocal fatigue.
FSV formation at the superior edge of the vocal folds during closing may explain the observed flow skewing of the glottal waveform. In general, it is known that increasing subglottal pressure will increase the SPL; current theories suggest that this is due to increased lateral displacement of the fold. This results in greater compression of the spring-like nature of the fold, which produces greater elastic recoil forces, which results in greater closing speed and thus MFDR. Because of damping viscous effects, more force is used to compress the spring than the force that the spring produces during expansion. This would likely cause skewing of the flow rate curve to the left21, which is not what is observed. On the other hand, since the negative pressures produce an additional suction force only available during closing, there will be greater forces during closing than opening (which is observed in the case of a larynx without a vocal tract).
As discussed in Khosla et al.11, the vortices will increase when the maximum divergence angle of the glottis during closing is increased. Oren et al.22 showed that the inferior aspect of the vocal fold is as stiff as the superior aspect at low displacements; on the other hand, the inferior aspect is much stiffer at greater displacements produced by greater subglottal pressure. This difference in elasticity will produce greater displacement superiorly than inferiorly, which will produce a greater divergence angle; previous experimental results support this. The increased stiffness observed at the inferior edge could be due to the proximity of the conus elasticus22, 23.
One common question in a Type I Thyroplasty or in an injection laryngoplasty is whether the subglottis needs to be medialized. Medializing the subglottis should result in greater lengthening of the conus elasticus, which increases the stiffness of the inferior aspect of the fold, relative to the superior aspect and therefore can produce greater divergence angle of the glottis during closing. The current findings supports the theory that medializing both the subglottal and glottal regions produces the ability to have greater flow skewing and higher acoustic intensity than medializing the glottis alone.
More work is needed in order to generalize the current findings. First the current methodology needs to be extended so that the three-dimensional flow rate can be measured. This would allow determination of how sound is produced by flow modulation. Studies of different asymmetries (such as vocal process height) and different surgical procedures are also underway.
Conclusion
Intraglottal velocity fields were measured in five canine larynges. The flow rate at the glottal exit was computed from the velocity measurements. Flow separation occurred during the closing phase of vocal fold vibration and produced vortices near the superior aspect of the folds. These vortices produce negative pressures that can augment the flow rate waveform without using downstream constriction (i.e. vocal tract). The increase in the acoustic intensity was highly correlated with the increase in the negative pressure and the skewing of the flow rate. This finding suggests that the acoustic intensity of the voice may be increased by increasing the intraglottal vortices.
Acknowledgments
The authors acknowledge the support of NIH Grant No. 5R01DC009435.
Footnotes
The authors have no financial or personal interests that could inappropriately influence (bias) the work in this manuscript.
This manuscript was presented at the Combined Otolaryngology Spring Meeting, May 14th-18th, 2014, Las Vegas, Nevada, USA,.
The study was performed in accordance with the PHS Policy on Humane Care and Use of Laboratory Animals, and the Animal Welfare Act (7 U.S.C. et seq.); the animal use protocol was approved by the Institutional Animal Care and Use Committee (IACUC) of the University of Cincinnati.
Level of Evidence: NA
Contributor Information
Liran Oren, Department of Otolaryngology-Head and Neck Surgery, University of Cincinnati, Cincinnati, Ohio, USA.
Sid Khosla, Department of Otolaryngology-Head and Neck Surgery, University of Cincinnati, Cincinnati, Ohio, USA.
Doug Dembinski, Department of Biomedical Engineering, University of Cincinnati, Cincinnati, Ohio, USA.
Jun Ying, Department of Environmental Health, University of Cincinnati, Cincinnati, Ohio, USA.
Ephraim Gutmark, Department of Aerospace Engineering and Engineering Mechanics, University of Cincinnati, Cincinnati, Ohio, USA.
References
- 1.Fant G. Quarterly Progress and Status Report. Vol. 4. Royal Inst of Technology; Stockholm, Sweden: 1982. Preliminaries to analysis of the human voice source; pp. 1–27. [Google Scholar]
- 2.Titze IR. Voice training and therapy with a semi-occluded vocal tract: rationale and scientific underpinnings. Journal of Speech, Language, and Hearing Research. 2006;49:448–459. doi: 10.1044/1092-4388(2006/035). [DOI] [PubMed] [Google Scholar]
- 3.Rothenberg M. A new inverse-filtering technique for deriving the glottal air flow waveform during voicing. The Journal of the Acoustical Society of America. 1973;53:1632–1645. doi: 10.1121/1.1913513. [DOI] [PubMed] [Google Scholar]
- 4.Holmberg EB, Hillman RE, Perkell JS. Glottal airflow and transglottal air pressure measurements for male and female speakers in soft, normal, and loud voice. Journal of the Acoustical Society of America. 1988;84:511–529. doi: 10.1121/1.396829. [DOI] [PubMed] [Google Scholar]
- 5.Klatt DH, Klatt LC. Analysis, synthesis, and perception of voice quality variations among female and male talkers. The Journal of the Acoustical Society of America. 1990;87:820–857. doi: 10.1121/1.398894. [DOI] [PubMed] [Google Scholar]
- 6.Perkell JS, Hillman RE, Holmberg EB. Group differences in measures of voice production and revised values of maximum airflow declination rate. The Journal of the Acoustical Society of America. 1994;96:695–698. doi: 10.1121/1.410307. [DOI] [PubMed] [Google Scholar]
- 7.Javkin HR, Antõnanzas-Barroso N, Maddieson I. Digital inverse filtering for linguistic research. Journal of Speech, Language, and Hearing Research. 1987;30:122–129. doi: 10.1044/jshr.3001.122. [DOI] [PubMed] [Google Scholar]
- 8.Verneuil A, Berry DA, Kreiman J, Gerratt BR, Ming YE, Berke GS. Modeling measured glottal volume velocity waveforms. The Annals of Otology, Rhinology, and Laryngology. 2003;112:120–131. doi: 10.1177/000348940311200204. [DOI] [PubMed] [Google Scholar]
- 9.Khosla S, Muruguppan S, Gutmark E, Scherer R. Vortical flow field during phonation in an excised canine larynx model. The Annals of Otology, Rhinology, and Laryngology. 2007;116:217–228. doi: 10.1177/000348940711600310. [DOI] [PMC free article] [PubMed] [Google Scholar]
- 10.Khosla S, Murugappan S, Lakhamraju R, Gutmark E. Using particle imaging velocimetry to measure anterior-posterior velocity gradients in the excised canine larynx model. The Annals of Otology, Rhinology, and Laryngology. 2008;117:134–144. doi: 10.1177/000348940811700212. [DOI] [PMC free article] [PubMed] [Google Scholar]
- 11.Khosla S, Oren L, Ying J, Gutmark E. Direct simultaneous measurement of intraglottal geometry and velocity fields in excised larynges. The Laryngoscope. 2013;124:S1–S13. doi: 10.1002/lary.24512. [DOI] [PubMed] [Google Scholar]
- 12.Oren L, Khosla S, Gutmark E. Intraglottal geometry and velocity measurements in canine larynges. The Journal of the Acoustical Society of America. 2014;135:380–388. doi: 10.1121/1.4837222. [DOI] [PMC free article] [PubMed] [Google Scholar]
- 13.Granqvist S, Hertegård S, Larsson H, Sundberg J. Simultaneous analysis of vocal fold vibration and transglottal airflow: exploring a new experimental setup. Journal of Voice. 2003;17:319–330. doi: 10.1067/s0892-1997(03)00070-5. [DOI] [PubMed] [Google Scholar]
- 14.Alipour F, Scherer RC. Pulsatile airflow during phonation: An excised larynx model. The Journal of the Acoustical Society of America. 1995;97:1241–1248. doi: 10.1121/1.412233. [DOI] [PubMed] [Google Scholar]
- 15.Oren L, Khosla S, Gutmark E. Intraglottal pressure distribution computed from empirical velocity data in canine larynx. Journal of Biomechanics. 2014;47:1287–1293. doi: 10.1016/j.jbiomech.2014.02.023. [DOI] [PMC free article] [PubMed] [Google Scholar]
- 16.Sapienza CM, Stathopoulos ET. Respiratory and laryngeal measures of children and women with bilateral vocal fold nodules. Journal of Speech, Language, and Hearing Research. 1994;37:1229–1243. doi: 10.1044/jshr.3706.1229. [DOI] [PubMed] [Google Scholar]
- 17.Scherer RC, Sundberg J, Titze IR. Laryngeal adduction related to characteristics of the flow glottogram. The Journal of the Acoustical Society of America. 1989;85:S129. [Google Scholar]
- 18.Sundberg J, Gauffin J. Waveform and spectrum of the glottal voice source. Frontiers of speech communication research. 1979:301–322. [Google Scholar]
- 19.Stevens KN. Acoustic Phonetics. Cambridge MA: MIT Press; 2000. pp. 1–202. [Google Scholar]
- 20.Murugappan S, Khosla S, Casper K, Oren L, Gutmark E. Flow fields and acoustics in a unilateral scarred vocal fold model. The Annals of Otology, Rhinology, and Laryngology. 2009;118:44–50. doi: 10.1177/000348940911800108. [DOI] [PubMed] [Google Scholar]
- 21.Titze IR. Theoretical analysis of maximum flow declination rate versus maximum area declination rate in phonation. Journal of Speech, Language, and Hearing Research. 2006;49:439–447. doi: 10.1044/1092-4388(2006/034). [DOI] [PubMed] [Google Scholar]
- 22.Oren L, Dembinski D, Gutmark E, Khosla S. Characterization of the vocal fold vertical stiffness in a canine model. Journal of Voice. 2014;28:297–304. doi: 10.1016/j.jvoice.2013.11.001. [DOI] [PMC free article] [PubMed] [Google Scholar]
- 23.Chhetri DK, Zhang Z, Neubauer J. Measurement of Young’s modulus of vocal folds by indentation. Journal of Voice. 2011;25:1–7. doi: 10.1016/j.jvoice.2009.09.005. [DOI] [PMC free article] [PubMed] [Google Scholar]