

Abstract
Mitochondrial impairment as evidenced by decline in adenosine 5′-triphosphate (ATP) is associated with oxidative stress in Alzheimer’s neuropathology and suggests that mitochondria may fail to maintain cellular energy, through reduced ATP production in neurons. To gain insights into the ATP characteristics of Alzheimer’s disease transgenic (Tg) mice, we investigated ATP contents in the brain and whole blood of Tg mice at three ages (1-, 5- and 24-month-old). Overall, our results demonstrate that tissue ATP contents in Tg mice are significantly reduced, suggesting a decrease of tissue ATP production and mitochondrial dysfunction.
Keywords: Alzheimer’s disease (AD), adenosine 5′-triphosphate (ATP) contents, oxidative stress, Alzheimer’s transgenic (Tg) mouse model
INTRODUCTION
Alzheimer’s disease (AD) is characterized by progressive cognitive impairment beginning with prominent deficits in short-term memory [1]. Due to the high energy demands of neurons and glia, a considerable amount of adenosine 5′-triphosphate (ATP) is consumed in the brain. Also, because no energy storage (such as fat or glucose) is available in the central nervous system (CNS), brain cells must continually produce ATP to maintain activity and energy homeostasis [2]. Mitochondria are known as the power house of the cell and play a prominent role in ATP production during the Krebs cycle. However, aged/damaged mitochondria are thought to produce excess free radicals, which can actually decrease ATP supply and lead to energy decline and mitochondrial impairment induced by oxidative stress in AD neuropathology [3, 4]. Moreover, Mao et al. have implicated that oxidative stress can contribute to the etiopathology of AD [5]. Our previous studies also support this hypothesis and suggest that oxidative stress can lead to antioxidant system imbalance and oxidative macromolecule damage characterized by protein modifications and DNA oxidation in AD transgenic mice [6–10].
Furthermore, inflammatory pathways can be activated as a response to oxidative stress in the AD brain, which may exacerbate AD neuropathology. There are two types of inflammation pathways, which include acute (beneficial) and chronic (detrimental) stages. The former is an early stage response and is predominantly important for quickly activating the immune system [11]. However, upon continual activation of acute inflammation, reactive oxygen species (ROS) accumulate which can damage mitochondria and increase ROS production, a cycle that leads to cell malfunction and apoptosis [12]. In addition, defects in mitochondria may cause reduced ability to maintain cellular energy, leading to changes in oxygen consumption, alternations in mitochondrial membrane potential, and abnormal ATP levels in neurons. Camandola’s group reported that Cl−-ATPase and Na+/K+-ATPase were abnormal in the AD brain, resulting in the reduction of gradients of Na+, K+ and Cl− between cell membranes and resulted in cellular excitotoxicity and neuronal apoptosis [13].
In this study, we used an AD-Tg mouse model (B6.Cg-Tg) that begins to develop amyloid plaques at 6-month of age [14]. To obtain a better understanding of ATP characteristics of AD-Tg mice at different age stages, we investigated ATP contents in the brain and whole blood of Tg mice compared to their age-matched wild type (Wt) littermates at 1-, 5- and 24-month-old in this study.
MATERIALS AND METHODS
Chemicals and reagents
Sodium chloride (NaCl), potassium chloride (KCl), sodium phosphate dibasic (Na2HPO4), potassium phosphate monobasic (KH2PO4), ethylenediaminetetraacetic acid (EDTA), potassium hydroxide (KOH) and perchloric acid (PCA) were purchased from Sigma (St. Louis, MO). The ATP bioluminescence assay kit was obtained from Promega ENLITEN® (Madison, WI). 137 mM NaCl, 2.7 mM KCl, 10 mM Na2HPO4 and 1.8 mM KH2PO4 were used to make 1X phosphate buffered saline (PBS). 30% KOH was applied as a neutralizing agent. 5% PCA was utilized for ATP extraction.
Animals
An AD-Tg mouse model (B6.Cg-Tg (APPswe, PSEN1dE9) 85Dbo/J, stock no. 005864) and Wt mice (C57BL/6J, stock no. 000664) from the Jackson Laboratory (Bar Harbor, ME) were investigated in this study. Animals were divided into different age groups at 1-, 5- and 24-month-old (N=3/group). All procedures for the handling of mice were approved by the Institutional Animal Care and Use Committee at Louisiana Tech University.
Measurement of ATP levels
An ATP bioluminescence assay was employed to determine ATP levels in the brain and whole blood of AD-Tg/Wt mouse cohorts at 3 age stages (N=3/group). Whole blood samples were collected from cardiac puncture under deep anesthesia after intraperitoneal injection of sodium pentobarbital (60 mg/kg). To prevent coagulation, 6% EDTA was added (ratio 19:1) to precooled centrifuge tubes. Mice were decapitated and brains were rapidly removed and rinsed with 1X PBS on ice. Brain and whole blood samples were stored at −80 °C until use. Upon use, to release ATP from cells and inhibit ATP-degrading enzymes, each sample was homogenized with 5% PCA (final concentration 0.5–2.5%) on ice and neutralized with 30% KOH to pH 7.7, then followed by centrifugation at 14,000 × g for 10 min. Supernatants were collected and incubated with lysis buffer containing the luciferase reagent for 7 min at 25 °C. A GloMax 20/20 luminometer from Promega ENLITEN® (Madison, WI) was used according to the manufacturer instructions for measurement of the luminescent signal of each sample in triplicate [15]. Furthermore, sample pellets were reconstituted with 1X PBS and used to determine the protein concentrations by using the BCA assay kit from Thermo Fisher Scientific (Waltham, MA). The signal was detected at 562 nm by using a NanoDrop 2000/2000c UV-Vis Spectrophotometer from Thermo Scientific (Wilmington, DE).
Statistical analyses
Statistical analyses between groups were conducted via two-way ANOVA with Tukey’s Multiple Comparison post-hoc test using Graphpad Prism 6.02 software (La Jolla, CA). A value of P<0.05 was accepted as significant. All values have been expressed as Mean ± SEM, N=3/group.
RESULTS AND DISCUSSION
In this study, a bioluminescence assay was used to monitor tissue ATP levels in brain and whole blood samples of mice at different age stages. We found a significant impact of age (1- v.s. 24-month-old) on ATP contents in the brains of both Tg (+P=0.025) and Wt mice (+P=0.023), whereas no difference was observed between Tg and Wt mice at 1-month-old, indicating that young animals may have low baseline levels of ATP contents at preclinical stages of AD phenotype. Conversely, timepoints where AD neuropathology was mature, we found significant effects of genotype (5-month, **P=0.003; 24-month, *P=0.043), suggesting a strong decrease in ATP levels in AD brains. Accordingly, brain levels of ATP were significantly increased in Tg and Wt mice from 1- to 24-month-old, and brain ATP levels in Tg mice were significantly lower than their age-matched Wt mice shown in Figure 1A, demonstrating that the antioxidant system may be compromised in the aged mouse brain, thereby impacting the supply of tissue ATP in AD brains. In whole blood, we observed no significant impact of age, however, a dramatic increase of blood ATP levels was observed between Wt and Tg mice at 5-month-old (*P=0.014, Fig. 1B). This may indicate that the compensation of mitochondrial impairment is present at this age.
Figure 1.
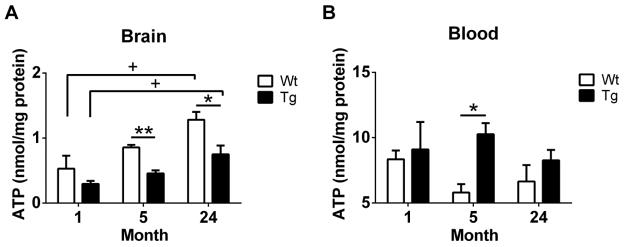
ATP contents were detected by ATP bioluminescence assay in the brain and whole blood of Wt and Tg mice at 3 age stages (1-, 5- and 24-month-old). (A) ATP levels in brains of Wt and Tg mice at different age stages. (B) ATP levels in whole blood samples of Wt and Tg animals at 3 ages. All data are expressed as Mean ± SEM, N=3/group. Statistical analyses were conducted via 2-way ANOVA with Tukey’s Multiple Comparison post-hoc test.
Age: 1- v.s. 24-month. +P<0.05.
Genotype: Wt v.s. Tg. *P<0.05, **P<0.01.
Collectively, these results suggest that AD brains are susceptible to oxidative insults, and mitochondrial dysfunction may be occurring, possibly secondary to increased mitochondrial production of ROS. Moreover, because we observed ATP levels to be lower in the brain than in blood, the brain may be an early site to have mitochondrial impairment in AD progression. Alternatively, the pattern of alternations in tissue ATP contents was not mirrored in blood, so that the oxidative status in the blood may not be a direct reflection of what is occurring in brain. In support of this contention, our previous work has also found that the glutathione redox status in blood not be consistent with the brain [7]. Our future studies aim to gain an integrated and systematic view of bioenergetics (levels of deoxyribonucleotide triphosphates, oxygen consumption rate and mitochondrial transmembrane potential) in AD and further refine brain-blood energy relationships though investigating mitochondrial ATP levels in different AD-related brain regions (hippocampus and cortex) and in peripheral organs rich in mitochondria (muscle, heart, kidneys and liver).
CONCLUSION
In this study, we find that ATP levels are significantly increased in brains of both aged AD-Tg and Wt mice, whereas the ATP contents in Tg mice are lower than the age-matched Wt mice, suggesting that abnormal tissue ATP status may be caused by mitochondrial dysfunction associated with the increased production of ROS [16, 17]. Furthermore, a decrease in energy metabolism in mitochondria may be involved in AD pathogenesis, thereafter leading to a decline in ATP generation [18]. Our blood ATP analysis indicates that there is no age difference, while ATP levels in AD-Tg mice are higher than the Wt mice, which might be due to the compensation of mitochondrial dysfunction. Overall, these results serve as a fundamental reference of the ATP status and further guide the direction of our future longitudinal study in mitochondrial dysfunction related to AD neuropathology.
Acknowledgments
This project was supported by the National Center for Research Resources (Grant Number P20RR016456), the Louisiana Board of Regents Support Fund and NIH Grants AG032755 and AG010483. We gratefully appreciate the constructive insights of Dr. Tak Yee Aw; the technical support of Dr. Magdalena L. Circu; and the animal care of Dr. James Spaulding.
References
- 1.Kuo CC, Zhang C, Rissman RA, Chiu AW. Long-Term Electrophysiological and Behavioral Analysis on the Improvement of Visual Working Memory Load, Training Gains, and Transfer Benefits. J Behav Brain Sci. 2014;4:234–246. doi: 10.4236/jbbs.2014.45025. [DOI] [PMC free article] [PubMed] [Google Scholar]
- 2.Khatri N, Man HY. Synaptic activity and bioenergy homeostasis: implications in brain trauma and neurodegenerative diseases. Front Neurol. 2013;4:199. doi: 10.3389/fneur.2013.00199. [DOI] [PMC free article] [PubMed] [Google Scholar]
- 3.Paula I, Moreira CC, Zhu Xiongwei, Smith Mark A, Pery George. Mitochondrial dysfunction is a trigger of Alzheimer’s disease pathophysiology. Biochimica et Biophysica Acta. 2010;1802:2–10. doi: 10.1016/j.bbadis.2009.10.006. [DOI] [PubMed] [Google Scholar]
- 4.Wang X, Wang W, Li L, Perry G, Lee HG, Zhu X. Oxidative stress and mitochondrial dysfunction in Alzheimer’s disease. Biochim Biophys Acta. 2014;1842:1240–1247. doi: 10.1016/j.bbadis.2013.10.015. [DOI] [PMC free article] [PubMed] [Google Scholar]
- 5.Mao P, Manczak M, Calkins MJ, Truong Q, Reddy TP, Reddy AP, Shirendeb U, Lo HH, Rabinovitch PS, Reddy PH. Mitochondria-targeted catalase reduces abnormal APP processing, amyloid beta production and BACE1 in a mouse model of Alzheimer’s disease: implications for neuroprotection and lifespan extension. Hum Mol Genet. 2012;21:2973–2990. doi: 10.1093/hmg/dds128. [DOI] [PMC free article] [PubMed] [Google Scholar]
- 6.Zhang C, Nestorova G, Rissman RA, Feng J. Detection and quantification of 8-hydroxy-2′-deoxyguanosine in Alzheimer’s transgenic mouse urine using capillary electrophoresis. Electrophoresis. 2013;34:2268–2274. doi: 10.1002/elps.201300036. [DOI] [PMC free article] [PubMed] [Google Scholar]
- 7.Zhang C, Rodriguez C, Spaulding J, Aw TY, Feng J. Age-dependent and tissue-related glutathione redox status in a mouse model of Alzheimer’s disease. J Alzheimers Dis. 2012;28:655–666. doi: 10.3233/JAD-2011-111244. [DOI] [PMC free article] [PubMed] [Google Scholar]
- 8.Zhang C, Kuo CC, Chiu AW, Feng J. Prediction of S-glutathionylated proteins progression in Alzheimer’s transgenic mouse model using principle component analysis. J Alzheimers Dis. 2012;30:919–934. doi: 10.3233/JAD-2012-120028. [DOI] [PMC free article] [PubMed] [Google Scholar]
- 9.Zhang C, Rodriguez C, Circu ML, Aw TY, Feng J. S-Glutathionyl quantification in the attomole range using glutaredoxin-3-catalyzed cysteine derivatization and capillary gel electrophoresis with laser-induced fluorescence detection. Anal Bioanal Chem. 2011;401:2165–2175. doi: 10.1007/s00216-011-5311-x. [DOI] [PMC free article] [PubMed] [Google Scholar]
- 10.Wang S, Njoroge SK, Battle K, Zhang C, Hollins BC, Soper SA, Feng J. Two-dimensional nitrosylated protein fingerprinting by using poly (methyl methacrylate) microchips. Lab Chip. 2012;12:3362–3369. doi: 10.1039/c2lc40132k. [DOI] [PubMed] [Google Scholar]
- 11.Akiyama H, Barger S, Barnum S, Bradt B, Bauer J, Cole GM, Cooper NR, Eikelenboom P, Emmerling M, Fiebich BL, Finch CE, Frautschy S, Griffin WS, Hampel H, Hull M, Landreth G, Lue L, Mrak R, Mackenzie IR, McGeer PL, O’Banion MK, Pachter J, Pasinetti G, Plata-Salaman C, Rogers J, Rydel R, Shen Y, Streit W, Strohmeyer R, Tooyoma I, Van Muiswinkel FL, Veerhuis R, Walker D, Webster S, Wegrzyniak B, Wenk G, Wyss-Coray T. Inflammation and Alzheimer’s disease. Neurobiol Aging. 2000;21:383–421. doi: 10.1016/s0197-4580(00)00124-x. [DOI] [PMC free article] [PubMed] [Google Scholar]
- 12.Reuter S, Gupta SC, Chaturvedi MM, Aggarwal BB. Oxidative stress, inflammation, and cancer: how are they linked? Free Radic Biol Med. 2010;49:1603–1616. doi: 10.1016/j.freeradbiomed.2010.09.006. [DOI] [PMC free article] [PubMed] [Google Scholar]
- 13.Camandola S, Mattson MP. Aberrant subcellular neuronal calcium regulation in aging and Alzheimer’s disease. Biochim Biophys Acta. 2011;1813:965–973. doi: 10.1016/j.bbamcr.2010.10.005. [DOI] [PMC free article] [PubMed] [Google Scholar]
- 14.Jankowsky JL, Slunt HH, Ratovitski T, Jenkins NA, Copeland NG, Borchelt DR. Co-expression of multiple transgenes in mouse CNS: a comparison of strategies. Biomol Eng. 2001;17:157–165. doi: 10.1016/s1389-0344(01)00067-3. [DOI] [PubMed] [Google Scholar]
- 15.Circu ML, Rodriguez C, Maloney R, Moyer MP, Aw TY. Contribution of mitochondrial GSH transport to matrix GSH status and colonic epithelial cell apoptosis. Free Radic Biol Med. 2008;44:768–778. doi: 10.1016/j.freeradbiomed.2007.09.011. [DOI] [PMC free article] [PubMed] [Google Scholar]
- 16.Rigotti A, Cohen DE, Zanlungo S. STARTing to understand MLN64 function in cholesterol transport. J Lipid Res. 51:2015–2017. doi: 10.1194/jlr.E008854. [DOI] [PMC free article] [PubMed] [Google Scholar]
- 17.Hirai K, Aliev G, Nunomura A, Fujioka H, Russell RL, Atwood CS, Johnson AB, Kress Y, Vinters HV, Tabaton M, Shimohama S, Cash AD, Siedlak SL, Harris PL, Jones PK, Petersen RB, Perry G, Smith MA. Mitochondrial abnormalities in Alzheimer’s disease. J Neurosci. 2001;21:3017–3023. doi: 10.1523/JNEUROSCI.21-09-03017.2001. [DOI] [PMC free article] [PubMed] [Google Scholar]
- 18.Mikirova N, Riordan HD, Jackson JA, Wong K, Miranda-Massari JR, Gonzalez MJ. Erythrocyte membrane fatty acid composition in cancer patients. P R Health Sci J. 2004;23:107–113. [PubMed] [Google Scholar]