Abstract
Curve of left ventricular (LV) volume changes throughout the cardiac cycle is a fundamental parameter for clinical evaluation of various cardiovascular diseases. Currently, this evaluation is often performed manually which is tedious and time consuming and suffers from significant interobserver and intraobserver variability. This paper introduces a new automatic method, based on nonlinear dimensionality reduction (NLDR) for extracting the curve of the LV volume changes over a cardiac cycle from two-dimensional (2-D) echocardiography images. Isometric feature mapping (Isomap) is one of the most popular NLDR algorithms. In this study, a modified version of Isomap algorithm, where image to image distance metric is computed using nonrigid registration, is applied on 2-D echocardiography images of one cycle of heart. Using this approach, the nonlinear information of these images is embedded in a 2-D manifold and each image is characterized by a symbol on the constructed manifold. This new representation visualizes the relationship between these images based on LV volume changes and allows extracting the curve of the LV volume changes automatically. Our method in comparison to the traditional segmentation algorithms does not need any LV myocardial segmentation and tracking, particularly difficult in the echocardiography images. Moreover, a large data set under various diseases for training is not required. The results obtained by our method are quantitatively evaluated to those obtained manually by the highly experienced echocardiographer on ten healthy volunteers and six patients which depict the usefulness of the presented method.
Keywords: Echocardiography images, Left ventricular volume changes, Nonlinear dimensionality reduction
Introduction
Quantitative measurement of the left ventricle (LV) function is an important step in the assessment of heart diseases [1–3]. A number of indices of the LV function are derived from the measurement of LV volume such as LV ejection fraction (the ratio of change in LV volume between end diastole (ED) and end systole (ES)) and LV volume changes over time (one or two cardiac cycle). These indices are fundamental parameters for global LV function assessment [1–3]. The LV volume changes throughout the cardiac cycle provide a possibility of more detailed assessment of cardiac hemodynamic (LV filling and ejection phases) and can be used as a tool for differentiation between normal subjects and patients with a wide variety of cardiac diseases. For example, in coronary artery diseases, normal pattern of LV filling and emptying will be changed. This parameter has become the main criteria for selection of an implantable cardioverter-defibrillator and resynchronization therapy [4]. Besides, in several clinical studies, LV volume changes have been used as an outcome variable [4]. Currently, echocardiography is the preferred method for calculation of this parameter because of its low cost, availability, and high temporal resolution. Two echocardiography methods are used to estimate LV volume changes throughout the cardiac cycle [2, 3]; first, visual inspection and second, manual tracing of the endocardial borders, both carried on by highly experienced echocardiographer. Visual assessment is based on the recognition of LV wall motion pattern from apical views of the heart. The second method requires accurate manual delineating of the endocardial borders of LV on echocardiography images of a complete cardiac cycle. This method is tedious and time consuming. In addition, these two methods are subjective and highly dependent on training and experience. Thus, a robust and accurate automated method for calculating LV volume changes is highly desirable, particularly for the less experienced echocardiographer.
Different image processing techniques have been proposed for automatic computation of LV volume changes from two-dimensional (2-D) echocardiography images. In all these techniques [4–12], first inner wall of LV is separated automatically in all images of a cardiac cycle. This is done with different image processing methods such as active contour models [5–7], active shape model [8], active appearance motion model [9], a combination of database-guided segmentation and an information fusion framework for robust shape tracking [4, 10], a weighted radial edge filtering algorithm [11], and a combination of multiresolution edge detection technique based on the global maximum of wavelet transform and radial search algorithm [12]. It should be noted some of these image processing algorithms are also used in segmentation of LV from cardiac MR images [13–15]. Then, LV volume changes are calculated by applying a standard approximating equation on LV extracted contour in each image. However, automatic segmentation and tracking the endocardial borders of the LV in 2-D echocardiography images are difficult image processing tasks due to the high level of uncorrelated speckle noise, and artifacts from valves and papillary muscles [9, 16]. Moreover, because of the opening of the mitral valve during diastole phase, automatic segmentation of the LV in four chamber view is difficult. Furthermore, in some of these methods [4, 8–10], a large data set under various diseases is required for training of shape and textural information within LV region.
In this study, we attempt to overcome these difficulties by proposing a new automatic method based on nonlinear dimensionality reduction (NLDR), for estimation of LV volume changes during a cardiac cycle. NLDR algorithms include a class of machine learning techniques embedding data sets from high to lower dimensional parameterizations while respecting the intrinsic geometry of the data sets [17–20]. The paper by Tenenbaum et al. [17] offers an excellent explanation of the NLDR method with examples of how it works and can be used; additional detail is provided in [18–20]. These algorithms can be used for image analysis because images can be thought of as points in a high dimensional space with dimension size equal to the number of pixels in the image. By these approaches, the images of one cycle of heart are embedded in a 2-D space (each image is characterized by a symbol in 2-D space). This new useful parameterization visualizes the relationship between these images based on LV volume changes and allows extracting the curve of the LV volume changes automatically.
Materials and Methods
Cardiac Cycle
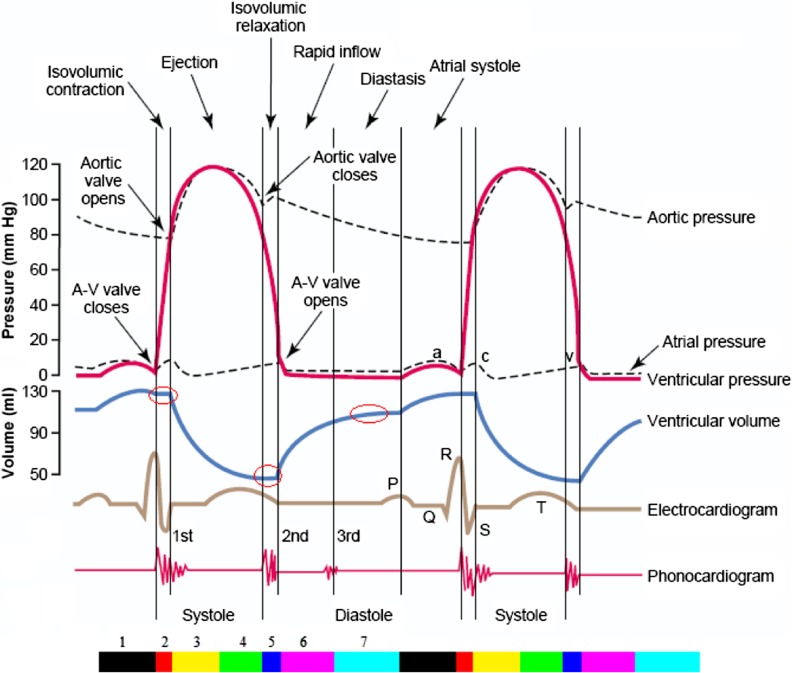
A cardiac cycle can be divided into seven phases (Fig. 1) [1]. First, “Atrial Contraction”, that is the result of the atrial musculature contraction which gives an additional thrust to inflow blood into the ventricles. Second, “Isovolumetric Contraction”, during which ventricular volume does not change because all valves are closed. In addition, the ventricular volume is maximum called the end diastolic volume. Third, “Rapid Ejection”, the first third of the ejection period in which 70 % of ventricular emptying occurs. Fourth, “Reduced Ejection”, it is the last two third of the ejection period in which the rate of ejection decreases so that only 30 % of ventricular emptying occurs. Fifth, “Isovolumetric Relaxation”, the ventricular volume remains constant during this phase because all valves are closed. Moreover, the ventricular volume is minimum called the end systolic volume. Sixth, “Rapid Filling”, in this phase, blood flows into the ventricles rapidly from the atrium. Seventh, “Reduced Filling”, during this phase, the change in ventricular volume is very little due to low blood entering to the ventricles and less compliant of ventricles.
Fig. 1.
Two cardiac cycles diagram. The color bar illustrates seven phases of cardiac cycle (First phase: black, second: red, third: yellow, forth: green, fifth: blue, sixth: magenta, seventh: cyan) [1]
LV Volume Computation from 2-D Echocardiography Images
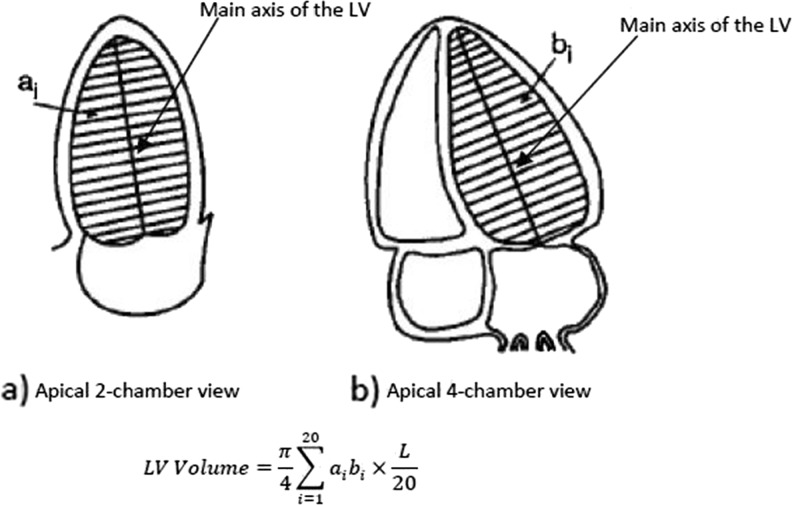
The American Society of Echocardiography (ASE) recommends several methods for LV volume computation from 2-D echocardiography images based on geometric models of the LV, dimensions, and area measurements obtained from long axis apical and short axis views [2, 3, 21]. According to the ASE, the biplane method of discs (modified Simpson’s rule) based on paired long axis apical views (two and four chamber) is the best method to compute LV volume (Fig. 2). In this process [2, 3, 21], the inner wall of the LV from the two and four chamber views is separated. Then, the main axis of LV in two views (maximal distance from the mid-mitral annulus to the LV apex) is determined and next LV contour is divided into 20 equal sections so that each section is perpendicular to the main axis (Fig. 2). Finally, LV volume is calculated according to the summation of areas of 20 elliptical discs of equal height whose centers are all in the main axis. Generally, for LV volume calculation using modified Simpson’s rule, the two apical views are used. However, for routine use, one apical view is accepted and can be applied to either long axis apical views [3]. In this case, the area of the disc is assumed to be circular and equation for LV volume calculation is as follows:
| 1 |
Fig. 2.
LV volume calculation from 2-D echocardiography image using modified Simpson’s rule based on paired long axis apical views (L is the longer of the two main axes of the LV and, a i, b i are the diameters of the ith disc LV contour from the two and four chamber views)
where di is the diameter of the ith disc LV contour and L is the length of the LV main axis from the two or four chamber views.
Data Description
The study was performed according to the Helsinki Declaration and approved by the Regional Committee for Medical Research Ethics. Two consecutive cardiac cycles of 2-D images of ten healthy volunteers and six patients (ischemic heart disease) from apical four chamber view were acquired using an ultrasound machine (General Electric Vivid 3, Horten, Norway), including the electrocardiogram (ECG) recording. Each cardiac cycle was identified by selecting the two consecutive R-wave of ECG signal synchronized with the end of diastole. The heart rates ranging are from 45 to 95 beats per minute (bpm) and the frame rates of image recording are from 40 to 70 frames per second (fps). Moreover, the curve of the LV volume changes in each cardiac cycle is calculated by a highly experienced echocardiographer. To do this, the echocardiographer first manually detects the inner wall and main axis of the LV in each image of a cardiac cycle. Then, LV volume is calculated using single plane modified Simpson’s rule method (Eq. (1)).
NLDR Algorithms
NLDR algorithms embed data sets from high to lower dimensional parameterizations while the intrinsic geometry of the data sets is respected [17–20]. Images can be thought of as points in a high dimensional space with dimension size equal to the number of pixels in the image. However, when image sets vary due to a small number of factors (lighting, deformation, etc.), these images have a natural low dimensional parameterization in high dimensional space which can be extracted by NLDR algorithms [17–20].
NLDR algorithms have been used for visualization of image sets (rendered faces, handwritten digits, head pose, and writing style) [17, 19, 22]. Moreover, these algorithms have been widely used for medical image analysis such as visualization of cardiopulmonary MR images [23] and echocardiography images [24], classification in brain MR images [25], tracking of the LV in 3-D echocardiography images and heart in 3-D CT images [26], segmentation of breast MR images [27], assessment of regional and global wall motion abnormalities in echocardiography images [28], and detection of polyps in CT colonography images [29, 30].
Isometric feature mapping (Isomap) [17], Locally Linear Embeddings [18, 19], and Laplacian eigenmaps [20] are the most popular NLDR algorithms. In this paper, we have used Isomap algorithm. This algorithm attempts to extract low dimensional parameterizations for data sets in a high dimensional space in such a way that pairwise geodesic distances are preserved so that nearby and far points in high dimensional space map to nearby and far points in low dimensional space [17]. The most common image distance metric for computing the pairwise geodesic distances in Isomap algorithm is the square root of the sum of squared pixel intensities difference between homologous pixels [17]. However, when image sets vary due to the nonrigid deformation of a specific object, an alternative image distance metric based on measuring similarity in terms of nonrigid deformation in image sets is required [22, 31]. This leads to capturing the variation of image sets in the resulting embedding more accurately. Echocardiography images of one cardiac cycle vary due to the nonrigid deformation of the LV caused by the subject’s heartbeat. Therefore, in this study, we have used an image distance metric based on the parameters of the nonrigid transformation model produced by a fully automated image registration method. This nonrigid transformation model is based on an affine transformation for modelling the global LV motion and a B-spline free-form deformation transformation for modelling the local LV deformation [32, 33]. Image registration as an optimization problem finds the optimal parameters of the transformation model so that the mapped image at the time t1, is as close as possible to the reference image taken at time t2. In conclusion, the final parameters of nonrigid transformation model calculated by image registration method between image pairs are used to define pairwise image distance measure [28].
In summary, suppose that there are n images as the high dimensional data points, the improved version of Isomap algorithm is as follows:
Compute the distance between all pairs of images in the input space using the method described above. Then, create a neighborhood graph, in which each image is taken as a node and is connected to its k nearest neighbors (the value of k is specified by the user and usually selected 5 to 10). Thus, in this graph, the edge between two nodes exists if these two nodes are neighbors and the length of this edge is the distance between the two images. After that, the shortest path for each pair of nodes through neighborhood graph named geodesic distance is computed using Dijkstra’s or Floyd-Warshall shortest path algorithm [34, 35]. By calculation of geodesic distance between all pairs of nodes, the matrix of pairwise geodesic distance is constructed. The final step applies multidimensional scaling (MDS) [36] on the resulting geodesic distance matrix to construct the low dimensional data points.
Statistical Analysis
In this paper, the mean absolute distance (MAD) is used for measuring the difference between paired curve symbols as follows:
| 2 |
where LC and LH are the sets of symbols along the curve of LV volume changes obtained by the proposed method (or other methods) and the reference one, respectively. N is the number of symbols in each curve, and i is the number of sequence of data set. The overall performance measure for each of method is the averaged distance on the whole test set of sequences. We also record the standard deviation of the distance metric for across sequences.
Results
Visualization of Echocardiography Images
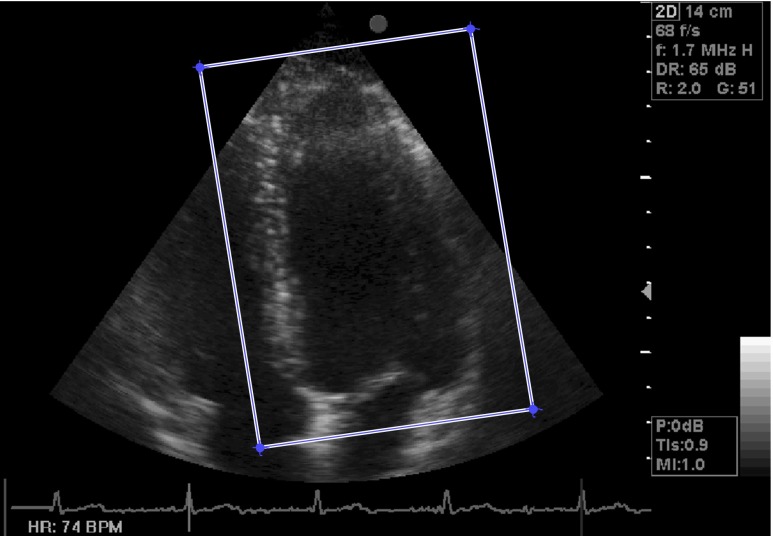
By manually defining a rectangular region of interest (ROI) around the LV on ED image, the approximate region of the LV is extracted from echocardiography images (Fig. 3). This image is chosen because of its maximum LV volume at one cardiac cycle. Then, the coordinates of extracted rectangular ROI are applied on all images of a cardiac cycle automatically. Figure 4 demonstrates ten selected images over one cycle of heart in two subjects. These images are considered as points in a high dimensional space (dimension is equal to the number of pixels in the image). Thus, the dimension of first space is 52000 for these 260 × 200 pixel images. Although the input dimension is very high, these images which are different due to LV nonrigid deformation caused by the subject’s heartbeat have a natural low dimensional parameterization in high dimensional space. This low dimensional parameterization can be extracted by improved Isomap algorithm. Consequently, the echocardiography images of one cycle of heart have been embedded in a 2-D space by the improved Isomap algorithm with k = 8 neighbors (Fig. 5). In this figure, the symbols are the nonlinear projection of the consecutive images of one cycle of heart which are joined by a line based on the frame order and in this way we generate a curve in the 2-D space that is called manifold. In all cases, the cyclic nature of the heart motion leads to a cyclic closed manifold. It is noted that the horizontal and vertical axes do not have units.
Fig. 3.
One image from the sequence with the rectangular box shows the localized LV
Fig. 4.
Ten selected images over one cycle of heart in two cases. Top healthy case and bottom patient case
Fig. 5.
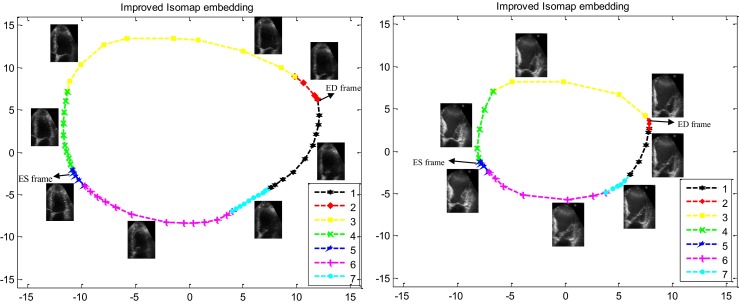
The 2-D nonlinear embedding of one cycle of LV echocardiography images using improved Isomap algorithm (with k = 8 neighbors) in two cases. Left, healthy case (68 fps, 74 bpm, LV ejection fraction = 72 %). Right patient case (42 fps, 86 bpm, LV ejection fraction = 30 %). The seven phases of the cardiac cycle are depicted with different symbols and colors. (First phase: black, second: red, third: yellow, forth: green, fifth: blue, sixth: magenta, seventh: cyan). (The horizontal and vertical axes are dimensionless.)
Improved Isomap algorithm attempts to extract a low dimensional (2-D) data from LV echocardiography images (52000-D) so that geodesic distances between these images are preserved. Therefore, nearby and far images in high dimensional space map to nearby and far symbols in 2-D space. Consequently, in Fig. 5, manifold symbols visualizes the relationship between these images based on distance between them in high dimensional space or other words based on the nonrigid deformation of the LV which results in LV volume changes. As demonstrated in these manifolds (Fig. 5), changes in LV volume in seven phases of the cardiac cycle are observed. The highly experienced echocardiographer by investigating ECG signal have determined manifold symbols corresponding to the seven phases of the cardiac cycle for two above cases and demonstrated with different symbols and colors in Fig. 5. As illustrated in these figures (especially for the normal case), in three phases of the cardiac cycle (second, fifth, and seventh phases), where there are no remarkable changes in LV volume, the distances between symbols are very small. In addition, during the third and fourth phases of the cardiac cycle, in which there are considerable changes in LV volume, symbols are far apart and the distances between them are high. Besides, there is significant distance between consecutive symbols in the manifold during the first and the sixth phases because of considerable LV volume changes. Moreover, because of the highest volume difference (highest LV deformation) between ED and ES images compared to any other two images, the distance between these two symbols is approximately maximum compared to the distance of any other two symbols (Fig. 5). Finally, with increased LV wall motion in healthy case compared with the patient case (increasing the difference between LV echocardiography images), the distances between manifold symbols have increased and consequently the areas of resultant manifold have increased. Consequently, this new visualization demonstrates hemodynamic information of a cardiac cycle and allows a concise evaluation of various stages of ventricular systolic and diastolic function.
Automatic Computation of LV Volume Changes
As described, manifold symbols visualize the relationship between LV echocardiography images of one cycle of heart based on LV volume changes. Therefore, the curve of LV volume changes can be extracted from the resultant manifold. To do this, after automatically determining the symbol corresponding to ES image using the method described in [24], the Euclidean distance between ES symbol and all other symbols in the resultant manifold is calculated. The curve obtained from this distance calculation based on frame number corresponds to LV volume changes of one cycle of the heart (Fig. 6). The LV volume changes curve obtained from the proposed method for a healthy case is similar to LV volume changes curve observed in Fig. 1 for a normal heart. It is noteworthy that the obtained curve of LV volume changes is not scaled based on milliliter. If we want to determine the exact volume at each symbol of this curve, we must scale this obtained curve. To do this, the inner wall (endocardium) and main axis of the LV from the ED and ES images (extracted using the method described in [24]) are detected by the highly experienced echocardiographer. The detected endocardium contour and main axis of the LV are then used to compute LV volume according to the single plane modified Simpson’s rule (Eq. (1)) in each of these two images. Then, calculated ED and ES volumes are used to scale the derived curve of LV volume changes so that ED volume corresponds to maximum Euclidean distance and ES volume corresponds to minimum Euclidean distance (minimum Euclidean distance is zero). In general, the Euclidean distance of each symbol to ES symbol in the resultant manifold is scaled as follows:
| 3 |
Fig. 6.
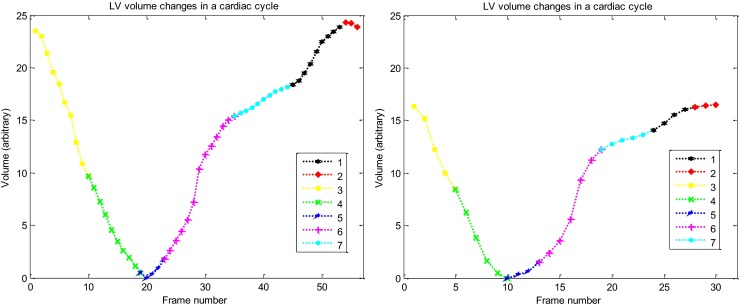
The curves of the LV volume changes measured by the proposed method in one complete cardiac cycle in two cases. Left healthy case and right patient case. (First phase: black, second: red, third: yellow, forth: green, fifth: blue, sixth: magenta, seventh: cyan)
Thus, the curve obtained from the distance of each symbol to ES symbol in the resultant manifold (curve of LV volume changes in Fig. 6) is scaled based on milliliter. Figure 7 demonstrates the obtained curve of LV volume changes after scaling (solid line). This figure also demonstrates the obtained curve of LV volume changes in one complete cardiac cycle for two above cases using the highly experienced echocardiographer (dotted line), standard Isomap method (dashed line), and an automatic echocardiographic image segmentation method using level set [5, 6] (dash-dot line).
Fig. 7.
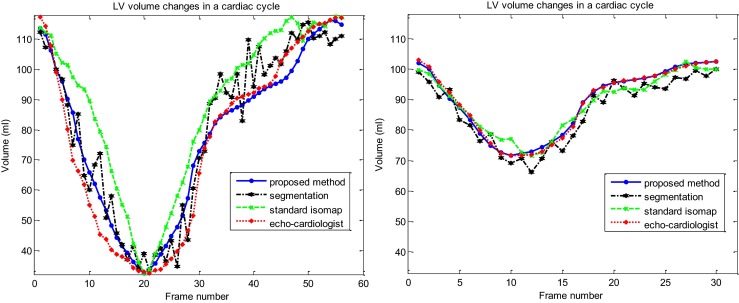
Comparison between the curves of LV volume changes measured by proposed method (solid line), standard Isomap method (dashed line), the image segmentation method (dash-dot line) and those obtained by the highly experienced echo cardiologist (dotted line) in one complete cardiac cycle in two cases. Left healthy case and right patient case
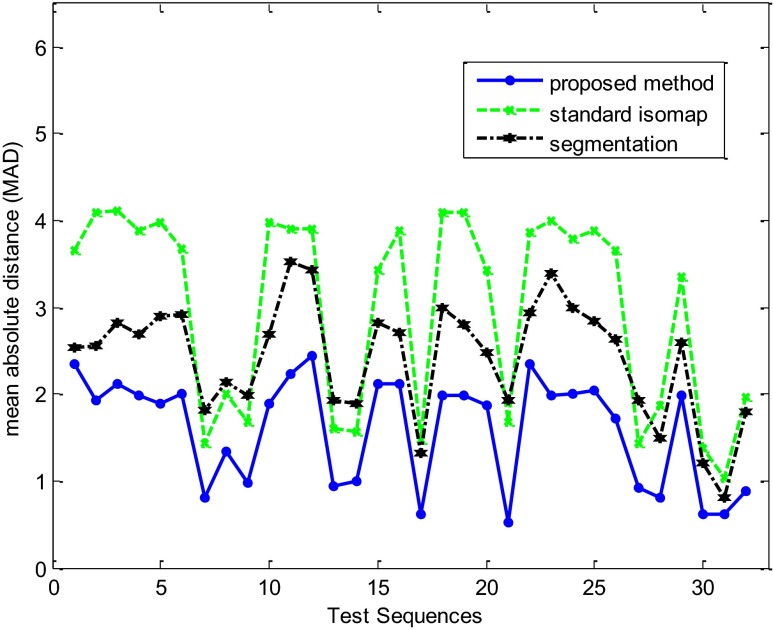
For a systematic quantitative evaluation, the curves of LV volume changes obtained by the proposed method and two other methods mentioned above are compared to those obtained by the reference experienced echocardiographer using MAD in 32 echocardiography image sequences. Figure 8 and Table 1 show the results of quantitative evaluation using this metric. Result showed that the proposed method achieved higher performance in term of MAD (lower average and standard deviation) than the automatic echocardiography image segmentation and the standard Isomap methods. Also, we have found that for all analyzed sequences there is agreement between reference experienced echocardiographer and automatic proposed assessment.
Fig. 8.
MAD between curves of the LV volume changes obtained by the proposed method (solid line), standard Isomap method (dashed line), the automatic image segmentation method (dash-dot line), and those obtained by the highly experienced echocardiographer for 32 test sequences
Table 1.
Quantitative comparison between the proposed method, standard Isomap method, and the automatic segmentation method in term of MAD for 32 test sequences
| Method | MAD |
|---|---|
| Automatic segmentation | 2.42 ± 0.66 |
| Standard Isomap algorithm | 2.99 ± 1.12 |
| Proposed method | 1.59 ± 0.62 |
Discussion
In this paper, a new automatic method, based on NLDR is presented for extracting the curve of LV volume changes nearly identical manual determination by the highly experienced echocardiographer. This method also visualizes the relationship between LV echocardiography images of one cardiac cycle based on LV volume changes. Experimental results demonstrate superiority of the proposed method over the traditional segmentation algorithms for estimation of LV volume changes curve.
Our proposed method has three advantages over other conventional approaches of calculating LV volume changes mentioned in the introduction section. First, any LV myocardial segmentation and tracking, particularly difficult in the echocardiography images, are not needed. Second, a large data set under various diseases for training is not required. Finally, in addition to extracting the curve of LV volume changes, the relationship between images of one cardiac cycle based on LV volume changes are visualized. However, our proposed method has two limitations. First, the accuracy of the proposed method relies on successful nonrigid image registration for computing reliable image to image distance metric in Isomap algorithm which may be affected by the inherent limitations of echocardiography imaging modality and independent movement of the mitral valve, although these effects were minimized by an appropriate and accurate registration method described in the method section. Second, the results obtained by the experienced echocardiographer as gold standard are not ideal. However, to reach clinical acceptance, any quantitative method should be compared against this clinically accepted method.
These results proved that the proposed method is appropriate for 2-D echocardiography images. Next, we are going to test the algorithm on cardiac MR images. In general, the improved Isomap algorithm can also be used in analyzing and the visualization of other medical image sets when images have approximately a few comprising causes of the variation (e.g., nonrigid deformation). Finally, this visualization of echocardiography images, by itself, may be a useful diagnostic tool for the recognition and identification of many cardiac diseases. However, this work needs more research.
Conclusion
A new automatic method, based on NLDR, is successfully presented for estimation of LV volume changes during a cardiac cycle, with good agreement to manual assessment by a highly experienced echocardiographer.
References
- 1.Guyton AC, Hall JE: Textbook of Medical Physiology. Elsevier, 2006
- 2.Gottdiener JS, Bednarz J, Devereux R, et al. Recommendations for use of echocardiography in clinical trials: a report from the American society of echocardiography's guidelines and standards committee and the task force on echocardiography in clinical trials. J Am Soc Echocardiogr. 2004;17:1086–1119. doi: 10.1016/j.echo.2004.07.013. [DOI] [PubMed] [Google Scholar]
- 3.Lang RM, Bierig M, Devereux RB, et al. Recommendations for chamber quantification. Eur J Echocardiogr. 2006;7:79–108. doi: 10.1016/j.euje.2005.12.014. [DOI] [PubMed] [Google Scholar]
- 4.Cannesson M, Tanabe M, Suffoletto MS, et al. A novel two-dimensional echocardiographic image analysis system using artificial intelligence-learned pattern recognition for rapid automated ejection fraction. J Am Coll Cardiol. 2007;49:217–226. doi: 10.1016/j.jacc.2006.08.045. [DOI] [PubMed] [Google Scholar]
- 5.Barcaro U, Moroni D, Salvetti O. Automatic computation of left ventricle ejection fraction from dynamic ultrasound images. Pattern Recognit Image Anal. 2008;18:351–358. doi: 10.1134/S1054661808020247. [DOI] [Google Scholar]
- 6.Ghanbari S, Shalbaf A, Behnam H, http://lib.bioinfo.pl/auth: Sani, ZA et al: Fully automatic segmentation of left ventricle in a sequence of echocardiography images of one cardiac cycle by dynamic directional vector field convolution (DDVFC) method and manifold Learning. Biomed Eng-App Bas C 25:1–15, 2013
- 7.Saini K, Dewal ML, Rohit M. A fast region-based active contour model for boundary detection of echocardiographic images. J Digit Imaging. 2012;25:271–278. doi: 10.1007/s10278-011-9408-8. [DOI] [PMC free article] [PubMed] [Google Scholar]
- 8.Beymer D, Syeda-Mahmood T, Amir A, et al. Automatic estimation of left ventricular dysfunction from echocardiogram videos. Miami: IEEE Workshops on Computer Vision and Pattern Recognition (CVPR); 2009. pp. 164–171. [Google Scholar]
- 9.Bosch JG, Mitchell SC, Lelieveldt BPF, et al. Automatic segmentation of echocardiographic sequences by active appearance motion models. IEEE Trans Med Imaging. 2002;21:1374–1383. doi: 10.1109/TMI.2002.806427. [DOI] [PubMed] [Google Scholar]
- 10.Comaniciu D, Zhou XS, Krishnan S. Robust real-time myocardial border tracking for echocardiography: an information fusion approach. IEEE Trans Med Imaging. 2004;23:849–860. doi: 10.1109/TMI.2004.827967. [DOI] [PubMed] [Google Scholar]
- 11.Bansod P, Desai UB, Merchant SN, et al. Segmentation of left ventricle in short-axis echocardiographic sequences by weighted radial edge filtering and adaptive recovery of dropout regions. Comput Methods Biomech Biomed Eng. 2011;14(7):603–613. doi: 10.1080/10255842.2010.493507. [DOI] [PubMed] [Google Scholar]
- 12.Setarehden SK, Soraghan JJ. Cardiac left ventricular volume changes assessment by long axis echocardiographical image processing. Vision Image Signal Proc. 1998;145:203–212. doi: 10.1049/ip-vis:19982084. [DOI] [Google Scholar]
- 13.Ammar M, Mahmoudi S, Chikh MA, Abbou A. Endocardial border detection in cardiac magnetic resonance images using level set method. J Digit Imaging. 2012;25(2):294–306. doi: 10.1007/s10278-011-9404-z. [DOI] [PMC free article] [PubMed] [Google Scholar]
- 14.Mahapatra D. Cardiac image segmentation from cine cardiac mri using graph cuts and shape priors. J Digit Imaging. 2013;26(4):721–730. doi: 10.1007/s10278-012-9548-5. [DOI] [PMC free article] [PubMed] [Google Scholar]
- 15.Huang S, Liu J, Lee LC, et al. An image-based comprehensive approach for automatic segmentation of left ventricle from cardiac short axis cine MR images. J Digit Imaging. 2011;24(4):598–608. doi: 10.1007/s10278-010-9315-4. [DOI] [PMC free article] [PubMed] [Google Scholar]
- 16.Ledesma-Carbayo MJ, Kybic J, Desco M, et al. Spatio-temporal nonrigid registration for ultrasound cardiac motion estimation. IEEE Trans Med Imaging. 2005;24:1113–1126. doi: 10.1109/TMI.2005.852050. [DOI] [PubMed] [Google Scholar]
- 17.Tenenbaum JB, de Silva V, Langford JC: global geometric framework for nonlinear dimensionality reduction. Science 290:2319–2323, 2000. Reprint available on-line:http://web.mit.edu/cocosci/Papers/sci_reprint.pdf [DOI] [PubMed]
- 18.Roweis ST, Saul LK. Nonlinear dimensionality reduction by locally linear embedding. Science. 2000;290:2323–2326. doi: 10.1126/science.290.5500.2323. [DOI] [PubMed] [Google Scholar]
- 19.Saul L, Roweis S. Think globally, fit locally: unsupervised learning of low dimensional manifolds. J Mach Learn Res. 2003;4:119–155. [Google Scholar]
- 20.Belkin M, Niyogi P. Laplacian Eigenmaps and spectral techniques for embedding and clustering. Adv Neural Inf Process Syst. 2001;14:585–591. [Google Scholar]
- 21.Schiller NB, Shah PM, Crawford M, DeMaria A, et al. Recommendations for quantitation of the left ventricle by two-dimensional echocardiography. American Society of Echocardiography Committee on Standards, subcommittee on quantitation of two-dimensional echocardiograms. J Am Soc Echocardiogr. 1989;2:358–367. doi: 10.1016/S0894-7317(89)80013-6. [DOI] [PubMed] [Google Scholar]
- 22.Pless R, Souvenir R. A survey of manifold learning for images. IPSJ Trans Comput Vision Appl. 2009;1:83–94. doi: 10.2197/ipsjtcva.1.83. [DOI] [Google Scholar]
- 23.Souvenir R, Pless R. Isomap and nonparametric models of image deformation. Breckenridge: IEEE Workshop on Motion and Video Computing (WMVC); 2005. pp. 195–200. [Google Scholar]
- 24.Gifani P, Behnam H, Shalbaf A, Sani ZA. Automatic detection of end-diastole and end-systole from echocardiography images using manifold learning. Physiol Meas. 2010;31:1091–1103. doi: 10.1088/0967-3334/31/9/002. [DOI] [PubMed] [Google Scholar]
- 25.Aljabar P, Rueckert D, Crum WR. Automated morphological analysis of magnetic resonance brain imaging using spectral analysis. NeuroImage. 2008;43:225–235. doi: 10.1016/j.neuroimage.2008.07.055. [DOI] [PubMed] [Google Scholar]
- 26.Yang L, Georgescu B, Zheng Y, et al. Prediction based collaborative trackers (PCT): a robust and accurate approach toward 3D medical object tracking. IEEE Trans Med Imaging. 2011;30:1921–1932. doi: 10.1109/TMI.2011.2158440. [DOI] [PubMed] [Google Scholar]
- 27.Akhbardeh A, Jacobs MA. Comparative analysis of nonlinear dimensionality reduction techniques for breast MRI segmentation. Med Phys. 2012;39:2275–2289. doi: 10.1118/1.3682173. [DOI] [PMC free article] [PubMed] [Google Scholar]
- 28.Shalbaf A, Behnam H, Alizadeh-Sani Z, Shojaifard M: Automated assessment of regional and global wall motion abnormalities in echocardiography images by nonlinear dimensionality reduction. Med Phys 40(5), 2013 [DOI] [PubMed]
- 29.Suzuki K, Zhang J, Xu J. Massive-training artificial neural network coupled with Laplacian–Eigenfunction-based dimensionality reduction for computer aided detection of polyps in CT colonography. IEEE Trans Med Imaging. 2010;29:1907–1917. doi: 10.1109/TMI.2010.2053213. [DOI] [PMC free article] [PubMed] [Google Scholar]
- 30.Wang S, Yao J, Summers RM. Improved classifier for computer-aided polyp detection in CT Colonography by nonlinear dimensionality reduction. Med Phys. 2008;35:1377–1386. doi: 10.1118/1.2870218. [DOI] [PMC free article] [PubMed] [Google Scholar]
- 31.Souvenir R, Pless R. Image distance functions for manifold learning. Image Vision Comput. 2007;25:365–373. doi: 10.1016/j.imavis.2006.01.016. [DOI] [Google Scholar]
- 32.Shalbaf A, Behnam H, Alizadeh-Sani Z, Shojaifard M. Left ventricle wall motion quantification from echocardiographic images by non-rigid image registration”. Int J Comput Ass Rad. 2012;7(5):769–783. doi: 10.1007/s11548-012-0786-2. [DOI] [PubMed] [Google Scholar]
- 33.Shalbaf A, Behnam H, Alizadeh-Sani Z, Shojaifard M. Automatic classification of left ventricular regional wall motion abnormalities in echocardiography images using nonrigid image registration. J Digit Imaging. 2013;26(5):909–919. doi: 10.1007/s10278-012-9543-x. [DOI] [PMC free article] [PubMed] [Google Scholar]
- 34.Dijkstra W. A note on two problems in connexion with graphs. Numer Math. 1959;1:269–271. doi: 10.1007/BF01386390. [DOI] [Google Scholar]
- 35.Floyd RW. Algorithm 97: shortest path Commun. ACM. 1962;5:345. doi: 10.1145/367766.368168. [DOI] [Google Scholar]
- 36.Borg I, Groenen P. Modern multidimensional scaling: theory and applications. Berlin: Springer; 1997. [Google Scholar]


