

Abstract
Performing diagnoses using virtual slides can take pathologists significantly longer than with glass slides, presenting a significant barrier to the use of virtual slides in routine practice. Given the benefits in pathology workflow efficiency and safety that virtual slides promise, it is important to understand reasons for this difference and identify opportunities for improvement. The effect of display resolution on time to diagnosis with virtual slides has not previously been explored. The aim of this study was to assess the effect of display resolution on time to diagnosis with virtual slides. Nine pathologists participated in a counterbalanced crossover study, viewing axillary lymph node slides on a microscope, a 23-in 2.3-megapixel single-screen display and a three-screen 11-megapixel display consisting of three 27-in displays. Time to diagnosis and time to first target were faster on the microscope than on the single and three-screen displays. There was no significant difference between the microscope and the three-screen display in time to first target, while the time taken on the single-screen display was significantly higher than that on the microscope. The results suggest that a digital pathology workstation with an increased number of pixels may make it easier to identify where cancer is located in the initial slide overview, enabling quick location of diagnostically relevant regions of interest. However, when a comprehensive, detailed search of a slide has to be made, increased resolution may not offer any additional benefit.
Keywords: Pathology, Digital pathology, Virtual slides, Whole slide imaging, Telepathology, Time to diagnosis
Introduction
It can take pathologists significantly longer to perform diagnoses using virtual slides than using glass slides [1, 2]. Given the potential for virtual slides to replace glass slides in future pathology practice, it is important to understand the reasons for this and identify opportunities for improvement. Previously, our team developed a very high resolution (54 megapixel) wall-sized display which allowed diagnoses to be made as fast as with a microscope [3]. For use of virtual slides in routine practice to be feasible, a desktop solution that enables diagnostic readings is required, so we combined three high-resolution desktop publishing-grade 27-in screens to produce an 11-megapixel display, and again, time to diagnosis was similar to the microscope [4]. However, we do not know if efficient performance in these studies was due to the large physical size of the displays or to the increased number of pixels, as both of these factors affect how pathologists perceive the slides.
In radiology, it has been found that image enlargement without improvements in resolution failed to improve performance in detecting abdominal masses in enlarged computed tomography (CT) images [5] and in detecting lung nodules in chest radiographs [6]. In pathology, two studies have compared user experience when reading virtual slides with a range of non-medical and medical-grade monitors [7, 8], but no previous work has systematically investigated the effect of the number of pixels in a display on time to diagnosis. In human-computer interaction research, it has been found that there is a significant effect of display size on performance and navigation, with performance time and amount of navigation by panning and zooming generally decreasing as display size increases [9]. This improved performance is considered to be due to increased physical navigation, such as turning the head, as opposed to the benefits delivered by exploiting peripheral vision to provide context [10]. However, performance varies according to the nature of the task being undertaken; while beneficial for searching for specific objects in an image, too much detail can be distracting for tasks that involve pattern finding [9]. Previously, we conducted an experiment in which participants searched for targets which were either densely distributed (requiring an exhaustive search) or were sparsely distributed [11]. We found that display resolution does not affect the speed at which densely distributed targets are found but results in a significant improvement when searching for sparsely distributed targets in easily identifiable regions of interest (ROIs).
This is the first ever study to systematically assess the effect of display resolution on time to first target and time to diagnosis with virtual slides. This is an important topic at a time when use of virtual slides is increasing [12] and when pathologists are exploring the potential of different hardware solutions such as tablet computers and smartphones for viewing virtual slides [13, 14]. The study sought to determine whether an 11-megapixel three-screen display would lead to quicker diagnostic times than a 2.3-megapixel single-screen display when undertaking a systematic search task.
Materials and Methods
A controlled user experiment was run using a crossover design [15]. Each participant performed three tasks on (i) a conventional microscope, (ii) a single-screen display and (iii) a three-screen display. Three slide sets were used, and the slide set used in each condition was counterbalanced, so that each slide set was viewed an equal number of times in each condition, removing systematic bias caused by any variation in task difficulty. The order of the technology used was also counterbalanced, removing systematic bias caused by practice effects or boredom effects [16].
Both computer interfaces used the same computer workstation, a standard personal computer with two NVIDIA Quadro graphics cards, so that no differences would be introduced by differences in the workstation. The single-screen display comprised a Samsung SyncMaster 2493HM monitor (Samsung, Taipei, Taiwan) with a 23-in diagonal size and resolution of 1,920 × 1,200 pixels (2.3 megapixels). The three-screen display comprised three Dell UltraSharp U2711 desktop publishing-grade monitors (Dell, Round Rock, USA) arranged in portrait (vertical) mode. The monitors were not arranged flat but angled slightly at 145° to each other, with the central monitor facing the user directly (see Fig. 1). Each monitor has a 27-in diagonal size and resolution of 1,440 × 2,560 pixels (i.e. 3.6 megapixels) giving the display a total resolution value of 4,320 × 2,560 pixels (11 megapixels). The monitors in both the single screen and the three-screen display were driven at native resolution.
Fig. 1.
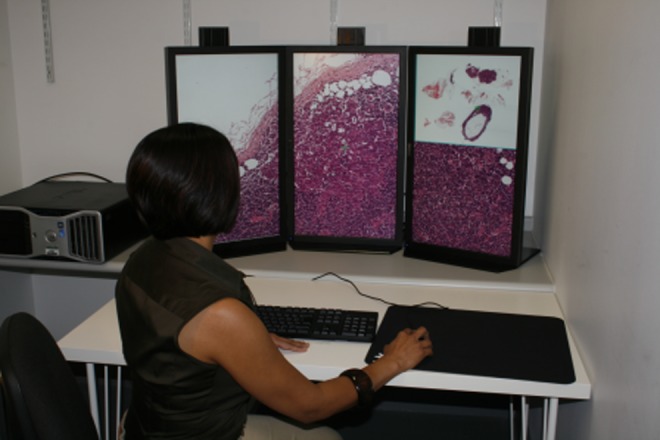
Three-screen display consisting of three 27-in screens
Because the aim of the experiment was to assess the effect of increasing the resolution of the display but not the display size, the displays were positioned so as to provide a similar field of view (see Table 1), with the single-screen display being placed closer to the participant. The three-screen display had in total 4.8 times as many pixels as the single-screen display (i.e. approximately double the resolution in both horizontal and vertical directions). This meant that a single pixel on the three-screen display subtended a similar angular field of view to the smallest object normally detectable by the human eye (approximately 1′ in size), whereas a single pixel on the single-screen display subtended an angle twice as large. The monitors were set up to ensure equal levels of contrast on both display configurations.
Table 1.
Comparison of the system configurations in the three experimental conditions
| Microscope | Single screen | Three screen | |
|---|---|---|---|
| Total width of display (cm) | N/A | 56.5 | 102 |
| Total height of display (cm) | N/A | 38.9 | 62.5 |
| Distance from edge of desk to centre of display (cm) | N/A | 44 | 80 |
| Horizontal field of view (degrees) | 57 | 65 | 65 |
| Vertical field of view (degrees) | 57 | 48 | 43 |
| Width (pixels) | 3,019 | 1,920 | 4,320 |
| Height (pixels) | 3,019 | 1,200 | 2,560 |
| Maximum brightness (cd/m2) | 400 | 350 | |
| Contrast ratio | 1,000:1 | 1,000:1 |
For the microscope, the width and height are the screen resolution that a virtual microscope would need to show the same field and detail of a slide as a conventional microscope
Local Research Ethics Committee approval for this research was obtained (Multicentre Research Ethics Committee 10/H1307/12), and written consent was gained from all participants.
Experimental Task
In each condition, participants were given three cases, where each case consisted of one slide that contained multiple axillary lymph nodes removed during breast cancer surgery. One of the three slides in each slide set had a micrometastasis of carcinoma (see Fig. 2). Participants were asked to view each slide in turn, record on an answer sheet the number of lymph node pieces present and the number of lymph node pieces in which cancer was present and rate their confidence in their diagnosis on a seven-point Likert scale (from 1 to 7, where 1 = not confident at all and 7 = very confident).
Fig. 2.

An area of one of the virtual slides, unannotated (left) and with the micrometastases annotated (right)
All slides were stained with haematoxylin and eosin (H&E). The slides were scanned on an Aperio T3 scanner (Aperio Technologies, San Diego, CA, USA) with a ×40 objective lens and a spatial sampling period of 0.25 μm/pixel. For viewing the virtual slides, the Leeds Virtual Microscope (LVM) software was used [4]. The software enables viewing of virtual slides at magnifications equivalent to the microscope. An overview (‘thumbnail’) of the virtual slide is provided in the top right-hand corner of the screen. The overview occupies the same proportion of the total display area in both the single-screen and the three-screen display. The user interface follows the standard practice of slide-viewing software, allowing the user to pan by clicking in the overview or dragging in the main window and to zoom in and out by rolling the mouse wheel or pressing a keyboard button. For the microscope tasks, a Leica DMRB microscope (Leica Microsystems GmbH, Wetzlar, Germany) with ×2.5, ×5, ×10, ×20 and ×40 objectives was used.
Participants
Nine consultant pathologists participated in the experiment. Of the nine consultant pathologists recruited, three had never used the LVM software, although had experience of using other slide-viewing software. Six participants had experience of using the LVM on the three-screen display, having used it in another experiment, although in that experiment, all navigation was restricted to the overview [4].
Procedure
To familiarise all participants with the LVM, each participant received a short training period on the three-screen display with a training set of two virtual slides, which were not included in the analyses. The software worked in exactly the same way on both displays, but training was undertaken on the three-screen display on the basis that, despite some participants having previously used the three-screen display in another experiment, participants would be less familiar with using a display of this size in comparison with the more standard size single-screen display. This training period lasted a few minutes and consisted of the participants familiarising themselves with the mouse and keyboard controls to navigate and zoom within the first virtual slide, followed by a practice run of the lymph node task to be performed in the study. In previous work, we have found that pathologists were able to learn to use the LVM effectively with minimal training [4]. No further advice or training was provided once the experimental study began.
In each condition (conventional microscope, single-screen display and three-screen display), the time to diagnosis for each task was measured with a stopwatch, from when the glass slide was placed on the stage or from the virtual slide opening to the time when the participant signalled that they had completed the task and began writing their answers. For tasks on the LVM, the software automatically generated a log file to provide data on participants’ interaction with the software. Slides were viewed in all conditions in one session, although participants were offered breaks between sessions. As three slide sets were used, participants viewing a different slide set in each condition, there was no need for a ‘washout period’ between conditions.
Once the participants had completed tasks in the three conditions, they rated on seven-point Likert scales their perceived ease of use of the single-screen and three-screen displays (from 1 to 7, where 1 = very difficult and 7 = very easy) and whether they would be happy to use them in their daily work (from 1 to 7, where 1 = not at all and 7 = definitely).
Analysis
Initial analyses indicated substantial variability in the time taken to make a diagnosis according to the particular slide. To reduce this variability, a normalised time to diagnosis (time to diagnosis expressed as a percentage of the mean time to come to a diagnosis for all trials for that slide) was used. For each participant, their mean normalised time to diagnosis for each combination of technology (microscope, single-screen display and three-screen display) and diagnosis (whether or not the slide was positive for cancer) was calculated.
For slides with cancer present, the time taken from the start of the trial to locate a cancer on the slide (‘time to first target’) was calculated by reviewing the video recordings taken from the microscope camera mount and the trials recorded by the LVM software. Participants were deemed to have identified the cancer if they had either passed over an area of the cancer at a level of magnification where the feature could be assumed to be visible, paused on an area of the cancer or zoomed into an area of the cancer. Time to first target is expressed as a percentage of the time to diagnosis for a given trial.
The mean normalised time to diagnosis, time to first target and diagnostic confidence were analysed by analysis of variance (ANOVA), a standard statistical technique for analysing the results of user evaluations. For time to first target, a one-factor repeated measures ANOVA was undertaken, with technology as a within-participant variable, because only trials where the slide was positive for cancer were included in this analysis. For all other analyses, a two-factor repeated measures ANOVA was undertaken, with technology and whether or not the slide was positive for cancer as within-participant variables. In the results, we report every main effect and every significant interaction. Where there was a significant main effect, post hoc, pair-wise comparisons using the marginal means were performed, and we report all post hoc tests where there was a significant difference. A dependent sample t test was used for analysing participants’ ratings of ease of use and their willingness to use for routine work the single-screen and three-screen displays.
Results
All reported diagnoses were considered to be within the normal variability seen in pathology diagnosis, and therefore, all trials were included in the subsequent analysis.
Confidence in Diagnosis
The pattern of participants’ confidence in their diagnoses is shown in Fig. 3. An ANOVA showed that there was a significant main effect of diagnosis (F(1, 8) = 11.83, p < .01), with participants rating their confidence significantly more highly for slides where there was cancer present. However, the main effect of technology was non-significant (F(2, 16) = 2.14, p > .05).
Fig. 3.

Mean confidence with error bars showing 95 % confidence interval (CI)
Time to Diagnosis
Mean normalised time to diagnosis for each combination of technology and diagnosis is shown in Fig. 4. An ANOVA showed a significant main effect of technology (F(2, 16) = 42.16, p < .001) on time to diagnosis, while the main effect of diagnosis was non-significant (F(1, 8) = 0.00, p > .05). Post hoc, pair-wise comparisons performed using the marginal means showed that participants were significantly faster on the microscope than on either the single-screen or the three-screen display (p < .01), while there was no significant difference between the single-screen and three-screen display (p > .05).
Fig. 4.

Mean normalised time to diagnosis (time to diagnosis expressed as a percentage of the mean time to come to a diagnosis for that slide) with error bars showing 95 % confidence interval (CI)
Similarly, mean normalised time to first target was lowest on the microscope and highest on the single-screen display (see Fig. 5). An ANOVA showed that there was a significant main effect of technology (F(2, 14) = 5.09, p < .05) on time to first target. Post hoc, pair-wise comparisons performed using the marginal means showed that time to first target was significantly faster on the microscope than on the single-screen display (p < .01), although not significantly faster than on the three-screen display (p > .05). However, there was no significant difference between the single-screen and three-screen displays (p > .05).
Fig. 5.

Mean time to first target (where time to first target is expressed as a percentage of the time to diagnosis for a given trial) with error bars showing 95 % confidence interval (CI)
Behavioural Analysis
Looking at the detail of the discrete panning actions (defined as an action where the participant clicked the mouse button, dragged the mouse button and then released the mouse button) showed that the majority of pans on both interfaces were performed in the main screen (83 % on the single-screen display and 82 % on the three-screen display) rather than in the overview. Analysis of the origin of pan movements showed that on the three-screen display, almost no drags were initiated in the right and left-hand screens, whereas pans were more evenly distributed in the single-screen display.
Diagnostic Accuracy
Four diagnostic errors (4 %) were made in the 81 trials, two on the single-screen display and two on the three-screen display. However, as noted above, all were considered to be within the normal variability seen in pathology diagnosis.
Two false-positive diagnoses were made by the same pathologist who interpreted sinusoidal macrophages as metastatic carcinoma. The pathologist made one of these when using the single-screen display and the other when using the three-screen display. Two false-negative diagnoses occurred on the same slide, one with the single-screen display and the other with the three-screen display. On both occasions, the participant correctly diagnosed a 461 × 404-μm micrometastasis in one lymph node, but missed a 311 × 98-μm micrometastasis and adjacent 143 × 134-μm metastasis in another (shown in Fig. 2). The log files and tracks followed by the participants in these trials confirmed that both pathologists properly evaluated the nodes and passed the centre of the viewport over the micrometastases at a zoom level of at least ×20 magnification as well as zooming in on the micrometastases with at least ×40 magnification, but failed to identify the features as being malignant.
User Preference
Six participants (67 %) preferred the three-screen display to the single-screen display, five of whom had used the three-screen display in a previous experiment. However, there was no significant difference in the ratings given for ease of use of the single screen (M = 5.44, SE = .29) and the three-screen display (M = 5.44, SE = .44), t(8) = .00, p > .05, r = 0, or in the ratings given for willingness to regularly use the single screen (M = 4.67, SE = .71) and the three-screen display (M = 4.44, SE = .63), t(8) = .80, p > .05, r = .27 (see Fig. 6).
Fig. 6.

Mean rating with error bars showing 95 % confidence interval (CI)
Discussion
The microscope was faster than the single-screen and three-screen displays, regardless of whether or not cancer was present. This could be due to participants’ increased familiarity with the microscope and the better image fidelity of the glass slide. However, in earlier work using the LVM on the three-screen display, there was no significant difference in the time to diagnosis between the microscope and the LVM [4]. In that study, the LVM software only allowed participants to navigate in the overview. When participants navigate predominantly in the main screen, as in the present study, much larger physical panning movements are needed, increasing the time taken to navigate around the slide.
This is the first ever study to systematically assess the impact of display resolution on time to first target and time to diagnosis with virtual slides. The aim was to compare the single and three-screen displays, with the microscope providing a baseline against which the two interfaces could be compared. There was some evidence that the three-screen display provided benefits over the single-screen display for cases where cancer was present; time to diagnosis and to the first target was both slower with the single-screen display than with the three-screen display, although the differences were not statistically significant.
The predominant models of image perception generally agree that a focal search is preceded by an initial glance that results in a global impression (gist or gestalt) [17], drawing on global information such as spatial layout, texture, colour, image statistics and size [18, 19]. This is supported by studies in pathology which show that eyes are quickly attracted to ROIs when looking at virtual slides [20], and this ability to take in information in the gist view is a feature of expertise [21]. The findings presented here suggest that, for slides where cancer is present, an increased number of pixels makes it easier to identify where the cancer is located in the gist view (at low magnifications), enabling the pathologist to quickly locate diagnostically relevant ROIs.
The three-screen display did not provide benefits over the single-screen display for cases where cancer was absent. This is likely to be because there is no ‘pop-out’ effect, nothing suspicious that attracts attention to direct the search, so that a systematic search has to be undertaken. This fits with research in human-computer interaction which demonstrates variation in performance according to the task being undertaken, with improved display resolution resulting in a significant improvement only when searching for sparse targets in easily identifiable ROIs [11].
As well as being affected by the choice of task, the results are also likely to be affected by the way in which participants interacted with the three-screen display. The failure to take advantage of all three screens may be due to lack of experience with such an interface; while six participants had previously used the three-screen display as part of another experiment, in that experiment, all navigation was restricted to the overview, as described above. It may also be due to the bezels (the frames visible on the face of each monitor); in the previous experiment with the three-screen display [4], it was found that participants were making small adjustments to the position of the virtual slide to ensure that pieces of tissue were not crossing the bezels. More generally, humans have a natural preference to bring objects to the centre of their field of view; this can only be modified by consciously controlling one’s behaviour through metacognition, but that negatively impacts the amount of cognitive resources available for performing the diagnostic task.
In the interviews, and in another experiment using the three-screen display [4], participants expressed a concern that they might miss something on the three-screen display. This is despite the fact that the single-screen display and the three-screen display were positioned so that they had the same horizontal field of view, with the three-screen display having a slightly smaller vertical field of view. This concern may explain the lower confidence ratings given to diagnoses made on the three-screen display. Whether confidence may increase with experience of using such a display is uncertain. However, it was predominantly those participants who had previously used the three-screen display that expressed a preference for it over the single-screen display, suggesting that attitudes towards the three-screen display are affected by experience.
Diagnostic errors were seen in four trials, two on the single-screen display and two on the three-screen display. The small sample size makes it difficult to draw definite conclusions about accuracy, and the study was not intended or designed to assess diagnostic accuracy. The two undercalls could have been interpreted as being caused by ‘satisfaction of search’, where finding a positive lymph node elsewhere on the slide leads the participant to look less hard elsewhere or terminate the search early. However, review of the log files showed that the participants’ tracks passed directly over the micrometastases at medium to high magnification, and one participant zoomed in to very high magnification specifically to examine the micrometastases, indicating that satisfaction of search was not the cause. Alternatively, they could be due to a lack of familiarity with the digital pathology interfaces, leading to suboptimal search performance compared to the microscope (if more effort was spent controlling the interface than performing the diagnostic task). Finally, the errors could be due to reduced image fidelity on the virtual slides. This latter impression is supported by the participants’ tracks and confirmed by re-examination of the glass slides and virtual slides, which revealed that the micrometastases ‘popped out’ at low magnification much more easily on the microscope, and distinguishing them from other possible targets like sinusoidal macrophages was easier. Image fidelity (the closeness of the digital image to the microscope source) can be affected by many factors in digital pathology, but the most important factors are alterations to image quality at acquisition on the scanner (due to image processing or compression) and poor image reproduction on the consumer-grade monitors used.
Limitations and Future Work
The results presented in this paper are based on a small number of participants undertaking a limited number of tasks, precluding any generalisations of the results. The time required to view an axillary lymph node slide (in this study, the mean time to diagnosis was 2 min and 19 s (range 11 s to 6 min and 1 s)) meant that it was not practical to increase the number of cases that each participant viewed. However, the results indicate that this is a topic which warrants further exploration. In addition to undertaking studies with larger numbers of participants, it is important to repeat the experiment with a wider range of tasks to determine if increasing resolution makes other diagnostic tasks more efficient. As described above, the bezels on the three-screen display may have impacted the results. Additionally, even though they were calibrated, there may have been a colour mismatch between the monitors, which could further impact the pathologists’ confidence. At the time of writing, 10-megapixel medical-grade displays are available; as the price for such high-resolution displays reduces, it would be worth repeating the experiment with a 10-megapixel (or similar) single-screen display.
Conclusions
This is the first study to systematically assess the effect of display resolution on time to first target and time to diagnosis with virtual slides. The results suggest that a digital pathology workstation with an increased number of pixels makes it easier to identify where cancer is located in the initial slide overview, enabling quick location of diagnostically relevant regions of interest. However, when a comprehensive, detailed search of a slide has to be carried out, there is less reason to expect a benefit from increased resolution.
Acknowledgments
We are very grateful to the pathologists at Leeds Teaching Hospitals NHS Trust who participated in this experiment. We would also like to thank Mike Hale, Dave Turner and Steve Thoms for their assistance in setting up various aspects of this evaluation and Preetha Chengot for her assistance with the photography. This report is independent research commissioned by the National Institute for Health Research (NIHR) under the New and Emerging Applications of Technology (NEAT) programme. The authors acknowledge the support of the NIHR, through the Comprehensive Clinical Research Network.
Conflict of interest
The views expressed in this publication are those of the authors and not necessarily those of the NHS, the NIHR or the Department of Health.
References
- 1.Li X, et al. A feasibility study of virtual slides in surgical pathology in China. Hum Pathol. 2007;38:1842–1848. doi: 10.1016/j.humpath.2007.04.019. [DOI] [PubMed] [Google Scholar]
- 2.Velez N, Jukic D, Ho J. Evaluation of 2 whole-slide imaging applications in dermatopathology. Hum Pathol. 2008;39:1341–1349. doi: 10.1016/j.humpath.2008.01.006. [DOI] [PubMed] [Google Scholar]
- 3.Treanor D, Jordan-Owers N, Hodrien J, Wood J, Quirke P, Ruddle RA. Virtual reality Powerwall versus conventional microscope for viewing pathology slides: an experimental comparison. Histopathology. 2009;55:294–300. doi: 10.1111/j.1365-2559.2009.03389.x. [DOI] [PubMed] [Google Scholar]
- 4.Randell R, Ruddle RA, Mello-Thoms C, Thomas RG, Quirke P, Treanor D. Virtual reality microscope versus conventional microscope regarding time to diagnosis: an experimental study. Histopathology. 2013;62:351–358. doi: 10.1111/j.1365-2559.2012.04323.x. [DOI] [PubMed] [Google Scholar]
- 5.Gur D, et al. The Effect of Image Display Size on Observer Performance: An Assessment of Variance Components. Acad Radiol. 2006;13:409–413. doi: 10.1016/j.acra.2005.11.033. [DOI] [PubMed] [Google Scholar]
- 6.Bessho Y, Yamaguchi M, Fujita H, Azuma M. Usefulness of Reduced Image Display Size in Softcopy Reading: Evaluation of Lung Nodules in Chest Screening. Acad Radiol. 2009;16:940–946. doi: 10.1016/j.acra.2009.03.006. [DOI] [PubMed] [Google Scholar]
- 7.D’Haene N, et al: Comparison study of five different display modalities for whole slide images in surgical pathology and cytopathology in Europe. Proceedings of SPIE, Florida, USA, 2013. doi:10.1117/12.2001594
- 8.Sharma G, et al: Evaluation of different display modalities for whole slide images in pathology. J Pathol Inform 2: S44–45, 2011
- 9.Ball R, North C, Bowman DA: Move to improve: promoting physical navigation to increase user performance with large displays. Proceedings of the SIGCHI Conference on Human Factors in Computing Systems. ACM, New York, USA, 2007, pp 191–200
- 10.Ball R, North C: The effects of peripheral vision and physical navigation on large scale visualization. Proceedings of Graphics Interface, Canadian Information Processing Society Toronto, Canada, 2008, pp 9–16
- 11.Ruddle RA, et al. E: Performance and interaction behaviour during visual search on large, high-resolution displays. Information Visualization, 2014. doi:10.1177/1473871613500978
- 12.Têtu B, Evans A. Canadian Licensure for the Use of Digital Pathology for Routine Diagnoses. Arch Pathol Lab Med. 2014;138:302–304. doi: 10.5858/arpa.2013-0289-ED. [DOI] [PubMed] [Google Scholar]
- 13.Hamilton PW, Wang Y, McCullough SJ. Virtual microscopy and digital pathology in training and education. APMIS. 2012;120:305–315. doi: 10.1111/j.1600-0463.2011.02869.x. [DOI] [PubMed] [Google Scholar]
- 14.Ramey J, Fung KM, Hassell LA: Use of mobile high-resolution device for remote frozen section evaluation of whole slide images. J Pathol Inform 2, doi:10.4103/2153-3539.84276, 2011 [DOI] [PMC free article] [PubMed]
- 15.Sibbald B, Roberts C. Understanding controlled trials. Crossover trials. BMJ. 1998;316:1719–1720. doi: 10.1136/bmj.316.7146.1719. [DOI] [PMC free article] [PubMed] [Google Scholar]
- 16.Field A. Discovering statistics using SPSS. London: Sage; 2009. [Google Scholar]
- 17.Nodine CF, Kundel HL. The cognitive side of visual search in Radiology. Amsterdam: Elsevier; 1987. [Google Scholar]
- 18.Drew T, Evans K, Võ ML-H, Jacobson FL, Wolfe JM. Informatics in Radiology: What Can You See in a Single Glance and How Might This Guide Visual Search in Medical Images? Radiographics. 2013;33:263–274. doi: 10.1148/rg.331125023. [DOI] [PMC free article] [PubMed] [Google Scholar]
- 19.Wolfe JM, Võ MLH, Evans KK, Greene MR. Visual search in scenes involves selective and nonselective pathways. Trends Cogn Sci. 2011;15:77–84. doi: 10.1016/j.tics.2010.12.001. [DOI] [PMC free article] [PubMed] [Google Scholar]
- 20.Krupinski EA, et al. Eye-movement study and human performance using telepathology virtual slides. Implications for medical education and differences with experience. Hum Pathol. 2006;37:1543–1556. doi: 10.1016/j.humpath.2006.08.024. [DOI] [PubMed] [Google Scholar]
- 21.Krupinski EA, Graham AR, Weinstein RS. Characterizing the development of visual search expertise in pathology residents viewing whole slide images. Hum Pathol. 2013;44:357–364. doi: 10.1016/j.humpath.2012.05.024. [DOI] [PubMed] [Google Scholar]