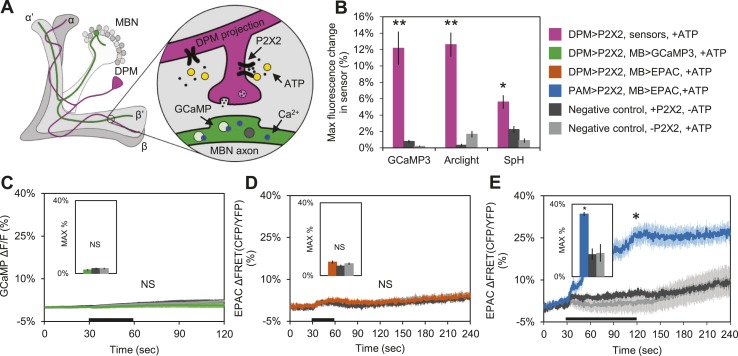
Figure 4. DPM activation has no excitatory effect on the MBs.
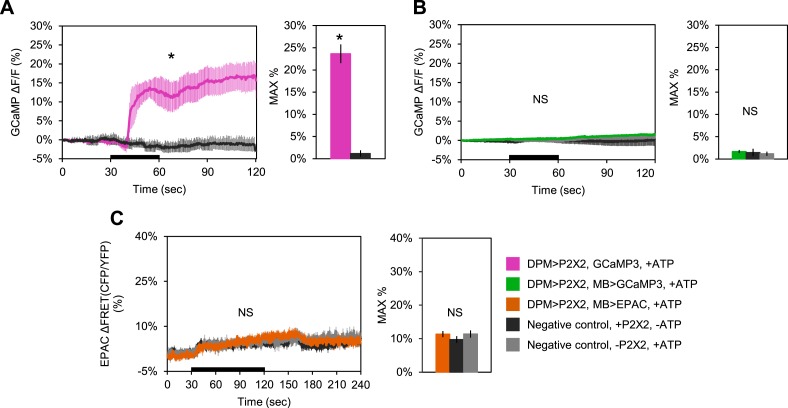
(A) Schematic of genetic set-up for functional imaging experiments. P2X2 receptors were expressed in the DPM neurons, and fluorescent sensors (GCaMP shown) were expressed in the MB neurons. (B) Bath-applied ATP is effective at activating DPMs expressing P2X2 receptors. Mean maximum percentage change in GCaMP3.0 (w-, eyeless-GAL80; UAS-GCaMP3.0/+; c316-GAL4/UAS-P2X2, N = 9 with UAS-P2X2 transgene, 8 without [9, 8], p < 0.001 by Mann–Whitney U test), Arclight (w-, eyeless-GAL80; UAS-Arclight/+; c316-GAL4/UAS-P2X2, N = [11,6], p < 0.001 by Mann–Whitney U test), and Synapto-pHluorin (w-, eyeless-GAL80; UAS-Synapto-pHluorin/+; c316-GAL4/UAS-P2X2, N = [11, 6], p = 0.002 for Mann–Whitney U test) fluorescence in horizontal DPM neuron projections in response to 30 s perfusions of 2.5 mM ATP. (C–E) Black bar denotes time of perfusion of 2.5 mM ATP or vehicle. Insets are histograms summarizing the mean maximum percentage change in fluorescence of the respective sensor. The eyeless-GAL80 and MB247-GAL80 transgenes were used to restrict GAL4 driven expression to DPMs. (C) Mean GCaMP3.0 response traces of w-, eyeless-GAL80; lexAop-GCaMP3.0/MB247-GAL80; c316-GAL4, MB247-lexA/UAS-P2X2 (green), or without the UAS-P2X2 transgene (grey), to 30 s perfusion of 2.5 mM ATP or vehicle (black). N = [10, 8], p > 0.05 for Kruskal–Wallis one-way ANOVA, histogram values are 1.9 + 0.5% (green), 2.6 + 0.5% (black), 2.7 + 0.5% (grey). (D) Mean EPAC response traces of w-, eyeless-GAL80; lexAop-EPAC/MB247-GAL80; c316-GAL4, MB247-lexA/UAS-P2X2 (orange), or without the UAS-P2X2 transgene (grey), to 30 s perfusion of 2.5 mM ATP or vehicle (black). N = [10, 8], p > 0.05 for Kruskal–Wallis one-way ANOVA, histogram values are 7.4 + 0.8% (orange), 5.3 + 0.8% (black), 6.6 + 0.7% (grey). (E) MBs respond to excitatory inputs. Mean EPAC response traces of w-; R58E02-lexA/lexAop-P2X2; MB247-GAL4/UAS-EPAC (blue), or without the lexAop-P2X2 transgene (grey), to 90 s perfusion of 2.5 mM ATP or vehicle (black). N = [9, 5], p < 0.001 for Mann–Whitney U test, histogram values are 34.6 + 3.1% (blue), 12.5 + 1.2% (black), 13.2 + 4.8% (grey). (C–E) Traces represent ROIs taken from horizontal sections of MB lobes. (C–D) ROIs were also taken from the vertical lobes and no change in fluorescence was seen (data not shown).


