

Abstract
Objectives:
In metallurgy, workers are exposed to mixtures of polycyclic aromatic hydrocarbons (PAHs) in which some compounds are carcinogenic. Biomonitoring of PAH exposure has been performed by measuring urinary 1-hydroxypyrene (1-OHP), a metabolite of pyrene which is not carcinogenic. This study investigated the use of 3-hydroxybenzo(a)pyrene (3-OHBaP), a metabolite of benzo(a)pyrene (BaP) which is the main carcinogenic component in PAHs, to improve carcinogen exposure assessment.
Methods:
We included 129 metallurgy workers routinely exposed to PAHs during working hours. Urinary samples were collected at three sampling times at the beginning and at the end of the working week for 1-OHP and 3-OHBaP analyses.
Results:
Workers in anode production showed greater exposure to both biomarkers than those in cathode or silicon production, with respectively, 71, 40, and 30% of 3-OHBaP concentrations exceeding the value of 0.4 nmol mol−1 creatinine. No difference was observed between the 3-OHBaP levels found at the end of the penultimate workday shift and those at the beginning of the last workday shift. Within these plants, the 1-OHP/3-OHBaP ratios varied greatly according to the workers’ activity and emission sources. Using linear regression between these two metabolites, the 1-OHP level corresponding to the guidance value for 3-OHBaP ranged from 0.7 to 2.4 µmol mol−1 creatinine, depending on the industrial sector.
Conclusions:
This study emphasizes the interest of monitoring urinary 3-OHBaP at the end of the last workday shift when working week exposure is relatively steady, and the irrelevance of a single guideline value for 1-OHP when assessing occupational health risk.
Keywords: 1-hydroxypyrene (CAS n°:5315-79-7), 3-hydroxybenzo(a)pyrene (CAS n°: 13345-21-6), biological monitoring, metallurgy, occupational exposure, polycyclic aromatic hydrocarbons (PAHs)
INTRODUCTION
Polycyclic aromatic hydrocarbons (PAHs) are ubiquitous environmental pollutants, which are found in the atmosphere as complex gaseous and particulate mixtures, whose composition varies considerably according to the source of emission (Jongeneelen, 1997). PAHs are emitted during incomplete combustion of organic matter and coal or petroleum distillation. Within this chemical family of >100 compounds, benzo(a)pyrene (BaP) is carcinogenic to humans (group 1) while other particulate PAHs with more than four benzene rings are classified as probably (group 2A) or possibly (group 2B) carcinogenic to humans by the International Agency for Research on Cancer (IARC, 2010). Furthermore, eight particulate PAHs have been classified as assumed human carcinogens by the European Union (2004).
In France, nearly 1.6 million workers were exposed to PAHs in the early 2000s, including 93000 workers in the metallurgy industry, particularly those involved in carbon electrode manufacturing, aluminum smelting, and silicon production (Guignon and Sandret, 2005). In these industries, PAH exposure levels are high due to coal tar pitch used for manufacturing anodes and cathodes and to its combustion during aluminum electrolysis or silicon reduction. Aluminum production has been classified as carcinogenic to humans by IARC (2012) because the Söderberg anodes used over many years for aluminum production were highly polluting and are associated with an increased risk of bladder and lung cancers (Gibbs et al., 2007). Söderberg anodes are currently being replaced by prebaked anodes whose PAH emissions are lower (Carta et al., 2004) and are mainly emitted during anode or cathode manufacturing stages that precede baking. Graphite electrode production has been classified as probably carcinogenic to humans (IARC, 2010), with a standardized mortality ratio for lung cancer reaching 2.62 (1.20–4.98) (Mori, 2002).
Previous studies have shown that airborne BaP levels measured during aluminum electrolysis ranged from 0.7 to 2.8 µg m−3 in electrolysis potrooms (Levin et al., 1995; Lafontaine, 2000), but reached 48 µg m−3 in the vicinity of Söderberg anodes (Tjoe Ny et al., 1993). In carbon electrode production, BaP levels ranged from 0.37 µg m−3 for maintenance activities (Van Delft et al., 1998) to 1.1 µg m−3 for electrode impregnation with pitch liquid or electrode baking (Van Schooten et al., 1995; Angerer et al., 1997). The wide range of individual exposure was explained by the varying composition of electrodes, the nature of the workplace tasks, and the distance to emission sources. In the silicon industry, there is little data on atmospheric BaP levels, but the expected levels are assumed to be lower because prebaked electrodes are used for silicon reduction and most of the workers are not in the vicinity of electrode combustion.
Although exposure sources can easily be identified by measurements of airborne PAHs, biological monitoring has the advantage of taking into account all sources of emission and absorption routes of pollutants, protective equipment efficiency, and individual genetic as well as non-genetic factors. In metallurgy, quantification of the internal dose is the best way for assessing occupational exposure and health risks because of the importance of dermal absorption and wide variability in the wearing of overalls, gloves, and respiratory masks (VanRooij et al., 1993). The determination of urinary metabolites is the most widely used method to measure the internal dose of PAHs (Viau et al., 1995). During the last decades, PAHs biomonitoring has been performed by the determination of 1-hydroxypyrene (1-OHP) in urine collected at the end of the last shift of the workweek. Its use is more suitable for routine monitoring than the determination of DNA adducts, chromosome aberrations, micronuclei or sister chromatid exchange in white blood cells, whose use is limited to research projects (Jongeneelen, 1997; Brandt and Watson, 2003). 1-OHP is the metabolite of pyrene, which is the major particulate PAH in airborne mixtures. The urinary levels are frequently measured as μmol mol−1 of creatinine (µmol mol−1) making the analysis simple and reliable (Lafontaine et al., 2004). Urinary 1-OHP levels vary widely across the different activities in the metallurgy industry. While levels are around 3.6 µmol mol−1 for workers near the aluminum electrolysis smelter (Lafontaine, 2000) and 9.2 µmol mol−1 for those working close to anodes (Petry et al., 1996), they are below 0.5 µmol mol−1 among silicon production workers (Marie-Desvergne et al., 2010). In graphite electrode production, urinary 1-OHP levels decreased from 6.8 µmol mol−1 in 1998 (Van Delft et al., 1998) to 2.9 µmol mol−1 in 2007 (Rossbach et al., 2007).
However, the urinary 1-OHP concentration does not reflect carcinogenic PAH exposure because pyrene itself is not carcinogenic and the ratio BaP/pyrene varies considerably depending on the source of emission (Gendre et al., 2002; Lafontaine et al., 2004). In recent years, the determination of urinary 3-hydroxybenzo(a)pyrene (3-OHBaP), the main monohydroxylated BaP metabolite, has been developed because this biomarker is more closely related to the internal genotoxic entity and therefore to the health risk to workers exposed to PAHs. Indeed, an excellent correlation has been found between the urinary concentration of 3-OHBaP and the amount of benzo(a)pyrene diol-epoxyde–DNA adducts measured in the lung of rats exposed to BaP (Marie et al., 2010). However, 3-OHBaP levels measured in urine are of the order of ng l−1, i.e. three to four orders of magnitude lower than those of 1-OHP (Lafontaine et al., 2004). This is due not only to small amount of airborne BaP, but also to its complex metabolism into many compounds (phenols, diols, triols, quinones, etc.) (Gelboin, 1980) and to their elimination mainly through the feces via biliary excretion (Peltonen and Dipple, 1995). Thus, 3-OHBaP excreted in urine accounts for only 0.21% of the BaP dose according to a study in animals (Marie et al., 2010).
Nevertheless, urinary 3-OHBaP has recently been analyzed in a routine manner using liquid chromatography-fluorescence detection and automated off-line solid phase extraction (Barbeau et al., 2011). Mean end of shift levels of 3-OHBaP were indeed as low as 0.2 nmol mol−1 in coke production workers and 0.5 nmol mol−1 in a graphite electrode production line (Forster et al., 2008).
Moreover, while the 1-OHP excretion peak occurs ~ 3h after the end of the shift, that of 3-OHBaP was detected on average 15h later following a single exposure, with a range of 3–24h postshift among the different occupations studied (Gendre et al., 2002, 2004). For urinary 3-OHBaP analysis, the sampling time currently recommended by the French Institute for Research and Safety is thus at the beginning of the shift the day after occupational exposure.
The aim of this study was to assess carcinogenic PAH exposure using urinary 3-OHBaP analysis among workers exposed to either moderate PAH levels in silicon production or high levels in cathode and anode production. 3-OHBaP levels were compared to those of 1-OHP among workers involved in these different sectors and also between the different activities within each sector to assess the relevance of this new biomarker and to determine a guideline value for 1-OHP. Finally, both metabolites were measured in urine samples collected at the various time points, to confirm the optimal sampling time.
METHODS
Study population
The subjects were 129 healthy male volunteers between 18 and 65 years of age involved in prebaked anode production (n = 35), graphite cathode production (n = 50), and silicon production (n = 44). A questionnaire was completed by each worker in order to inform them about the study and obtain their consent, and to collect detailed data about products, processes, daily activities, personal protective equipment, and smoking habits. No special instruction concerning diet was given.
In anode production, workers were divided into three similar exposure groups (SEGs): (i) ‘Electrode maintenance’, including mechanics and electricians, (ii) ‘Carbon department’, including unloading raw materials (carbon and pitch coke), waste cleaning, control and anode recycling, and (iii) ‘Electrode baking furnace’, including truck drivers, crane operators, firing and degassing ramp operators, and anode rodding and scraping. In cathode production, workers were pooled into four SEGs where the first three groups were similar to those of anode production except for the ‘Carbon department’ which included only electrode extrusion. The fourth group corresponded to ‘Pitch impregnation’ which takes place after cathode baking. In silicon production, four SEGs were formed; the first two groups were involved in furnace repair: (i) ‘Furnace maintenance’, including mechanics working inside it and (ii) ‘Tamping pitch’, including the job of ramming paste in the furnace shaft; the two other groups were involved in silicon production: (iii) ‘Electrode’, including workers located in the upper parts of furnaces close to the electrodes and (iv) ‘Production’, including casting operators located in the lower parts of the furnaces far from the electrodes.
Urine collection
Three urine samples were collected from each worker: the first at the beginning of the first shift of the working week (BSBW), the second at the end of the shift on the last-but-one workday (ESEW) and the third, at the beginning of the last shift of the week (BSEW16). Samples were collected in 50-ml propylene bottles and stored at −20°C until analysis.
Urinary metabolite analyses
After thawing the urine overnight, the 3-OHBaP analysis was conducted using the method previously described by Barbeau et al. (2011). Briefly, a 10ml aliquot of urine was diluted in acetate buffer before enzymatic hydrolysis. The sample was purified and concentrated by automated solid phase extraction using Sep-Pak C18, 500mg with a capacity of 6ml from Waters®. Urinary 3-OHBaP was quantified by high pressure liquid chromatography coupled with fluorescence detection (HPLC-FLD). The heart-cut technique was used, with a first sample separation performed on a purification Supelcosil LC-18 column (50×4mm, 5 µm) from Supelco® and a second separation performed on an analytical column PAH-C18 (250×3mm, 5 µm) from Waters®. Excitation and emission wavelengths were fixed at 425 and 465nm, respectively. The limit of quantification (LQ) was 0.2 pmol l−1 (0.05ng l−1).
Urinary 1-OHP was determined using a modified method of that previously described by Jongeneelen et al. (1988). Briefly, a 2ml aliquot of urine was diluted in acetate buffer before enzymatic hydrolysis and directly injected into a HPLC-FLD system. On-line extraction of 1-OHP was performed with a Supelguard C18 column from Sigma-Aldrich® and elution was performed with a LiChrospher C18 column from Merck®. Excitation and emission wavelengths were fixed at 333 and 390nm, respectively. The LQ was 91.6 pmol l−1 (20ng l−1). The laboratory meets the German Society for Occupational and Environmental Medicine external quality control system standards for 1-OHP.
Urinary creatinine was determined by Jaffe’s method in a 2ml aliquot of urine.
Data analyses
All metabolite concentrations were normalized to urinary creatinine (mol mol−1). Only samples with a creatinine level between 2.7 and 26.5 mmol l−1 (0.3 and 3g l−1) were included in the data analysis. The distributions of urinary concentrations in the different groups are described by median, minimum, maximum, number of workers, and number of samples with a concentration below the LQ. Metabolite concentrations lower than the LQ were assigned values equal to half of the LQ for graphical representation and statistical analyses. Results in different SEGs are shown as box plots, with horizontal lines representing from bottom to top: the minimum, 25th, 50th, 75th percentiles and the maximum. Values outside 1.5 and 3 times the range between the 25th and the 75th percentiles are symbolized as outliers (•) and extreme values (*), respectively. Statistical analyses were conducted with SPSS Statistics® 17.0 software from IBM. For groups whose population was <30, the non-parametric Mann–Whitney or Wilcoxon tests were used to compare the results of independent or matched groups, respectively. For groups exceeding 30 subjects, the common logarithm of each urinary concentration was calculated and the Kolmogorov–Smirnov test was used to ensure that the log-transformed values followed a normal distribution. Student’s t-test was used to compare the results in these independent or matched groups and the linear coefficient of Pearson (r) was used to study the correlation between the two metabolites. For all tests, P values <0.05 were considered significant.
RESULTS
Population
No significant difference in age distribution was found between the different sectors. Respiratory protective equipment (P3 mask) was worn by 100, 92, and 52% of workers involved in anode, silicon, and cathode production, respectively. All workers had handling gloves and standard dungarees. There were more smokers in silicon (50%) and cathode (36%) than in anode production (8%).
Urinary metabolite concentrations among smokers versus non-smokers
3-OHBaP concentrations were below the LQ in only 18 samples mainly collected at BSBW inform silicon production workers. The 1-OHP concentration could be quantified in all 387 urine samples.
No significant difference between smokers and non-smokers was found for 3-OHBaP or 1-OHP for the production of cathodes or anodes, whatever the sampling time. In silicon production, there was also no difference for metabolites measured at BSEW16 and ESEW while smokers had higher levels than non-smokers at BSBW, both for 3-OHBaP (P < 0.001) and 1-OHP (P < 0.01).
Urinary metabolite concentrations in different industrial sectors and activities
The highest median level was found in anode production whatever the metabolite and the sampling time with a maximum reaching 5 nmol mol−1 for 3-OHBaP at BSEW16 and 20 µmol mol−1 for 1-OHP at ESEW (Table 1). The BSEW16 median concentration of 3-OHBaP measured in anode production was 3–4 times higher than in the two other sectors while the ESEW median for 1-OHP was 4 and 10 times higher. The percentage of BSEW16 urine samples with 3-OHBaP levels exceeding the value of 0.4 nmol mol−1 reached 71% for anode production, compared with 40 and 30% in cathode and silicon production, respectively. The exposure levels were highly variable in all three sectors and the largest range of metabolite concentrations was found in anode production (Fig. 1).
Table 1.
Concentrations of urinary 3-OHBaP and 1-OHP at different sampling times for workers involved in anode, cathode, and silicon production
| n (n below the LQ), median (range) | BSBW | ESEW | BSEW16 |
|---|---|---|---|
| Anode | |||
| 3-OHBaP (nmol mol−1) | 35 (0), 0.33 (0.04–1.40) | 35 (1), 0.73 (<LQ-3.97) | 35 (0), 0.74 (0.10–5.05) |
| 1-OHP (µmol mol−1) | 35 (0), 0.80 (0.15–2.97) | 35 (0), 4.01 (0.18–19.54) | 35 (0), 2.47 (0.24–11.06) |
| Cathode | |||
| 3-OHBaP (nmol mol−1) | 50 (1), 0.07 (<LQ-0.92) | 50 (0), 0.25 (0.01–3.02) | 50 (0), 0.28 (0.02–5.27) |
| 1-OHP (µmol mol−1) | 50 (0), 0.23 (0.05–3.78) | 50 (0), 0.96 (0.12–6.99) | 50 (0), 0.56 (0.09–5.91) |
| Silicon | |||
| 3-OHBaP (nmol mol−1) | 44 (14), 0.02 (<LQ-0.18) | 44 (2), 0.15 (<LQ-1.09) | 44 (0), 0.20 (0.03–1.14) |
| 1-OHP (µmol mol−1) | 44 (0), 0.15 (0.01–0.59) | 44 (0), 0.44 (0.10–2.87) | 44 (0), 0.34 (0.06–1.50) |
n, number.
1.

3-OHBaP (nmol mol−1) and 1-OHP (µmol mol−1) urinary concentrations measured in BSBW (white), ESEW (light gray), and BSEW16 (dark gray) urine samples in the different industries.
When results were analyzed according to the different SEGs, there were some discrepancies between the levels of the two urinary metabolites. In the ‘carbon department’ of anode production, the median levels of 3-OHBaP at BSEW16 and 1-OHP at ESEW were, respectively, 2 and 4 times higher than those measured in the ‘electrode baking furnace’. In contrast, the 3-OHBaP median was also 2 times higher than those from ‘electrode maintenance’ whereas the 1-OHP median was similar. Furthermore, there was a large range of 1-OHP concentrations in this last group (Fig. 2). In the ‘carbon department’ of cathode production, the median levels of 3-OHBaP at BSEW16 and 1-OHP at ESEW were, respectively, 7 and 2.5 times higher than those measured in the ‘electrode baking furnace’, and 2.5 and 1.5 higher than in the ‘electrode maintenance’ groups. In contrast, the 3-OHBaP median was 2 times higher than those from ‘pitch coke impregnation’ whereas the 1-OHP median was 1.5 times lower (Fig. 3). In silicon production, the 3-OHBaP levels at BSEW16 from the ‘furnace maintenance’ group were 2 times higher than those measured in the ‘tamping pitch’ and ‘electrode’ groups, and 6 times higher than in the ‘production’. However, the 1-OHP median in at ESEW from ‘furnace maintenance’ is 4.5 and 2 times lower than those from ‘tamping pitch’ and ‘electrode’ groups, respectively, but comparable to those from ‘production’ (Fig. 4). The range of the two metabolites was narrower in production than in the other groups, and was especially wide for 1-OHP levels in the ‘electrode’ group.
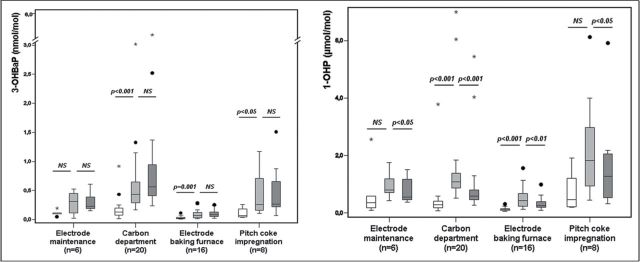
2.

3-OHBaP (nmol mol−1) and 1-OHP (µmol mol−1) urinary concentrations measured in BSBW (white), ESEW (light gray), and BSEW16 (dark gray) urine samples in the different SEGs of anode production. Number of workers (n) and statistical significance of differences between metabolite concentrations from two sample times (P) are shown (NS: non-significant).
3.
3-OHBaP (nmol mol−1) and 1-OHP (µmol mol−1) urinary concentrations measured in BSBW (white), ESEW (light gray), and BSEW16 (dark gray) urine samples in the different SEGs of cathode production. Number of workers (n) and statistical significance of differences between metabolite concentrations from two sample times (P) are shown (NS: non-significant).
4.

3-OHBaP (nmol mol−1) and 1-OHP (µmol mol−1) urinary concentrations measured in BSBW (white), ESEW (light gray), and BSEW16 (dark gray) urine samples in the different SEGs of silicon production. Number of workers (n) and statistical significance of differences between metabolite concentrations from two sample times (P) are shown (NS: non-significant).
Evolution of metabolite concentrations during the working week
The 3-OHBaP levels measured in BSEW16 and ESEW urine samples were significantly higher than those at BSBW for all three sectors (P < 0.001). The 3-OHBaP concentrations from BSEW16 samples were significantly higher than those at ESEW in cathode production (P < 0.01), but similar in anode and silicon production (P > 0.05). When results were analyzed according to the different SEGs, the 3-OHBaP concentrations were similar at BSEW16 and ESEW, except for two groups, ‘electrode baking furnace’ in anode production (P < 0.05) and ‘furnace maintenance’ in silicon production (P < 0.01), for which 67 and 83% of 3-OHBaP concentrations in BSEW16 were higher than those in ESEW, respectively.
Median 1-OHP values measured at ESEW was significantly higher than those at BSBW and BSEW16 for the three sectors (P < 0.05). Only 10% workers involved in cathode production and ~24% workers in silicon and anode production had higher 1-OHP levels at BSEW16 than at ESEW. When results were analyzed according to the different SEGs, the 1-OHP medians measured at ESEW were also higher than those at BSEW16 in all groups except for the ‘electrode baking furnace’ in anode production and ‘furnace maintenance’ in silicon production. Indeed, 42 and 50% workers, respectively, of these two groups had higher 1-OHP levels at BSEW16 than at ESEW, while the percentage was much lower for all other activities, ranging from 0 to 22%.
1-OHP/3-OHBaP concentration ratios
Medians of the ratios of 1-OHP concentration at ESEW to those of 3-OHBaP at BSEW16 (1-OHPESEW/3-OHBaPBSEW16), varied by a factor of 3–6 within the same sector, and ranged by a factor of 4–35 within a SEG. The lowest median ratio was found for ‘furnace maintenance’ in silicon production (median = 1094) and the highest for ‘electrode maintenance’ in anode production (median = 11224).
Urinary metabolite correlations
A strong correlation between levels of 3-OHBaP at BSEW16 and 1-OHP at ESEW was observed for cathode production (r = 0.747; P < 0.001, n = 50), whereas low to moderate correlations were observed for anode (r = 0.482; P < 0.01, n = 35) and silicon production (r = 0.380; P < 0.05, n = 44). The same results were found when the two metabolites were measured at BSEW16, but the correlation was better when the two metabolites were measured at ESEW for anode (r = 0.843; P < 0.001, n = 35), cathode (r = 0.787; P < 0.001, n = 50), and silicon production (r = 0.780; P < 0.001, n = 44) (Fig. 5).
5.

Correlations between logarithmic values of 1-OHP and 3-OHBaP uncorrected concentrations measured in the same ESEW urine sample from workers involved in anode, cathode, and silicon production. Correlation coefficient (r), statistical significance (P), and number of workers (n) are shown.
The 1-OHP concentration in ESEW urine samples, corresponding to the guideline value of 0.4 nmol mol−1 for 3-OHBaP at BSEW16, was calculated from the equations of the regression lines between these two metabolites for each sector. This value was equal to 0.7 [confidence interval (CI) = 0.5–0.9] and 1.1 (CI = 0.9–1.3) µmol mol−1 for silicon and cathode production, respectively, but reached 2.4 µmol mol−1 in anode production with a large CI (1.6–3.5).
DISCUSSION
The 1-OHP levels found in silicon production were low (median = 0.4 µmol mol−1) and comparable to those previously reported in this sector (Marie et al., 2009). In contrast, 1-OHP levels in anode production (median = 4 µmol mol−1) were 4 and 10 times higher than those in cathode and silicon production, respectively. These high values are close to those previously reported in anode production (Alexandrie et al., 2000). The highest median of 1-OHP, close to 6.5 µmol mol−1, was found in ‘electrode maintenance’ and the ‘carbon department’ of anode production, in agreement with previous data (Bentsen-Farmen et al., 1999). For the ‘carbon department’ in cathode production, the 1-OHP levels were six times lower, as recently reported (Forster et al., 2008). While on one hand, Bentsen et al. (1998) showed that electrode paste plant workers wearing P3 masks had lower urinary 1-OHP concentrations than others; on the other hand, they emphasized the significance of variability in levels due to skin uptake of pyrene depending on work category. In our study, the difference of 1-OHP levels between the sectors cannot be explained by the efficiency of individual protective equipment because 100% of the employees involved in anode production wore a P3 respiratory mask while only 30% workers in the ‘carbon department’ in cathode production wore one. Furthermore, skin is not the main route of absorption, as shown by the 1-OHP levels at BSEW16 which were much lower than those found at ESEW for these three groups. Indeed, Lafontaine et al. (2002) showed a slower decrease in cases of dermal absorption. Basically, the high exposure levels measured in the ‘carbon department’ of anode production can be explained by inhalation of the aerosol of airborne PAHs emitted from carbon paste rather than skin absorption. In this department, workers carry out operations known to be highly polluting, such as unloading raw materials, waste cleaning, and anode recycling. In contrast, employees of the ‘carbon department’ in cathode production are only involved in electrode extrusion activities, where they are less exposed. These results highlight the difficulty to prevent PAH exposure using personal protective equipment alone, and reiterate the need for accurate assessment of the way in which tasks are performed by workers.
Only 3% of 3-OHBaP concentrations measured in ESEW samples and 12% in BSBW were below the LQ including >80% non-smokers and >80% silicon workers. Using the same analytical method in a group of non-occupationally exposed controls, 92% of urinary 3-OHBaP were detectable for smokers whereas this percentage decreased to 20% for non-smokers (Barbeau et al., 2011). This finding confirmed that the analytical method is quite appropriated to perform biological monitoring for high occupational PAH levels, but that the sensitivity needs to be improved to evaluate low occupational or environmental exposure. The median of 3-OHBaP concentrations measured at BSBW in cathode and anode production were 3 and 14 times higher than those of non-occupationally exposed smokers while the 1-OHP median was 2 and 6 times higher (Lafontaine et al., 2006; Barbeau et al., 2011). Proportionally higher levels of 3-OHBaP than 1-OHP, were due to the higher proportion of BaP emitted by electrode production than by tobacco smoke. Within these two sectors, the impact of smoking habits is negligible whatever the sampling time, as well as in silicon production for samples collected at ESEW and ESEW16. Indeed, occupational exposure to PAHs is high and hides the effect of tobacco consumption. This was consistent with a measurable impact of smoking on levels of metabolites, only demonstrated in the case of low occupational exposure (Buratti et al., 2007). In contrast, urinary levels of both metabolites measured at BSBW were higher in smokers than in non-smoker workers in silicon production. This is due to the total elimination during the weekend of the PAHs accumulated throughout the working week. In the other two industries, the amounts of PAHs accumulated for the workweek could be too high to be totally eliminated during the weekend. If not, an important non-occupational exposure over the weekend providing from alimentation or fireplace could also explain these differences. This finding confirms the importance to collect urinary samples at BSBW to know the background levels of workers, in order to properly evaluate the workweek exposure.
The specific composition of the emission sources result in differences between 3-OHBaP and 1-OHP levels expected between the SEGs. Box plots show the same ESEW medians of 1-OHP for ‘electrode maintenance’ and ‘carbon department’, while the BSEW16 median of 3-OHBaP was twice as low for the first group, resulting from a higher proportion of pyrene (Fig. 2). In contrast, BaP proportion was higher in the ‘carbon department’ of cathode production, thus the BSEW16 median for 3-OHBaP in this group was twice as high as in ‘pitch coke impregnation’ while the median for 1-OHP at ESEW was lower (Fig. 3). This hypothesis is supported by the levels of atmospheric PAHs reported in an electrode paste plant (Bentsen et al., 1998). Indeed, the highest ratio of pyrene/BaP concentrations reaches a value of 8 for ‘mixing’ activity close to that of the group ‘electrode maintenance’, while it is equal to 3.1 for the activity ‘mould filing’ which is similar to the group ‘carbon department’ in the cathodes industry. Finally, BaP proportion was even higher for the group ‘furnace maintenance’ in silicon production, with the highest median of 3-OHBaP at BSEW16 than in all others in this sector, while the ESEW medians for 1-OHP were always lower or similar (Fig. 4). The highly variable 1-OHPESEW/3-OHBaPBSEW16 ratios within a single industrial sector was also observed for pyrene/BaP concentrations (Bentsen et al., 1998) and confirm the great variability in the emission sources in the workplaces. Moreover, the high dispersion of the individual values within the SEGs reveals an interindividual variability, probably from individual exposure conditions.
The range of 1-OHP/3-OHBaP ratios were not so wide when calculated from the concentrations of the two metabolites measured in the same sample. This contradicts the data published by Gendre et al. who reported the necessity to take into account the 16-h delay in the 3-OHBaP elimination rate compared to that of 1-OHP (Gendre et al., 2002, 2004), due to BaP retention by the kidneys (Marie et al., 2010). However, this toxicokinetic data was obtained after a single exposure of subjects whereas the workers involved in our study were exposed for four or five consecutive days. Cumulative exposure during the working week probably created an equilibrium between the absorbed BaP and eliminated 3-OHBaP, due to its urinary half-life of around 8h after reaching a maximum 16h after the end of exposure (Bouchard and Viau, 1996; Lafontaine et al., 2004). If, for the first workday, the urinary concentration measured 16h after the end of the shift was higher than at the end of the shift, the difference would probably decrease after several consecutive days of relatively stable exposure, reaching comparable levels at sampling times 16h apart. Indeed, in the two groups where the 3-OHBaP levels at BSEW16 were higher than at ESEW (‘electrode baking furnace’ of anode production and ‘furnace maintenance’ of silicon production), PAH exposure was very low during the working week as indicated by the small difference in 3-OHBaP between BSBW and ESEW samples. Furthermore, skin absorption seemed to be important in these groups as shown by 1-OHP levels which did not decline between ESEW and BSEW16. This dermal absorption could lead to a greater delay in urinary excretion of 3-OHBaP.
The best correlation between 3-OHBaP and 1-OHP levels was found when the two metabolites were analyzed on the same sample collected at ESEW and this correlation was very close to those previously published (Forster et al., 2008). For all three industrial sectors, the strength of the link between the two metabolites measured in the same ESEW sample after several consecutive days of exposure was as strong as that obtained by Gendre et al. (2002) between the maximum urinary concentration of 3-OHBaP and that of the 1-OHP sample after 1-day exposure.
Our results provide evidence that biological monitoring of PAH exposure could be performed by measuring 3-OHBaP concentrations in urine samples collected at the end of the shift on the last day of the working week in the case of similar exposure levels throughout the week. For monitoring in an industrial context, this sampling time would be more convenient than collecting urine samples 16h after the end of the shift. In contrast, the best sampling time for monitoring short exposure, such as 1-day exposure, remains the following morning.
The level of 0.4 nmol mol−1 has been proposed for 3-OHBaP as a recommended value by Lafontaine et al. (2004). This value has been estimated from the threshold limit value (time-weighted average) of BaP but has not been based on any health effects. The value of 1-OHP calculated from this urinary level of 3-OHBaP ranged from 0.7 to 2.4 µmol mol−1 depending on the sector. This variability was due to the different proportions of BaP and pyrene in PAHs mixtures as demonstrated by the 1-OHPESEW/3-OHBaPBSEW16 ratios. A similar result has already been observed and several 1-OHP biological exposure indexes suggested for coke, aluminum, or graphite electrode plants (Jongeneelen, 2001). Bouchard et al. proposed an approach whereby the guideline value was adjusted according to the proportion of airborne BaP within other industrial sectors (Bouchard and Viau, 1999). The calculated value ranged from 1.1 µmol mol−1 for coke plants to 9.8 µmol mol−1 for prebaked aluminum plants. However, this method requires systematic air sampling and the proportion of BaP is assumed to be constant throughout the plant. Our study shows that the guideline value for 1-OHP can widely vary within the same sector when there are several emission sources, with a CI which ranged from 1.6 to 3.5 µmol mol−1 in anode production. Finally, while the recommended guideline value for 3-OHBaP was 20 times higher than the levels found among non-occupationally exposed smokers (Barbeau et al., 2011), the calculated guideline value for 1-OHP was only five and eight times higher in silicon and cathode production, respectively. These results show that it is not possible to have a single guideline value for 1-OHP and that this value may be close to the levels found among non-occupationally exposed people in several industrial sectors.
To summarize, our study confirms that urinary 3-OHBaP is an essential marker of exposure to carcinogenic PAHs and that its analysis does not necessarily require supplementary urine samples to be collected, rendering this new biomarker easier to use in the context of monitoring occupational exposure.
FUNDING
‘Agence nationale de sécurité sanitaire de l’environnement, de l’alimentation et du travail’ (ANSES) .
ACKNOWLEDGMENTS
We thank Dr Bruno Buclez and Dr Philippe Thoumelin for allowing us to perform this work, and Dr Alison Foote for editing the manuscript. There are no conflicts of interest for any of the authors.
REFERENCES
- Alexandrie AK, Warholm M, Carstensen U, et al. (2000). CYP1A1 and GSTM1 polymorphisms affect urinary 1-hydroxypyrene levels after PAH exposure. Carcinogenesis; 21: 669–76. [DOI] [PubMed] [Google Scholar]
- Angerer J, Mannschreck C, Gündel J. (1997). Occupational exposure to polycyclic aromatic hydrocarbons in a graphite-electrode producing plant: biological monitoring of 1-hydroxypyrene and monohydroxylated metabolites of phenanthrene. Int Arch Occup Environ Health; 69: 323–31. [DOI] [PubMed] [Google Scholar]
- Barbeau D, Maître A, Marques M. (2011). Highly sensitive routine method for urinary 3-hydroxybenzo[a]pyrene quantitation using liquid chromatography-fluorescence detection and automated off-line solid phase extraction. Analyst; 136: 1183–91. [DOI] [PubMed] [Google Scholar]
- Bentsen-Farmen RK, Botnen IV, Notø H, et al. (1999). Detection of polycyclic aromatic hydrocarbon metabolites by high-pressure liquid chromatography after purification on immunoaffinity columns in urine from occupationally exposed workers. Int Arch Occup Environ Health; 72: 161–8. [DOI] [PubMed] [Google Scholar]
- Bentsen RK, Notø H, Halgard K, et al. (1998). The effect of dust-protective respirator mask and the relevance of work category on urinary 1-hydroxypyrene concentration in PAH exposed electrode paste plant workers. Ann Occup Hyg; 42: 135–44. [DOI] [PubMed] [Google Scholar]
- Bouchard M, Viau C. (1996). Urinary excretion kinetics of pyrene and benzo(a)pyrene metabolites following intravenous administration of the parent compounds or the metabolites. Toxicol Appl Pharmacol; 139: 301–9. [DOI] [PubMed] [Google Scholar]
- Bouchard M, Viau C. (1999). Urinary 1-hydroxypyrene as a biomarker of exposure to polycyclic aromatic hydrocarbons: biological monitoring strategies and methodology for determining biological exposure indices for various work environments. Biomarkers; 4: 159–87. [DOI] [PubMed] [Google Scholar]
- Brandt HC, Watson WP. (2003). Monitoring human occupational and environmental exposures to polycyclic aromatic compounds. Ann Occup Hyg; 47: 349–78. [DOI] [PubMed] [Google Scholar]
- Buratti M, Campo L, Fustinoni S, et al. (2007). Urinary hydroxylated metabolites of polycyclic aromatic hydrocarbons as biomarkers of exposure in asphalt workers. Biomarkers; 12: 221–39. [DOI] [PubMed] [Google Scholar]
- Carta P, Aru G, Cadeddu C, et al. (2004). Mortality for pancreatic cancer among aluminium smelter workers in Sardinia, Italy. G Ital Med Lav Ergon; 26: 83–9. [PubMed] [Google Scholar]
- European Union. (2004). L152/1. Commission Directive 2004/73/EC of 29 April 2004 adapting to technical progress for the twenty-ninth time Council Directive 67/548/EEC on the approximation of the laws, regulations and administrative provisions relating to the classification, packaging and labelling of dangerous substances. Official journal of the European Union. [Google Scholar]
- Förster K, Preuss R, Rossbach B, et al. (2008). 3-Hydroxybenzo[a]pyrene in the urine of workers with occupational exposure to polycyclic aromatic hydrocarbons in different industries. Occup Environ Med; 65: 224–9. [DOI] [PubMed] [Google Scholar]
- Gelboin HV. (1980). Benzo[alpha]pyrene metabolism, activation and carcinogenesis: role and regulation of mixed-function oxidases and related enzymes. Physiol Rev; 60: 1107–66. [DOI] [PubMed] [Google Scholar]
- Gendre C, Lafontaine M, Delsaut P, et al. (2004). Exposure to polycyclic aromatic hydrocarbons and excretion of urinary 3-hydroxybenzo[a]pyrene: assessment of an appropriate sampling time. Polycyclic Aromatic Compounds; 24: 433–9. [Google Scholar]
- Gendre C, Lafontaine M, Morele Y, et al. (2002). Relationship between urinary levels of 1-hydroxypyrene and 3-hydroxybenzo[a]pyrene for workers exposed to polycyclic aromatic hydrocarbons. Polycyclic Aromatic Compounds; 22: 761–9. [Google Scholar]
- Gibbs GW, Armstrong B, Sevigny M. (2007). Mortality and cancer experience of Quebec aluminum reduction plant workers. Part 2: mortality of three cohorts hired on or before january 1, 1951. J Occup Environ Med; 49: 1105–23. [DOI] [PubMed] [Google Scholar]
- Guignon N, Sandret N. (2005). Les expositions aux produits cancérogènes, mutagènes et reprotoxiques. Documents pour le médecin du travail 2005. Available at http://www.inrs.fr/accueil/produits/mediatheque/doc/publications.html?refINRS=TF%20144.
- IARC. (2010). Some non-heterocyclic polycyclic aromatic hydrocarbons and some related exposures. In WHO. Monographs on the evaluation of carcinogenic risks to humans. Lyon, France: IARC. [PMC free article] [PubMed] [Google Scholar]
- IARC. (2012). Chemical agents and related occupations: a review of human carcinogens. In WHO. Monographs on the evaluation of carcinogenic risks to humans. Lyon, France: IARC. [PMC free article] [PubMed] [Google Scholar]
- Jongeneelen FJ. (1997). Methods for routine biological monitoring of carcinogenic PAH-mixtures. Sci Total Environ; 199: 141–9. [DOI] [PubMed] [Google Scholar]
- Jongeneelen FJ. (2001). Benchmark guideline for urinary 1-hydroxypyrene as biomarker of occupational exposure to polycyclic aromatic hydrocarbons. Ann Occup Hyg; 45: 3–13. [PubMed] [Google Scholar]
- Jongeneelen FJ, Anzion RB, Scheepers PT, et al. (1988). 1-Hydroxypyrene in urine as a biological indicator of exposure to polycyclic aromatic hydrocarbons in several work environments. Ann Occup Hyg; 32: 35–43. [DOI] [PubMed] [Google Scholar]
- Lafontaine M. (2000). Recherche de métabolites urinaires chez les ouvriers exposés aux HAP. La ligne prévention.
- Lafontaine M, Champmartin C, Simon P, et al. (2006). 3-Hydroxybenzo[a]pyrene in the urine of smokers and non-smokers. Toxicol Lett; 162: 181–5. [DOI] [PubMed] [Google Scholar]
- Lafontaine M, Gendre C, Delsaut P, et al. (2004). Urinary 3-hydroxybenzo[a]pyrene as a biomarker of exposure to polycyclic aromatic hydrocarbons: an approach for determining a biological limit value. Polycyclic Aromatic Compounds; 24: 441–50. [Google Scholar]
- Lafontaine M, Gendre C, Morele Y, et al. (2002). Excretion of urinary 1-hydroxypyrene in relation to the penetration routes of polycyclic aromatic hydrocarbons. Polycyclic Aromatic Compounds; 22: 579–88. [Google Scholar]
- Levin JO, Rhén M, Sikström E. (1995). Occupational PAH exposure: urinary 1-hydroxypyrene levels of coke oven workers, aluminium smelter pot-room workers, road pavers, and occupationally non-exposed persons in Sweden. Sci Total Environ; 163: 169–77. [DOI] [PubMed] [Google Scholar]
- Marie-Desvergne C, Maître A, Bouchard M, et al. (2010). Evaluation of DNA adducts, DNA and RNA oxidative lesions, and 3-hydroxybenzo(a)pyrene as biomarkers of DNA damage in lung following intravenous injection of the parent compound in rats. Chem Res Toxicol; 23: 1207–14. [DOI] [PubMed] [Google Scholar]
- Marie C, Bouchard M, Heredia-Ortiz R, et al. (2010). A toxicokinetic study to elucidate 3-hydroxybenzo(a)pyrene atypical urinary excretion profile following intravenous injection of benzo(a)pyrene in rats. J Appl Toxicol; 30: 402–10. [DOI] [PubMed] [Google Scholar]
- Marie C, Ravanat JL, Badouard C, et al. (2009). Urinary levels of oxidative DNA and RNA damage among workers exposed to polycyclic aromatic hydrocarbons in silicon production: comparison with 1-hydroxypyrene. Environ Mol Mutagen; 50: 88–95. [DOI] [PubMed] [Google Scholar]
- Mori I. (2002). Cancer mortality among man-made graphite electrode manufacturing workers: results of a 38 year follow up. Occup Environ Med; 59: 473–80. [DOI] [PMC free article] [PubMed] [Google Scholar]
- Peltonen K, Dipple A. (1995). Polycyclic aromatic hydrocarbons: chemistry of DNA adduct formation. J Occup Environ Med; 37: 52–8. [DOI] [PubMed] [Google Scholar]
- Petry T, Schmid P, Schlatter C. (1996). Airborne exposure to polycyclic aromatic hydrocarbons (PAHs) and urinary excretion of 1-hydroxypyrene of carbon anode plant workers. Ann Occup Hyg; 40: 345–57. [DOI] [PubMed] [Google Scholar]
- Rossbach B, Preuss R, Letzel S, et al. (2007). Biological monitoring of occupational exposure to polycyclic aromatic hydrocarbons (PAH) by determination of monohydroxylated metabolites of phenanthrene and pyrene in urine. Int Arch Occup Environ Health; 81: 221–9. [DOI] [PubMed] [Google Scholar]
- Tjoe Ny E, Heederik D, Kromhout H, et al. (1993). The relationship between polycyclic aromatic hydrocarbons in air and in urine of workers in a Söderberg potroom. Am Ind Hyg Assoc J; 54: 277–84. [DOI] [PubMed] [Google Scholar]
- van Delft JH, Steenwinkel MJ, van Asten JG, et al. (1998). Monitoring of occupational exposure to polycyclic aromatic hydrocarbons in a carbon-electrode manufacturing plant. Ann Occup Hyg; 42: 105–14. [DOI] [PubMed] [Google Scholar]
- VanRooij JG, Bodelier-Bade MM, Jongeneelen FJ. (1993). Estimation of individual dermal and respiratory uptake of polycyclic aromatic hydrocarbons in 12 coke oven workers. Br J Ind Med; 50: 623–32. [DOI] [PMC free article] [PubMed] [Google Scholar]
- van Schooten FJ, Jongeneelen FJ, Hillebrand MJ, et al. (1995). Polycyclic aromatic hydrocarbon-DNA adducts in white blood cell DNA and 1-hydroxypyrene in the urine from aluminum workers: relation with job category and synergistic effect of smoking. Cancer Epidemiol Biomarkers Prev; 4: 69–77. [PubMed] [Google Scholar]
- Viau C, Vyskocil A, Bouchard M, et al. (1995). La surveillance biologique de l’exposition aux hydrocarbures aromatiques polycycliques. Travail et santé; 11: S-7. [Google Scholar]