



Abstract
Background
This study identifies the percentage of opioids prescribed for compensated workplace conditions in Manitoba, Canada and whether Workers Compensation Board (WCB) status is associated with higher prescription opioid doses.
Methods
Opioid prescriptions for WCB recipients were linked with databases housed at the Manitoba Center for Health Policy. Duration of continuous opioid prescription and morphine equivalents (ME) per day (ME/D) were calculated for individuals age 18–65.
Results
Over the period from 1998 to 2010, 3.8% of the total opioid dosage of medication prescribed in the study population were prescribed to WCB recipients. WCB recipients accounted for 2.1% of the individuals prescribed opioids. In adjusted analyses WCB recipients were more likely to be prescribed over 120 ME/D (OR 2.06 95% CI, 1.58–2.69).
Conclusions
WCB recipients account for a small, but significant amount of the total opioid prescribed in Manitoba. Manitoba's WCB population is a group at increased risk of being prescribed over 120 ME/day. Am. J. Ind. Med. 58:33–39, 2015. © 2014 The Authors. American Journal of Industrial Medicine Published by Wiley Periodicals, Inc.
Keywords: workers compensation, opioids, epidemiology, Canada, duration of use
INTRODUCTION
The use of prescription opioid medications has increased markedly over the past number of years in both the United States and Canada [Koryrskyj et al., 2009; The Board of Regents of the University of Wisconsin System, 2013]. Opioid medications are commonly used amongst Workers Compensation Board (WCB) claimants following workplace injuries [Franklin et al., 2005; Gross et al., 2009]. Opioid dosage has been shown to escalate as WCB claims mature [Tao et al., 2012b]. High doses of opioid medications amongst WCB populations have been associated with adverse outcomes, such as claims cost of >$100,000 [Tao et al., 2012a; White et al., 2012], and excess deaths [Franklin et al., 2005]. WCB data have shown an almost 10 fold difference (5.7%–52.9%) in the early prescription of opioid medications between various US states, suggesting that local prescribing patterns have significant influence on the use of these types of medications [Webster et al., 2009]. Although opioid medications can control pain, some clinicians and investigators have questioned the benefits of continued and escalating use of these medications in WCB recipients [Franklin et al., 2005; Webster et al., 2007; Franklin et al., 2008; Volinn et al., 2009]. Studies looking at opioid use amongst WCB populations have not been able to compare use amongst this group to a population based working age comparison.
The objectives of this research were to determine what proportion of opioid use for non-cancer pain in the general population is covered by the workers compensation system and to identify if WCB status is associated with being prescribed higher doses of opioids.
MATERIALS AND METHODS
Setting
Manitoba, Canada (pop. ∼1,200,000) is a province with a diverse economy with manufacturing, agriculture, mining, forestry, construction, sales and service, being prominent contributors [Government of Manitoba, 2013a]. The largest city is the capital, Winnipeg (pop. ∼700,000). The WCB of Manitoba provides wage replacement, and covers medical and prescription costs for its insured population, which includes approximately 70% of the workforce [Government of Manitoba, 2013b]. Injured workers are managed under the general medical system by the worker's regular physicians and consultants, if required, and not by a special list of WCB sanctioned physicians.
In addition to WCB claim data, we used administrative data collected by the Manitoba Health, housed in de-identified form at the Manitoba Centre for Health Policy (MCHP). The government-funded health care system covers nearly all provincial residents. The administrative data contain comprehensive health-related information, out-patient prescription pharmacy data since April 1, 1997, and have been linked to other data including census-based socioeconomic information, and vital status. MCHP data have been used and validated extensively to study a wide range of issues [Roos et al., 2005; Koryrskyj et al., 2009; Roos et al., 2010].
Participants
We identified a list of opioid medications paid by the WCB, including codeine ≥ 15 mg/tablet, meperidine, morphine, oxycodone, hydromorphone, tramadol, methadone, and fentanyl. A list of all new claims from April 1, 1997 to March 31, 2011 in which the WCB paid for at least one prescription of the above drugs, short or long acting, (25,854 claims) was linked, 98.9% successfully, in an anonymized manner to the MCHP database by the provincial health department. The small number of unlinked claims is consistent with the approximately 1% of the WCBs claims that are for out of province residents who are not covered by the provincial health care plan. All prescriptions from April 1, 1997 to March 31, 2012 for individuals age 18–65 (n = 619.972) for similar opioid medications in the MCHP database were identified. The WCB and MCHP lists of prescriptions were matched based on unique personal identifier, date of prescription, drug identification number, and dose prescribed. Prescriptions were eliminated if they did not list the number of pills or dose, or were outliers unless the corresponding prescription in the other dataset gave useable data. Intravenous, buccal and rectal formulations of the opioid medications were excluded as they are rarely used for the management of chronic pain in Manitoba's WCB population. Liquids were also excluded, as there was inconsistency in recording either the concentration or the amount prescribed. Tramadol and methadone were not studied in this report morphine dose equivalence not reliably established for these drugs (National Opioid Use Gudieline Group (NOUGG) 2011). Non-Manitoba residents, and prescriptions for WCB recipients over age 65 were also excluded. Individuals with invasive cancer were identified, by linking the list of individuals prescribed opioids to the provincial cancer registry. All prescriptions dated later than one year before the date of cancer diagnosis were eliminated.
Morphine equivalents (ME) were calculated for each prescription based on the Canadian Guideline for Safe and Effective Use of Opioids for Chronic Non-Cancer Pain morphine equivalency table (National Opioid Use Guideline Group (NOUGG) [2011]. ME for each filled prescription was calculated by multiplying the morphine equivalent of the prescribed drug by the dose prescribed and the number of tablets/transdermal patches included. The total number of ME for all prescriptions prescribed in a calendar month was added and the average number of ME/day over each calendar month was determined. The ME for prescriptions that crossed into two or more calendar months were prorated into their respective months.
As the MCHP data began in 1997 and would have included individuals who were previously prescribed opioids, we elected to study only incident episodes of opioid use defined as either no opioid use in 1997, or a gap of 90 days between the end of one prescription and the date the next prescription was filled. For consistency we eliminated WCB claims for 1997. We identified episodes of continuous use of opioids where ME had been prescribed without a break of two calendar months. The study period covered complete calendar years from 1998 to 2010. The study included 583,519 Manitobans of whom 18,418 individuals had one or more WCB claims.
Study Design
We performed a descriptive study of opioid prescription over time and a cross sectional study of demographic and opioid duration of usage and dosage variables comparing WCB recipients to other Manitobans. The cross sectional study was performed for the month of December 2010 to maximize the number of individuals who had the opportunity to be prescribed long-term opioids. Age, sex, area of residence, and socioeconomic status (SES) were potential confounding variables identified. SES was based on average household income within geographic dissemination areas, based on the 2006 census. In Manitoba, these areas contain an average of 550 persons. These were divided into quintiles for all individuals prescribed opioids with I being the lowest and V the highest income quintile. Logistic regression was performed to identify associations with high dose opioid prescription defined as ≥ 120 ME/day [Franklin et al., 2012]. This analysis was repeated for December 2009 to verify the results from 2010.
Outcome Measures
Adjusted odds ratios with 95% confidence intervals (OR; 95%CI) were the measure of association reported for the logistic regressions. Comparisons of means were analyzed with t-tests and comparison of proportions with χ square testing. All data were analyzed using SAS version 9.3 (Cary, NC, USA).
Ethics
This research proposal was approved by the Research Ethics Board of the University of Manitoba and the Health Information Privacy Committee of the Manitoba Government.
RESULTS
Over the period from 1998 to 2010, 3.8% of the total opioid dosage of medication prescribed in the study population were prescribed to WCB recipients. WCB recipients accounted for 2.1% of the individuals prescribed opioids. The percentage of total opioid prescribed to WCB recipients rose from 1.8% in 1998 to a peak of 4.4% in 2008 before falling to 3.8% in 2010 while the percentage of Manitobans age 18–65 prescribed opioids who were WCB recipients rose from 1.6% in 1998 (n = 1452) to peak at 2.5% in 2006 (n = 2605) before falling to 2.0% in 2010 (n = 2143). The average amount of opioid prescribed per person per year rose dramatically in both groups, but more so in the WCB group (Fig. 1).
Figure 1.
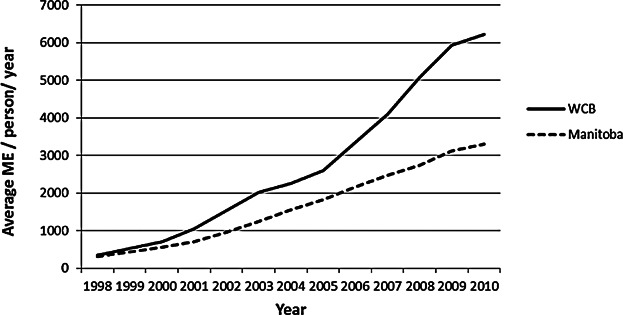
Average Morphine Equivalents (ME) Prescribed/Person/Year for WCB recipients and all Manitobans prescribed opioids.
The vast majority of prescription opioids were prescribed for relatively short periods of time (Table1). Approximately 19% of WCB recipients had > 3 month duration of continuous opioid use compared to 11% of Manitobans. Longer periods of continuous use were associated with much higher levels of prescribed opioids (Table1).
TABLE I.
Duration of Opioid Use and Mean Morphine Equivalents (ME)/Day for Episodes of Opioid Use for WCB Recipients and all Manitobans Age 18–65, 1998–2007
| Duration of use | WCB (n = 16,037) | Manitoba (n = 962,369) | |||||
|---|---|---|---|---|---|---|---|
| Number | Percentage | Mean ME/day | Number | Percentage | Mean ME/day | P-value* | |
| 0–3 months | 13,001 | 81.1% | 6.85 | 859,376 | 89.3% | 5.19 | <0.001 |
| 4–11 months | 2,315 | 14.4% | 9.49 | 73,377 | 7.6% | 7.82 | 0.004 |
| 1.0–1.9 years | 381 | 2.4% | 16.71 | 12,750 | 1.3% | 14.54 | 0.270 |
| 2.0–3.9 years | 147 | 0.9% | 28.38 | 6,813 | 0.7% | 25.54 | 0.568 |
| ≥ 4 years | 193 | 1.2% | 79.38 | 10,053 | 1.0% | 59.04 | 0.028 |
t-test comparing mean ME/day.
In a December 2010 cross sectional snap shot, 2.1% of individuals prescribed opioids in the study population were WCB recipients, 3.3% of men and 1.1% of women. WCB recipients prescribed opioids were more likely be from lower SES quintiles, Winnipeg, and be in between age 40–60 than other Manitobans (Table2). They also had longer duration of continuous morphine usage. Although the mean opioid use duration among WCB recipients (25 months) did not differ significantly from that among Manitobans (23 months), WCB recipients had a significantly higher percent of opioid durations > 3 months (66% vs 58%, P < 0.001). WCB recipients were also approximately twice as likely to be prescribed ≥ 120 ME/day (11.8% vs 5.8%) (Table2). In adjusted analyses, age, sex, area, SES and duration of continuous use were all associated with being prescribed high dose opioids. As well, being a WCB recipient was associated with an increased odds ratio (OR 2.06; 95% CI 1.58–2.69) of being prescribed ≥ 120 ME/day (Table3). In analyses stratified by duration of continuous use, being a WCB recipient was associated with increased odds of being prescribed over 120 ME/day for longer durations of time, but not for periods of less than one year (Table4).
TABLE II.
Demographic and Socioeconomic Comparison of WCB Recipients and Other Manitobans Prescribed Opioids in December, 2010
| Variable | WCB | Manitoba | P-value |
|---|---|---|---|
| Number | 643 | 29,513 | |
| Sex | |||
| Male (n, %) | 463 (72.01) | 13,629 (46.18) | <0.001* |
| Age (n,%) | <0.001* | ||
| 18–29 | 33 (5.13) | 4,381 (14.84) | |
| 30–39 | 104 (16.17) | 5,506 (18.65) | |
| 40–49 | 234 (36.39) | 7,874 (26.69) | |
| 50–59 | 220 (34.21) | 8,377 (28.38) | |
| 60–64 | 52 (8.09) | 3,375 (11.44) | |
| SES Quintile I (Lowest) | 147 (22.86) | 5,826 (19.74) | <0.001* |
| II | 140 (21.77) | 5,412 (18.34) | |
| III | 158 (24.57) | 5,592 (18.95) | |
| IV | 138 (21.46) | 5,842 (19.79) | |
| V (Highest) | 60 (9.33) | 6,841 (23.18) | |
| Health Region (n, %) | |||
| Interlake-Eastern | 75 (11.74) | 3,268 (11.07) | 0.002* |
| Northern | 26 (4.07) | 2,106 (7.14) | |
| Southern | 81 (12.68) | 2,919 (9.89) | |
| Western | 75 (11.74) | 4,300 (14.57) | |
| Winnipeg | 382 (59.78) | 16,919 (57.33) | |
| Mean duration of continuous usage of ME (n, S.D) | 25.44 (s.d. 32.01) | 23.31 (s.d. 33.07) | 0.106† |
| Duration of continuous usage to date | |||
| 0–3 months (n, %) | 219 (34.06) | 12,453 (42.19) | 0.001* |
| 3–11 months | 107 (16.654) | 4,521 (15.32) | |
| 1.0–1.9 years | 89 (13.84) | 3,301 (11.18) | |
| 2.0 –3.9 yrs | 99 (15.40) | 3,886 (13.17) | |
| >4 yrs | 129 (20.06) | 5,352 (18.13) | |
| Mean Morphine Equivalents/day (n, S.D) | 54.02 (155.64) | 34.39 (s.d. 116.16) | <0.001† |
| Morphine Equivalents/day (n, %) | |||
| 0–19 | 400 (62.21) | 21,936 (74.33) | <0.001* |
| 20–69 | 136 (21.15) | 4,971 (16.84) | |
| 70–119 | 31 (4.82) | 909 (3.08) | |
| 120+ | 76 (11.82) | 1,697 (5.75) |
χ-square.
t-test.
TABLE III.
Associations With Being Prescribed ≥ 120 Morphine Equivalents (ME)/Day in Manitoba, Canada December 2010 (n = 30,156) a
| Variable | Odds Ratio | 95% Confidence Intervals |
|---|---|---|
| Male | 1.31 | (1.18–1.45) |
| Age 18–39 | 0.87 | (0.76–1.00) |
| Months-Continuous opioid use | 1.027 | (1.026–1.029) |
| Lower 3 quintiles socioeconomic status | 1.90 | (1.71–2.13) |
| Winnipeg resident | 1.19 | (1.07–1.33) |
| WCB recipient | 2.06 | (1.58–2.69) |
Reference groups female, age 40–65, highest 2 quintiles socioeconomic status, non-Winnipeg resident, non-WCB recipient.
TABLE IV.
Adjusted Stratified Odds Ratios (95% CI) for WCB Recipients for Being Prescribed Morphine Equivalent Dosage of ≥ 120 ME/Daya
| Time period | December 2010 | December 2009 |
|---|---|---|
| Duration of continuous opioid use | ||
| Less than 1.0 years | 1.11 (0.35–3.52), n = 17,300 | 1.54 (0.67–3.51), n = 17,246 |
| 1.0–3.9 years | 1.47 (0.93–2.31), n = 7,375 | 2.04 (1.40–2.98), n = 6,938 |
| More than 4.0 years | 2.16 (1.50–3.13), n = 5,468 | 1.69 (1.12–2.54), n = 4,748 |
Results adjusted for age, sex, area of the province, socioeconomic status.
DISCUSSION
The WCB of Manitoba pays for a small, but significant amount of the total opioid used in the working age population of the province of Manitoba. We observed a significant rise in the average yearly amount of opioid prescribed per individual from 1998 to 2010 in both the WCB recipients, consistent with other evidence [Bernacki et al., 2012], and in the general population comparison. This rise was due to two reasons. First, in 1998 only use amongst new users was observed as per study design. As each year passed more individuals who had been on opioids for longer periods of time were included in the study. As duration of use is associated with an increasing dose of opioid prescribed [Tao et al., 2012b], this translates into higher average opioid use per year in the study population. In addition, higher doses of opioids were being used over time even after controlling for duration of use (data not shown). The rise of the slope was steeper in the WCB group due to a combination of these two reasons.
The WCB recipients' contribution to opioid usage in Manitoba began to decline in 2008 due to a smaller number of individuals receiving opioids and not a decrease in the average amount prescribed per recipient. The decrease in WCB opioid recipients corresponds to a decrease in the number of time loss claims (Workplace Safety and Health Division of Manitoba Labour and Workers Compensation Board of Manitoba 2013), which account for 90% of the WCB recipients in the study population (results not shown).
WCB recipients had longer durations of opioid use than other Manitobans. The underlying indication for opioid use may influence this finding [Gross et al., 2009]. WCB recipients were also more likely to be on high dose opioids. This association remained present after controlling for a number of potential confounders and in the stratified analysis of individuals who were on continuous opioids for longer periods. Having a long-term WCB claim may influence opioid use for a number of reasons. WCB recipients have often been reported to have poorer outcomes after a variety of types of surgery after controlling for other factors [Gum et al., 1976; de Moraes et al., 2012; de Moraes et al., 2013]. Pain and Oswestry Disability Index scores have been found to correlate with workers compensation and litigation status in a study of patients with spinal disorders [Prasarn et al., 2012]. WCB recipients with spinal disorders have also been reported to have lower scores in a variety of measures in the Short Form Health Survey (SF -36) which was attributed by the authors to psychological factors [Hee et al., 2001]. Thus WCB recipients reporting pain may be at increased risk for opioid dose escalation compared to other individuals prescribed opioids because of their involvement in a medical legal system and for other psychosocial reasons.
Prescription opioids usage is a significant issue in workers compensation populations. Early opioid use in the management of acute low back pain has been associated with adverse outcomes in a workers' compensation population [Webster et al., 2007]. After adjustment for pain, function, injury severity, and other baseline covariates, receipt of opioids for more than 7 days (odds ratio = 2.2; 95% confidence interval, 1.5–3.1) and receipt of more than one opioid prescription was associated significantly with work disability at one year [Franklin et al., 2008]. Findings from a study of WCB nonspecific low back pain claims [Volinn et al., 2009] revealed that compared with the (no opioid) reference group, odds of chronic work loss were six times greater for claimants that used strong opioids and 11–14 times greater for claimants with opioid prescriptions which exceeded 90 days. Three years after the injury the cost of the claim was almost $20,000 greater for the workers using strong opioids. These authors suggested that the use of strong opioids in these cases did not arrest the cycle of work loss and pain. Dependence and addiction are common consequences of chronic opioid therapy, which can occur in up to one-third of patients [Juurlink and Dhalla, 2012].
Our study has a number of limitations. First we were not able to control for the underlying indication for prescription of opioids. Second, although we did control for a number of potential confounders we did not control for mental health issues, which may influence opioid use, and outcomes [Parhami et al., 2012; Cheng et al., 2013]. Thirdly, we lack information about level of function in people prescribed opioids. In addition, there may be some misclassification of prescription opioid use between the WCB and the general health system. Finally, we did not have information on opioid use while in hospital which theoretically may have affected our findings. Although we have not included methadone in our analysis, methadone is only prescribed to about 0.1% of the WCB population prescribed opioids in Manitoba, so we do not feel this is a significant limitation in our work.
Our study, however, has a number of strengths. It is the only study we are aware of, that is population based, able to compare opioid use in WCB recipients with the general population, and control for a variety of potential confounding factors including area of residence and SES. Second, we had detailed information for opioid prescriptions from a comprehensive government source to allow for accurate calculation of the prescribed amount of ME/day. In addition, as WCB recipients in Manitoba receive care from their usual medical providers, our results are unlikely to be biased by WCB claimants only seeing select physicians who may have different prescribing habits than other physicians in the area. Finally, although some of our data are novel, the data on WCB recipients are consistent with other data, supporting their validity [Bernacki et al., 2012; Tao et al., 2012b].
In summary, our results show that WCB claimants are prescribed opioid medications for longer durations and have a higher likelihood of being prescribed high dose opioids than other Manitobans. Ensuring that the appropriate pain medications and doses are used in this population is extremely important to limit potential adverse outcomes [Franklin et al., 2012].
Acknowledgments
The authors thank the Manitoba Centre for Health Policy for use of the Population Health Research Data Repository. The results and conclusions are those of the authors and no official endorsement by the Manitoba Centre for Health Policy or Manitoba Health should be inferred. Funding for this research was obtained from a Research and Workplace Innovation Program (RWIP) grant from the Workers Compensation Board (WCB) of Manitoba. Although the WCB provided data for the project, it had no role in the analysis, writing of the manuscript or in the decision to submit for publication.
REFERENCES
- Bernacki EJ, Yuspeh L, Lavin R, Tao XG. Increases in the use and cost of opioids to treat acute and chronic pain in injured workers, 1999 to 2009. J Occup Environ Med. 2012;54:216–223. doi: 10.1097/JOM.0b013e318240de33. [DOI] [PubMed] [Google Scholar]
- Cheng M, Sauer B, Johnson E, Porucznik C, Hegmann K. Comparison of opioid-related deaths by work-related injury. Am J Ind Med. 2013;56:308–316. doi: 10.1002/ajim.22138. [DOI] [PubMed] [Google Scholar]
- de Moraes VY, Godin K, Dos Santos JB, Faloppa F, Bhandari M, Belloti JC. Influence of compensation status on time off work after carpal tunnel release and rotator cuff surgery: A meta-analysis. Patient Saf Surg. 2013;7:1–7. doi: 10.1186/1754-9493-7-1. [DOI] [PMC free article] [PubMed] [Google Scholar]
- de Moraes VY, Godin K, Tamaoki MJ, Faloppa F, Bhandari M, Belloti JC. Workers' compensation status: does it affect orthopaedic surgery outcomes? A meta-analysis. PLoS One. 2012;7:e50251. doi: 10.1371/journal.pone.0050251. [DOI] [PMC free article] [PubMed] [Google Scholar]
- Franklin GM, Mai J, Turner J, Sullivan M, Wickizer T, Fulton-Kehoe D. Bending the prescription opioid dosing and mortality curves: Impact of the Washington State opioid dosing guideline. Am J Ind Med. 2012;55:325–331. doi: 10.1002/ajim.21998. [DOI] [PubMed] [Google Scholar]
- Franklin GM, Mai J, Wickizer T, Turner JA, Fulton-Kehoe D, Grant L. Opioid dosing trends and mortality in Washington State workers' compensation, 1996- 2002. Am J Ind Med. 2005;48:91–99. doi: 10.1002/ajim.20191. [DOI] [PubMed] [Google Scholar]
- Franklin GM, Stover BD, Turner JA, Fulton-Kehoe D, Wickizer TM. Early opioid prescription and subsequent disability among workers with back injuries: The Disability Risk Identification Study Cohort. Spine (Phila Pa 1976) 2008;33:199–204. doi: 10.1097/BRS.0b013e318160455c. [DOI] [PubMed] [Google Scholar]
- Government of Manitoba. 2013a. Manitoba buisness facts: The Manitoba Economy: Diverse, Developed and Dynamic . Accessed October 30, 2008a.
- Government of Manitoba. 2013b. Manitoba buisness facts; Workforce: Workers Compensation.
- Gross DP, Stephens B, Bhambhani Y, Haykowsky M, Bostick GP, Rashiq S. Opioid prescriptions in canadian workers' compensation claimants: prescription trends and associations between early prescription and future recovery. Spine (Phila Pa 1976) 2009;34:525–531. doi: 10.1097/BRS.0b013e3181971dea. [DOI] [PubMed] [Google Scholar]
- Gum JL, Glassman SD, Carreon LY. Is type of compensation a predictor of outcome after lumbar fusion. Spine (Phila Pa 1976) 1976;38:443–448. doi: 10.1097/BRS.0b013e318278ebe8. [DOI] [PubMed] [Google Scholar]
- Hee HT, Whitecloud TS, III, Myers L, Gaynor J, Roesch W, Ricciardi JE. SF-36 health status of workers compensation cases with spinal disorders. Spine J. 2001;1:176–182. doi: 10.1016/s1529-9430(01)00080-8. [DOI] [PubMed] [Google Scholar]
- Juurlink DN, Dhalla IA. Dependence and addiction during chronic opioid therapy. J Med Toxicol. 2012;8:393–399. doi: 10.1007/s13181-012-0269-4. [DOI] [PMC free article] [PubMed] [Google Scholar]
- Koryrskyj A, Raymond C, Dahl M. 2009. , et al. Effects of Manitoba Pharmacare formulary policy on utilization of prescription medications. Manitoba Center for Health Policy.
- National Opioid Use Gudieline Group (NOUGG) 2011. Canadian Guideline for Safe and Effective Use of Opioids for Chronic Non-Cancer Pain http://nationalpaincentre.mcmaster.ca/documents/practicetoolkit.pdf.
- Parhami I, Hyman M, Siani A, Lin S, Collard M, Garcia J, Casaus L, Tsuang J, Fong TW. Screening for addictive disorders within a workers' compensation clinic: An exploratory study. Subst Use Misuse. 2012;47:99–107. doi: 10.3109/10826084.2011.629705. [DOI] [PMC free article] [PubMed] [Google Scholar]
- Prasarn ML, Horodyski MB, Behrend C, Wright J, Rechtine GR. Negative effects of smoking, workers' compensation, and litigation on pain/disability scores for spine patients. Surg Neurol Int. 2012;3:S366–S369. doi: 10.4103/2152-7806.103870. [DOI] [PMC free article] [PubMed] [Google Scholar]
- Roos LL, Gupta S, Soodeen RA, Jebamani L. Data quality in an information-rich environment: Canada as an example. Can J Aging. 2005;24:153–170. doi: 10.1353/cja.2005.0055. (Suppl 1): [DOI] [PubMed] [Google Scholar]
- Roos NP, Roos LL, Brownell M, Fuller EL. Enhancing policymakers' understanding of disparities: Relevant data from an information-rich environment. Milbank Q. 2010;88:382–403. doi: 10.1111/j.1468-0009.2010.00604.x. [DOI] [PMC free article] [PubMed] [Google Scholar]
- Tao XG, Lavin RA, Yuspeh L, Bernacki EJ. Impact of the combined use of opioids and surgical procedures on workers' compensation cost among a cohort of injured workers in the state of Louisiana. J Occup Environ Med. 2012a;54:1513–1519. doi: 10.1097/JOM.0b013e3182664866. [DOI] [PubMed] [Google Scholar]
- Tao XG, Lavin RA, Yuspeh L, Bernacki EJ. Natural history of opioid dosage escalation post-injury: A cohort study of injured workers in the State of Louisiana. J Occup Environ Med. 2012b;54:439–444. doi: 10.1097/JOM.0b013e3182451e39. [DOI] [PubMed] [Google Scholar]
- The Board of Regents of the University of Wisconsin System. 2013. Interactive Opioid Consumption Chart. 2013 . Available from: http://ppsg-production.heroku.com/chart.
- Volinn E, Fargo JD, Fine PG. Opioid therapy for nonspecific low back pain and the outcome of chronic work loss. Pain. 2009;142:194–201. doi: 10.1016/j.pain.2008.12.017. [DOI] [PubMed] [Google Scholar]
- Webster BS, Cifuentes M, Verma S, Pransky G. Geographic variation in opioid prescribing for acute, work-related, low back pain and associated factors: A multilevel analysis. Am J Ind Med. 2009;52:162–171. doi: 10.1002/ajim.20655. [DOI] [PubMed] [Google Scholar]
- Webster BS, Verma SK, Gatchel RJ. Relationship between early opioid prescribing for acute occupational low back pain and disability duration, medical costs, subsequent surgery and late opioid use. Spine (Phila Pa 1976) 2007;32:2127–2132. doi: 10.1097/BRS.0b013e318145a731. [DOI] [PubMed] [Google Scholar]
- White JA, Tao X, Talreja M, Tower J, Bernacki E. The effect of opioid use on workers' compensation claim cost in the State of Michigan. J Occup Environ Med. 2012;54:948–953. doi: 10.1097/JOM.0b013e318252249b. [DOI] [PubMed] [Google Scholar]
- Workplace Safety and Health Division of Manitoba Labour and Workers Compensation Board of Manitoba. 2013. The Manitoba Workplace Injury Statistics Report 2000–2012.