Abstract
Retinal motion can modulate visual sensitivity. For instance, low contrast drifting waveforms (targets) can be easier to detect when abutting the leading edges of movement in adjacent high contrast waveforms (inducers), rather than the trailing edges. This target-inducer interaction is contingent on the adjacent waveforms being consistent with one another – in-phase as opposed to out-of-phase. It has been suggested that this happens because there is a perceptually explicit predictive signal at leading edges of motion that summates with low contrast physical input – a ‘predictive summation’. Another possible explanation is a phase sensitive ‘spatial summation’, a summation of physical inputs spread across the retina (not predictive signals). This should be non-selective in terms of position – it should be evident at leading, adjacent, and at trailing edges of motion. To tease these possibilities apart, we examined target sensitivity at leading, adjacent, and trailing edges of motion. We also examined target sensitivity adjacent to flicker, and for a stimulus that is less susceptible to spatial summation, as it sums to grey across a small retinal expanse. We found evidence for spatial summation in all but the last condition. Finally, we examined sensitivity to an absence of signal at leading and trailing edges of motion, finding greater sensitivity at leading edges. These results are inconsistent with the existence of a perceptually explicit predictive signal in advance of drifting waveforms. Instead, we suggest that phase-contingent target-inducer modulations of sensitivity are explicable in terms of a directionally modulated spatial summation.
Keywords: Motion, Spatial coding, Spatial summation, Predictive coding
1. Introduction
Signals encoded in the human visual system necessarily lag the physical events to which they relate (Roufs, 1963; Wilson & Anstis, 1969). Consequently, when we reach to catch a flying ball we must reach to a predicted position, rather than to a position suggested by the instantaneous mapping of retinal activity (McIntyre et al., 2001; de Rugy, Marinovic, & Wallis, 2012; Marinovic & Arnold, 2012, 2013; Marinovic, Plooy, & Arnold, 2012; Diaz et al., 2013). These statements are uncontroversial. What is controversial is the functional substrate for such predictions. These could be mediated by mechanisms responsible for motor programming, leaving visual perception to be an on-line monitor of the visual scene as sampled by the retina (Moutoussis & Zeki, 1997; Bartels & Zeki, 1998; Whitney & Murakami, 1998; Arnold, Clifford, & Wenderoth, 2001; Arnold & Clifford, 2002). Alternatively, these predictions could be implemented, at least in part, by visual processing. Accordingly, moving stimuli might be seen in an extrapolated position relative to contemporary retinal input (Ramachandran & Anstis, 1990; De Valois & De Valois, 1991; Maus & Nijhawan, 2009; Nijhawan, 1994, 2008; Nijhawan & Wu, 2009; Roach, McGraw, & Johnston, 2011).
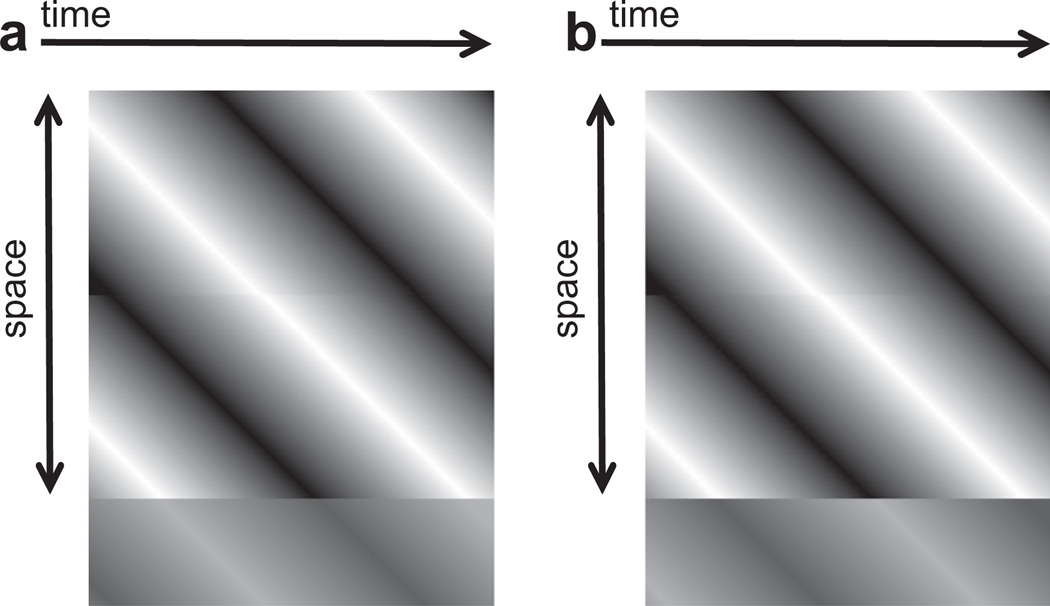
Early evidence for perceptual extrapolation was based on several visual illusions in which the location of a moving pattern appears shifted forward, in the direction of its motion (De Valois & De Valois, 1991; Ramachandran & Anstis, 1990; reviewed in Whitney, 2002). More recent evidence was revealed by an interaction between adjacent moving gratings (Roach, McGraw, & Johnston, 2011). If a low contrast target grating is placed at the leading edge of a drifting high contrast inducer grating, target sensitivity can be enhanced when the target is in-phase with the inducer, relative to when it is out-of-phase (see Fig. 1). No such effect was reported at trailing edges of motion (Roach, McGraw, & Johnston, 2011). This ‘phase-contingent’ interaction at leading edges of motion was attributed to there being a perceptually explicit predictive signal in advance of moving patterns that summates with physical input, thereby modulating target sensitivity. Hence, when the predictive signal and the physical target are in accord (the in-phase condition, see Fig. 1a), predictive-summation would result in the target being more visible. Summating out-of-phase predictions and target signals (see Fig. 1b) would result in the two cancelling one another, and consequently in the physical target being less visible. This interpretation depends on there being no such interaction at trailing edges of motion, as there should be no predictive signal trailing behind a moving pattern.
Fig. 1.
Space time plots depicting high contrast inducing waveforms (above) and low-contrast targets (below). When the target is positioned at the leading edge of inducer movement, and the target and inducer waveforms are in-phase (a) it is easier to detect the target relative to when the target and inducer are out-of-phase (b).
Phase-contingent sensitivity modulations at leading edges of motion, coupled with the absence of such interactions at trailing edges, are generally consistent with the possibility of a perceptually explicit predictive signal in advance of moving patterns (De Valois & De Valois, 1991; Nijhawan, 2008; Roach, McGraw, & Johnston, 2011). However, these results are equally consistent with the idea that there is a non-predictive phase contingent spatial summation process (Anderson & Burr, 1991; Meese, 2010) everywhere except at the trailing edge. Perhaps there is an absence, or a suppression, of such interactions at trailing edges of moving patterns (see Arnold, Thompson, & Johnston, 2007; Marinovic & Arnold, 2013; Whitney et al., 2003). Accordingly, the remarkable observation would not be the presence of phase contingent patterns of summation at leading edges of motion, but the absence of such interactions at trailing edges.
We conducted a series of experiments to assess whether phase-contingent target-inducer interactions reflect on a summation involving a perceptually explicit predictive signal at leading edges of motion (Roach, McGraw, & Johnston, 2011), or a phase-contingent spatial summation (Anderson & Burr, 1991; Meese, 2010; Ringach, 2002; Hubel & Wiesel, 1959) that is reduced at trailing edges of motion (Arnold, Thompson, & Johnston, 2007; Marinovic & Arnold, 2013; Whitney et al., 2003). To foreshadow our results, we find evidence for summation at both the leading and trailing edges of motion, though the effect is reduced at trailing edges. We also find evidence for summation involving adjacent flicker (which contains no net motion energy) and for waveforms at the side edge of motion. All of these observations are consistent with a spatial summation that modulates target sensitivity and is reduced at trailing edges of motion. We also examine summation at leading and trailing edges of motion using a checkerboard-like stimulus, which sums to grey across a small retinal expanse. Consequently we would not predict target sensitivity for this stimulus to benefit from spatial summation, which is consistent with our results. Finally, we assess sensitivity to an absence of signal at leading and trailing edges of motion, and find higher sensitivity at leading edges. In sum, our data are inconsistent with the existence of a perceptually explicit predictive signal at leading edges of motion, but are consistent with target sensitivity being modulated via a spatial summation of physical inputs, which is reduced at trailing edges.
2. General methods – Experiments 1–5
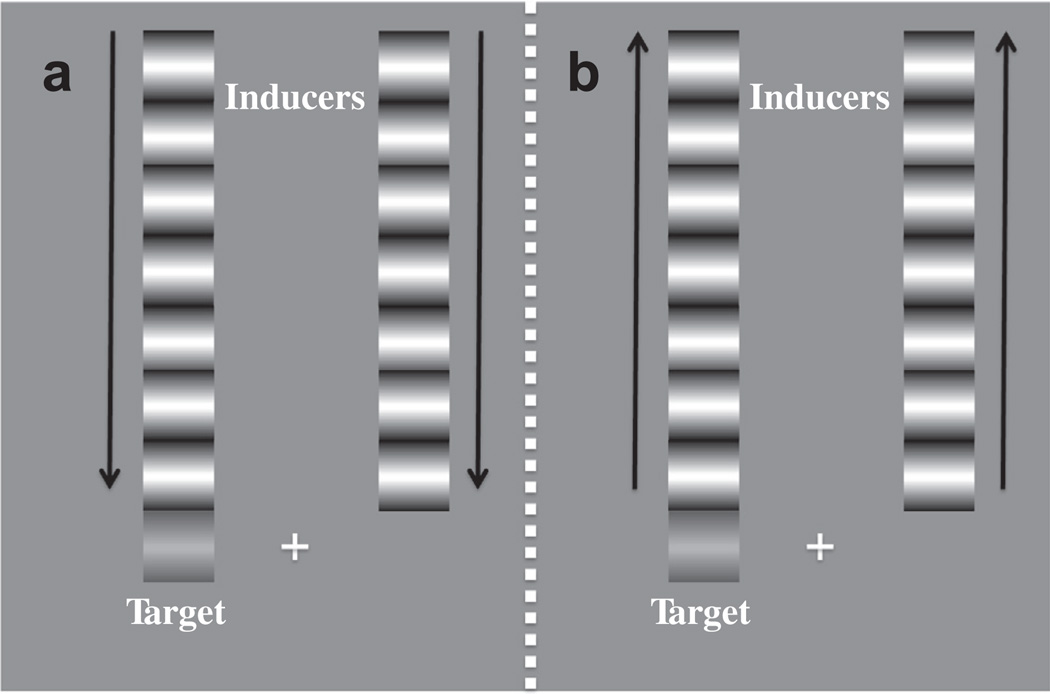
Stimuli and the experimental protocol were closely matched to those used in two previous, closely related, studies (Arnold, Thompson, & Johnston, 2007; Roach, McGraw, & Johnston, 2011). Participants were asked to fixate a cross in the centre of the screen and indicate where a faint ‘target’ grating had been presented. In these experiments targets were centred either 2 degrees of visual angle (dva) to the left or right of fixation, determined at random on a trial-by-trial basis. The target had a width and height subtending 1 dva and a spatial frequency of 1 cycle/dva (see Fig. 2).
Fig. 2.
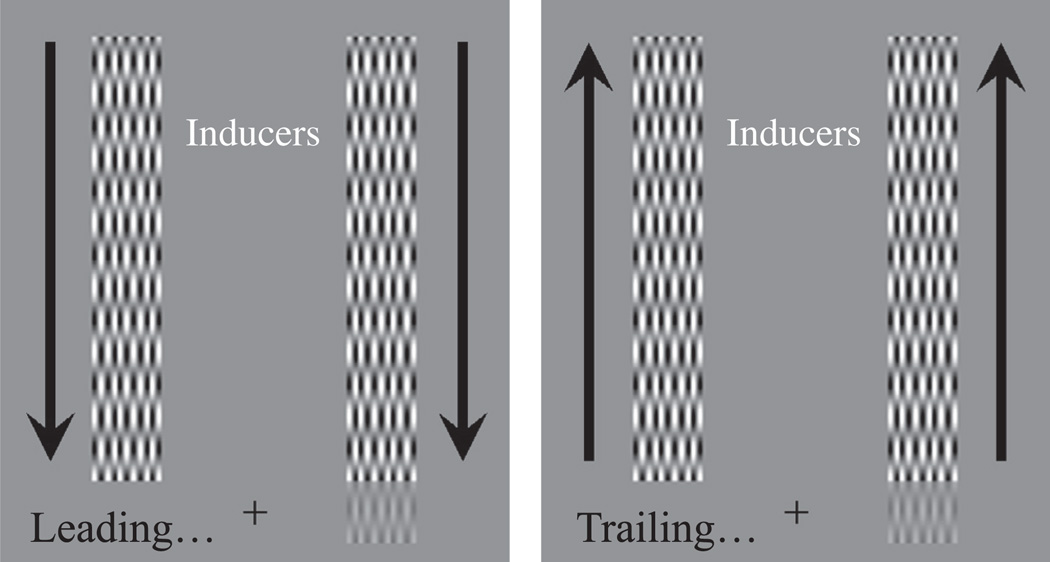
Experiment 1 Stimuli. A fixation cross hair was positioned in the centre of the display. A low-contrast target was presented either to the left or right of fixation (here the left). High contrast inducing waveforms were positioned either above or below fixation (here above), with one inducer abutting the target. Both the target and inducing waveforms contained movement drifting in the same direction. Inducing motion could be toward the target position (a – leading edge condition) or away (b – trailing edge condition).
Two inducing gratings were positioned either above or below the target grating. Inducer positions, above or below fixation, were determined at random on a trial-by-trial basis. Inducing gratings were centered ±2 dva to the left and right of fixation, had a width subtending 1 dva, a height of 7 dva, a spatial frequency of 1 cycle/dva, and were presented at a Michelson contrast of 100%.
Inducing and target gratings were animated, such that they had a common direction and drifted at a frequency of 5 Hz. In Experiments 1, 2 and 5 inducing waveforms either drifted toward the target (leading edge condition) or away from the target (trailing edge condition), and in both cases the test was displayed for 1 s.
During a block of trials the phase of the target waveform was varied relative to that of the inducer. Four values were sampled. Target waveforms could be in phase with inducers (0° shift), one-quarter cycle advanced (90° shift), out of phase (180° shift) or advanced by three-quarters of a cycle (270° shift).
3. Experiment 1 – Phase contingent sensitivity modulations at leading and trailing edges of motion
3.1. Methods
Target and inducing gratings were abutting. There were 11 participants, including the first two authors, an undergraduate research student and 8 additional participants who were naïve as to the purpose of the experiment. Participants completed blocks of trials, each sampling a single phase relationship. Each participant completed 4 blocks of trials sampling different target-inducer phase relationships, with target waveforms in phase with inducers (0° shift), one-quarter cycle advanced (90° shift), out of phase (180° shift) or advanced by three-quarters of a cycle (270° shift).
During a run of trials the luminance contrast of target gratings was adjusted (Michelson contrasts 0%, 0.2%, 0.4%, 0.6%, 0.8%, 1.2% and 4.0%) according to the method of constant stimuli. On each trial, targets were presented at leading or trailing edges of the inducing gratings. During a block of trials each contrast level was sampled 20 times for targets in each test location, so a block of trials consisted of 280 individual trials, all completed in a pseudo random order. Four blocks of trials were completed by each participant, also in a pseudo random order.
3.2. Results and discussion
Logistic functions were fitted to individual distributions of correct target localisation as a function of target contrast, for each combination of target location and target-inducer phase, and 75% points were taken as estimates of the participants’ target detection threshold for that condition.
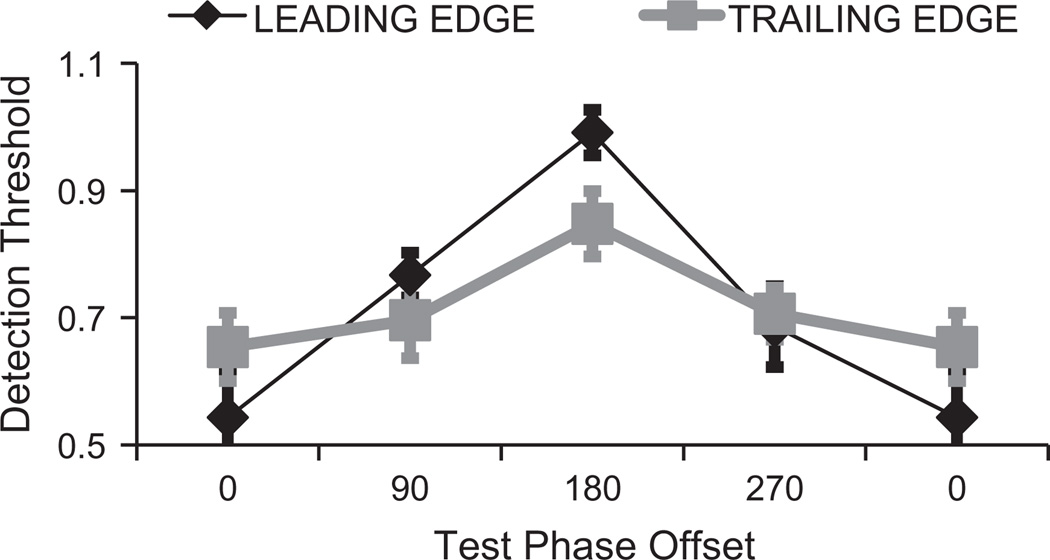
A 2 (edge) × 4 (phase) repeated measures ANOVA was conducted to assess how target visibility had been impacted by target position and target/inducer phase relationship. There was a significant interaction between phase and target position (F3,30 = 4.16, p = 0.014, ηp2 = 0.29). As can be seen in Fig. 3, while targets at leading edges were more visible than targets at trailing edges when target and inducing waveforms were in phase (a phase relationship of 0°), this situation was reversed when target and inducing waveforms were out of phase (a phase relationship of 180°).
Fig. 3.
Results of Experiment 1. Target detection thresholds are plotted as a function of the phase relationship between target and inducing waveforms. Functions are plotted for targets at leading (black) and trailing (grey) edges of motion in abutting inducing gratings. Note that data for a phase relationship of 0° are plotted twice, to reflect the cyclical nature of phase relationships.
There was a robust interaction between phase and target position, replicating a key feature of Roach, McGraw, and Johnston’s (2011) data. But closer inspection of our data reveals an important inconsistency. The prior study reported that only targets at leading edges of motion were impacted by target/inducer phase. A repeated measures ANOVA involving data for leading edge targets confirmed that sensitivity to leading edge targets was similarly impacted by target/inducer phase in our study (F3,30 = 17.24, p < 0.001, ηp2 = 0.63). However, the results of Experiment 1 also revealed a smaller, but still significant, modulation of target sensitivity as a function of target/inducer phase at trailing edges (F3,30 = 8.46, p = 0.016, ηp2 = 0.46). Note, however, that there is a hint of a similar trend in data for sensitivity at trailing edges of motion reported by Roach, McGraw, and Johnston (2011) – sensitivity for out-of-phase targets at training edges in their data was less than sensitivity to in-phase-targets, although this difference was apparently not associated with a statistically significant difference.
Having reported a relationship between target sensitivity and target/inducer phase at leading edges of motion, Roach, McGraw, and Johnston (2011) went onto demonstrate that this was driven by a tightly localised operation – it did not survive even small target/inducer gaps. However, this relationship was only tested at leading edges of motion, presumably because the relationship was not as clearly evident at the trailing edges in their initial experiment. The results of our Experiment 1 suggest that target/inducer interactions at trailing edges merit further investigation. Experiment 2 was therefore conducted both to see if we could replicate the results of Experiment 1 in matched conditions, and to see if target/inducer interactions at leading and trailing edges of motion were similarly tightly localised.
4. Experiment 2 – Phase contingent sensitivity modulations across spatial gaps
4.1. Methods
Details for Experiment 2 were as for Experiment 1, with the following exceptions. There were 6 participants, including the first two authors, an undergraduate research student and 3 others who were naïve as to the purpose of the experiment. All had normal, or corrected to normal, visual acuity.
Only phase relationships of 0° and 180° were sampled for inducing gratings that either abutted targets (a gap of 0 dva), or were vertically separated by 0.2, 0.3, 0.5 or by 1.0 dva. Each target/inducer gap was sampled in different blocks of trials. In total, each participant completed 10 blocks of trials in a pseudo random order, one for each of the 5 target/inducer gaps for phase relationships of 0° and 180°.
4.2. Results and discussion
Logistic functions were fitted to each individual’s distributions of correct target localisation as a function of target contrast, and 75% points were taken as estimates of the target detection threshold. Thresholds were determined for targets at leading and trailing edges of inducer motion for each target/inducer phase relationship (0° and 180°) at each of the 5 sampled spatial offsets (see Fig. 4).
Fig. 4.
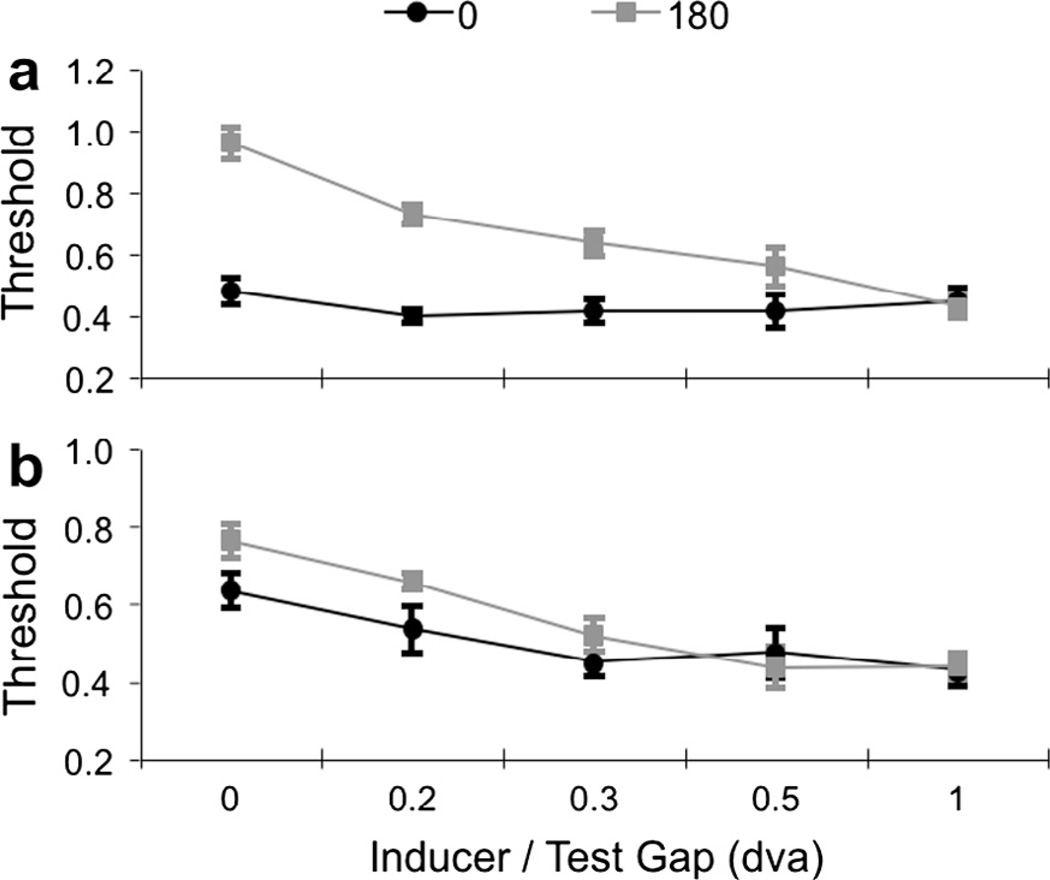
Results of Experiment 2. Target detection thresholds are plotted as a function of the spatial gap between target and inducing waveforms. Functions are plotted for targets abutting or proximate to leading (a) and trailing (b) edges of movement in inducing gratings. Data are plotted separately for thresholds obtained at a target/inducer phase relationship of 0° (in-phase, black) and 180° (out-of-phase, grey).
A 2 (phase) × 5 (target/inducer offset) repeated measures ANOVA involving data for targets at leading edges of motion revealed significant main effects for target/inducer offset (F4,20 = 12.48, p < 0.001, ηp2 = 0.71), target/inducer phase (F1,5 = 60.03, p = 0.001, ηp2 = 0.92), and a significant interaction between offset and phase (F4,20 = 12.05, p < 0.001, ηp2 = 0.71). These data show that targets at leading edges of motion were easier to detect when they were in-phase with inducing waveforms, and that this effect diminished as the gap between inducing motion and the target diminished.
Another repeated measures ANOVA was conducted for data relating to targets at trailing edges of motion. This also revealed significant main effects for target/inducer offset (F4,20 = 16.99, p < 0.001, ηp2 = 0.77) and target/inducer phase (F1,5 = 6.9, p = 0.047, ηp2 = 0.58). The interaction between target/inducer offset and phase was not statistically significant, but displayed the same trend as data for leading edges of motion, with the advantage for in-phase targets diminishing with increasing separation (F4,20 = 2.1, p = 0.13, ηp2 = 0.29). We attribute the non-significance of this interaction to the in-phase advantage at trailing edges being less than that at leading edges, and consequently more easily lost in measurement error.
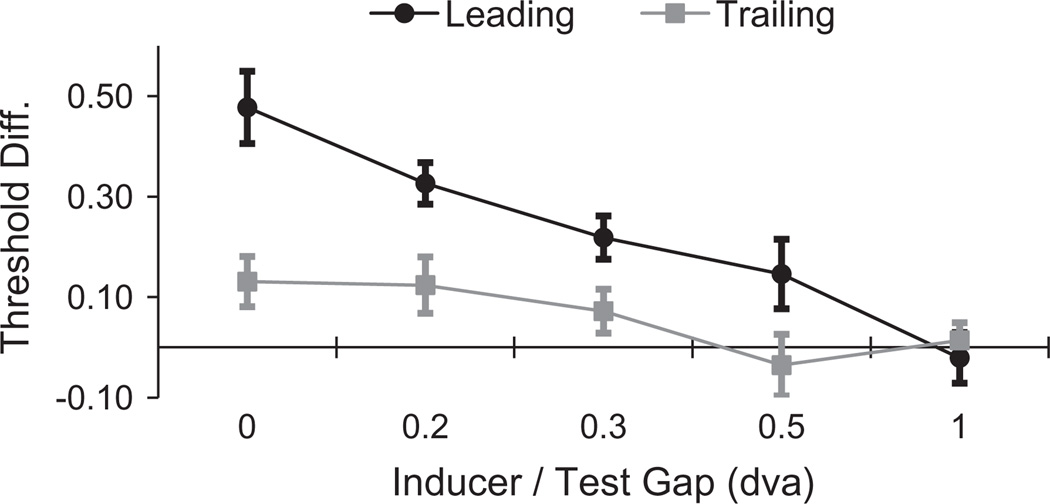
An important question is whether the in-phase advantage at trailing edges of motion reflects a similar, albeit suppressed, process as that which is responsible for the in-phase advantage at leading edges. The data in Fig. 4 are ambiguous on this point. If the in-phase advantages reflect a common process that is reduced at trailing edges, one might expect an interaction between these two measures to show a linear trend – with the difference between in-phase advantages greatest with no target/inducer gap and then reducing with increasing gap size until no advantage is discernable at either edge (see Fig. 5). A polynomial trend analysis was consistent with this (Linear Trend F1,5 = 30.4, p = 0.003, ηp2 = 0.99), but we would not regard this evidence as conclusive.
Fig. 5.
Differences between Target detection thresholds measured for target/inducer phases of 180° (out-of-phase) and 0° (in-phase) plotted as a function of the gap between target and inducing waveforms. Data are shown for threshold differences at leading (black) and trailing (grey) edges of motion.
Data from Experiments 1 and 2 suggest that target/inducer phase-contingent sensitivity modulations are evident at both leading and trailing edges of motion. This suggests a role for a non-directional spatial summation in generating the in-phase advantage. Accordingly, we should be able to find evidence for this summation using abutting gratings with waveforms that are modulated over time to create directionless flicker. We assessed this hypothesis in Experiment 3.
5. Experiment 3 – Phase contingent sensitivity modulations with flicker
5.1. Methods
Details for Experiment 3 were as for Experiment 1, with the following exceptions. There were 8 participants, including the first two authors and 6 others who were naïve as to the purpose of the experiment. All had normal, or corrected to normal, visual acuity. Instead of drifting, the polarity of target and inducer waveforms was sinusoidally counter-phased at a rate of 5 Hz, generating flicker.
5.2. Results and discussion
Logistic functions were fitted to individual distributions of correct target localisation as a function of target contrast, and 75% points were taken as estimates of the participants’ target detection threshold for that target-inducer phase relationship. Thresholds were determined for each of the 4 sampled target/inducer phase relationships.
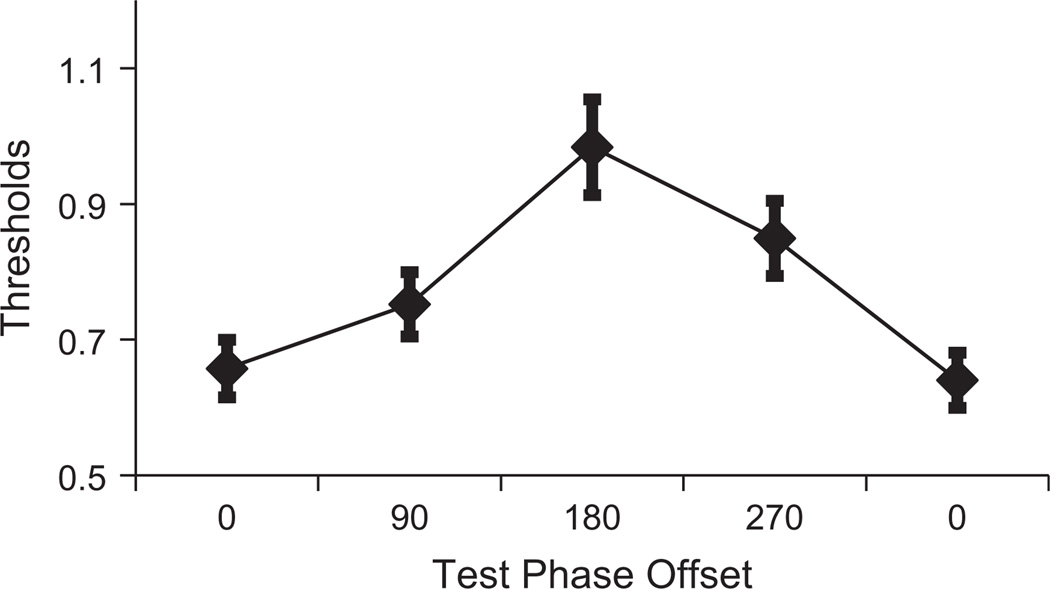
A repeated measures ANOVA revealed a significant main effect for target/inducer phase (F3,21 = 8.92, p = 0.001, ηp2 = 0.56). Target sensitivity was maximal when the target and inducer waveforms were in-phase and minimal when target and inducer waveforms were out-of-phase. This shows that directionless flicker can induce target/inducer phase-contingent sensitivity modulations.
Data from Experiments 1 to 3 are consistent with target sensitivity being modulated by a non-predictive spatial summation process. Target sensitivity was modulated by target-inducer phase at both leading and trailing edges of motion (Experiments 1 and 2), and adjacent to directionless flicker (Experiment 3). If such interactions reflect a non-predictive spatial summation of signals concerning proximate physical inputs, they should be evident not only at leading and trailing edges of motion, but also at side edges of motion. We assessed this possibility in Experiment 4.
6. Experiment 4 – Phase contingent sensitivity modulations at side edges of motion
6.1. Methods
Details for Experiment 4 were as for Experiment 1, with the following exceptions.
There were 8 participants, including the first two authors, an undergraduate research student and 5 others who were naïve as to the purpose of the experiment. All had normal, or corrected to normal, visual acuity.
The orientation of inducing and target waveforms was vertical (as opposed to horizontal), dictating that direction was left/right (as opposed to up/down). Direction (left/right) was randomised on a trial-by-trial basis. Inducing waveforms were positioned such that they either abutted targets, or were displaced vertically (above or below, determined at random on a trial-by-trial basis) to create a 0.5dva gap in between target and inducer. These offsets were sampled in different blocks of trials.
6.2. Results and discussion
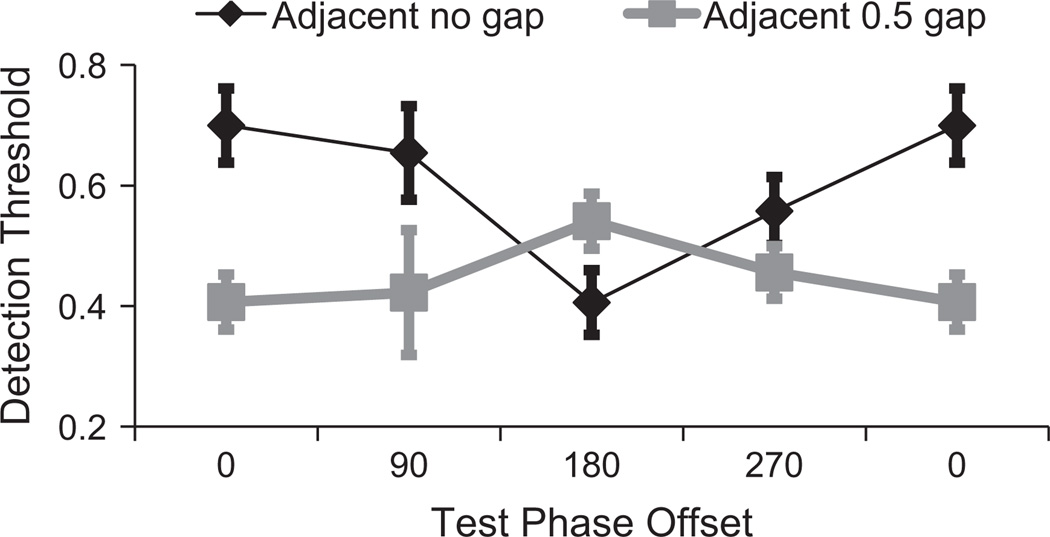
Logistic functions were fitted to individual distributions of correct target localisation as a function of target contrast, and 75% points were taken as estimates of the participants’ target detection threshold for that target-inducer phase relationship. Individual thresholds were determined for each of 4 target/inducer phase relationships for targets that either abutted inducers (black data in Fig. 7) or were separated by a 0.5 dva gap (grey data in Fig. 7).
Fig. 7.
Results of Experiment 4 – Target detection adjacent to direction of motion. Target detection thresholds are plotted as a function of target/inducer phase, for abutting waveforms (black) and for target-inducer gap of 0.5 dva. Error bars depict ±1 SEM between 8 individual threshold estimates.
Data were subjected to a 2 (gap/no gap) × 4 (target/inducer offset) repeated measures ANOVA. This revealed a significant main effect for target/inducer gap (F1,7 = 87, p < 0.001, ηp2 = 0.93), a non-significant main effect for target/inducer phase (F3,21 = 2.44, p = 0.09, ηp2 = 0.26), and a significant interaction between gap and phase (F3,21 = 7.42, p < 0.001, ηp2 = 0.52). Note that the qualitative pattern of data obtained with a gap between target and inducers (grey data in Fig. 7) was matched to the results of Experiment 1, with lowest thresholds for in-phase targets and highest for out-of-phase targets. However, this pattern was reversed for abutting waveforms (see Fig. 7).
We believe the reversal in the pattern of target sensitivity, for targets abutting inducers in this, relative to earlier experiments, is due to participants being sensitive to points of high luminance contrast in abutting out-of-phase waveforms (where lightest sections of one waveform a but the darkest sections of the other, and vice versa) which do not exist in abutting in-phase waveforms (where lightest and darkest sections of each waveform are aligned). Given the size of targets (1 dva2) and the spatial frequency of waveforms (1 cycle/dva), these high contrast points are persistently present in out-of-phase waveforms that abut the side-edge of motion (Experiment 4), but are only intermittently present (twice a second) in earlier experiments at leading and trailing edges of motion.
In combination, the results of Experiments 1–4 are consistent with target sensitivity being modulated via a spatial summation that encompasses both the target and an inducing waveform. Evidence for this can be observed at leading and trailing edges of motion (Experiments 1 and 2), adjacent to non-directional flicker (Experiment 3), and at the side edge of motion (Experiment 4). According to this explanation, summation should not aid target sensitivity if the target and inducing waveforms sum to grey across a relatively small retinal expanse, say 0.2 dva – approximating the area of linear summation for high contrast drifting waveforms (see Anderson & Burr, 1991; but note that summation for low-contrast signals might spread across a greater retinal expanse – Sceniak et al., 1999). If, however, target/inducer phase-contingent modulations reflect the summation of a predictive pattern specific signal with physical input, we would expect the process to be measurable whenever one can clearly discern a moving pattern. We tested these propositions in Experiment 5.
7. Experiment 5 – Phase contingent sensitivity modulations when luminance sums to grey across a small retinal expanse
7.1. Methods
Details for Experiment 5 were as for Experiment 1, with the following exceptions. There were 4 participants, including the first two authors and 2 others who were naïve as to the purpose of the experiment. All had normal, or corrected to normal, visual acuity.
We ensured that the stimulus summed to grey across a small retinal expanse by splitting target and inducer waveforms into 11 strips. Each subtended 0.9 dva in width, and adjacent strips were phase reversed, creating a checker-board like pattern. This allowed us to investigate phase contingent modulations at leading and trailing edges of motion, with a stimulus that summed to grey across a small retinal expanse, but which was still clearly visible and in which direction could easily be discerned.
7.2. Results
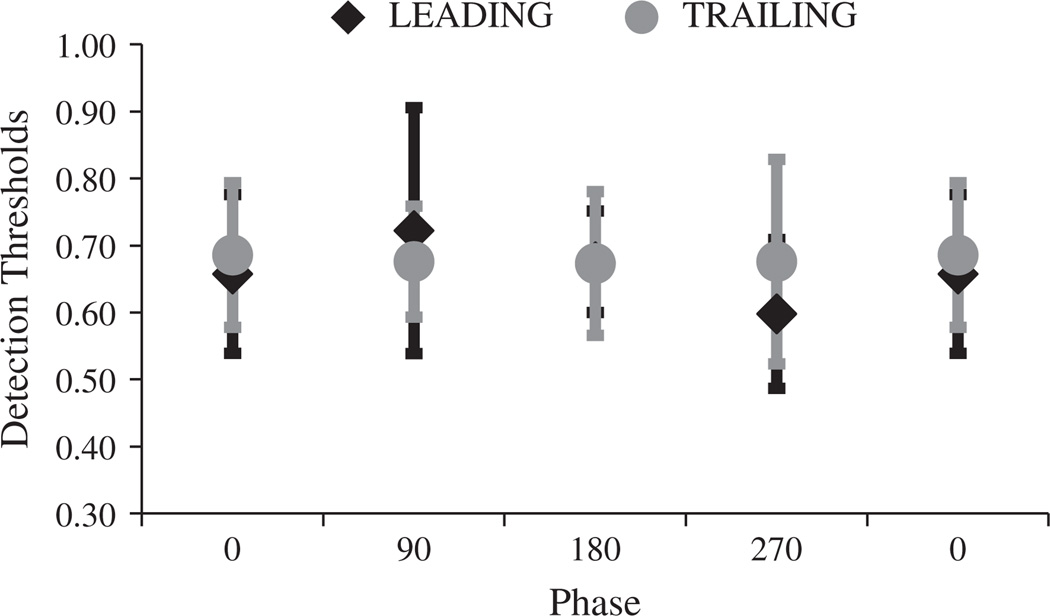
Logistic functions were fitted to individual distributions of correct target localisation as a function of target contrast, and 75% points were taken as estimates of the participants’ target detection threshold for that target-inducer phase relationship. Thresholds were determined for targets at leading and trailing edges of inducer motion for each of the 4 sampled phase relationships between inducer and target waveforms.
Experiment 4 results were markedly different from Experiment 1. A 2 (edge) × 4 (phase) repeated measures ANOVA revealed a non-significant interaction between phase and target position (F3,9 = 0.47, p = 0.71, ηp2 = 0.14). The main effects for target position (F1,3 = 0.52, p = 0.52, ηp2 = 0.15) and target/inducer phase (F3,9 = 0.18, p = 0.91, ηp2 = 0.06) was also non-significant. In sum, for this stimulus, there was no evidence of phase-contingent modulations of target sensitivity (see Fig. 9). In combination with the results of previous experiments, this suggests that target/inducer phase-contingent sensitivity modulations might depend on a spatial summation of physical signals, which is eliminated when those signals sum to grey across a small retinal expanse.
Fig. 9.
Results of Experiment 5. Target detection thresholds are plotted as a function of the phase relationship between target and inducing waveforms. Thresholds are plotted for targets at leading (black) and trailing (grey) edges of movement. Note that data for a phase relationship of 0° are plotted twice, to reflect the cyclical nature of phase relationships. Error bars depict ±1 SEM.
One prediction of the hypothesis that drifting motion causes the brain to form a perceptually explicit predictive signal at leading edges of motion is that it should be hard to detect an absence of signal at that location. Even if no physical stimulus is presented, participants should see one. If, instead, phase-contingent target-inducer modulations of sensitivity reflect a summation of physical inputs, there should be no such difficulty. We assessed this prediction in Experiment 6.
8. Experiment 6 – Sensitivity to an absence of signal at leading and trailing edges of motion
8.1. Methods
There were 5 participants, including the first two authors and 3 others who were naïve as to the purpose of the experiment. All had normal, or corrected to normal, visual acuity.
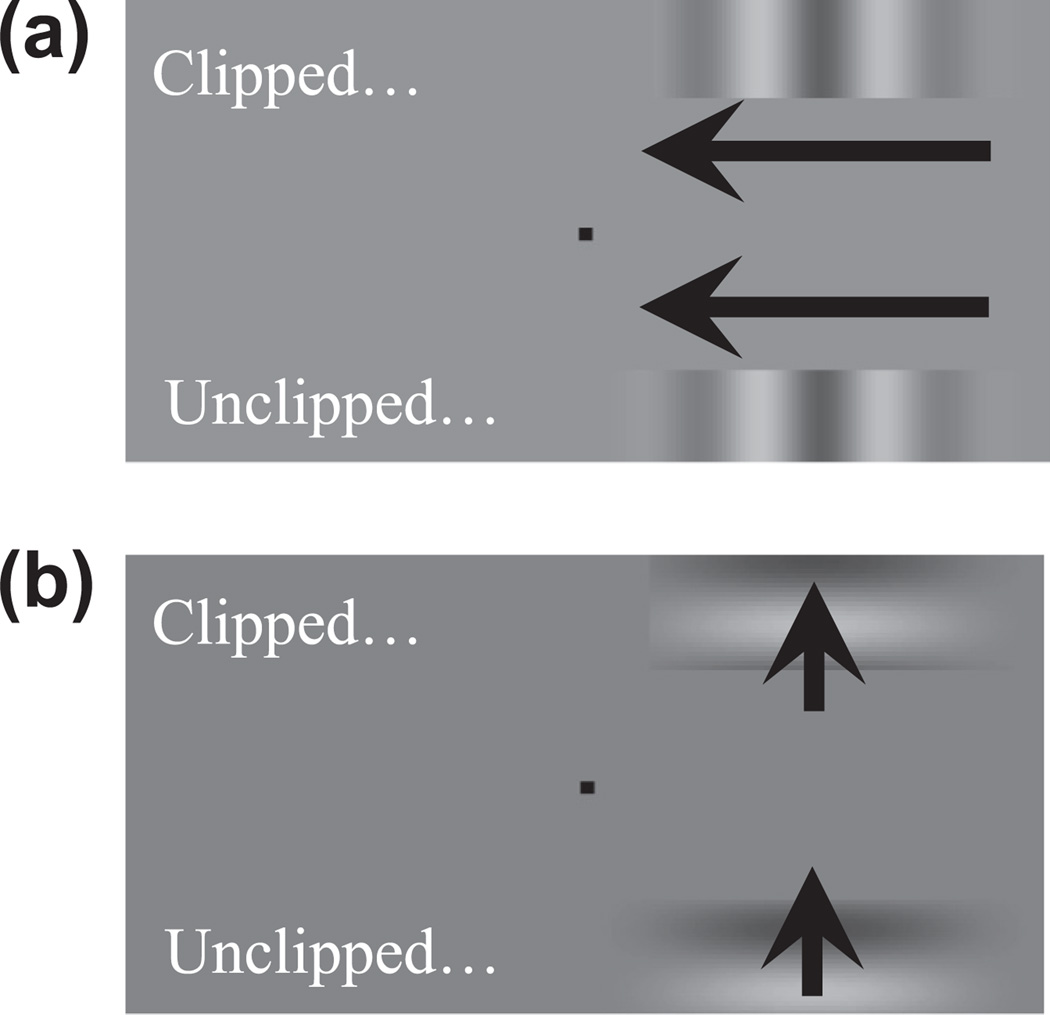
Stimuli consisted of 1d Gabors, a sinusoidal luminance-modulated waveform multiplied by a Guassian contrast envelope along the horizontal axis (see Fig. 10). The spatial frequency of waveforms was 1 cycle/dva and their height subtended 0.7 dva. The unclipped width of waveforms was 3.6 dva, which was also the width of the Guassian contrast envelope. These configurations were centred 1.44 dva above and below a central fixation point, and 1.8 dva to the left or right (determined at random on a trial-by-trial basis, see Fig. 10).
Fig. 10.
Depiction of 1d Gabor stimuli with vertical (a) and horizontal (b) waveforms, used to assess sensitivity to an absence of signal at leading and trailing edges, respectively (a) and beside (b) the direction of motion. On each trial one of the two Gabors was clipped (here the Gabors positioned above fixation) and participants had to identify which Gabor extended closer toward fixation.
On each trial one of the two Gabors was clipped at the edge nearest fixation, by an amount (0.29, 0.43, 0.58, 0.72, 0.86, 1.01 or 1.15 dva) that was varied during a block of trials according to the method of constant stimuli. In different blocks of trials waveforms were animated to generate 0.5, 1, 2.5, 5 or 10 Hz drift. Also in different blocks of trials, waveforms were either vertical or horizontal. For vertical waveforms drift direction was manipulated to place the clipped edge at either the leading or trailing edge of motion. For these blocks of trials each of the 7 magnitudes of clipping were presented 16 times at both the leading and trailing edges of motion – a total of 224 individual trials. For horizontal waveforms drift direction was either up or down, determined at random on a trial by-trial basis. These blocks consisted of 112 individual trials (each clipping magnitude sampled 16 times). Each participant completed 10 blocks of trials in a pseudo random order, one for each of the 5 TFs using vertical or horizontal waveforms. On each trial test presentations persisted until the participant indicated which Gabor, above or below fixation, had a clipped edge.
8.2. Results
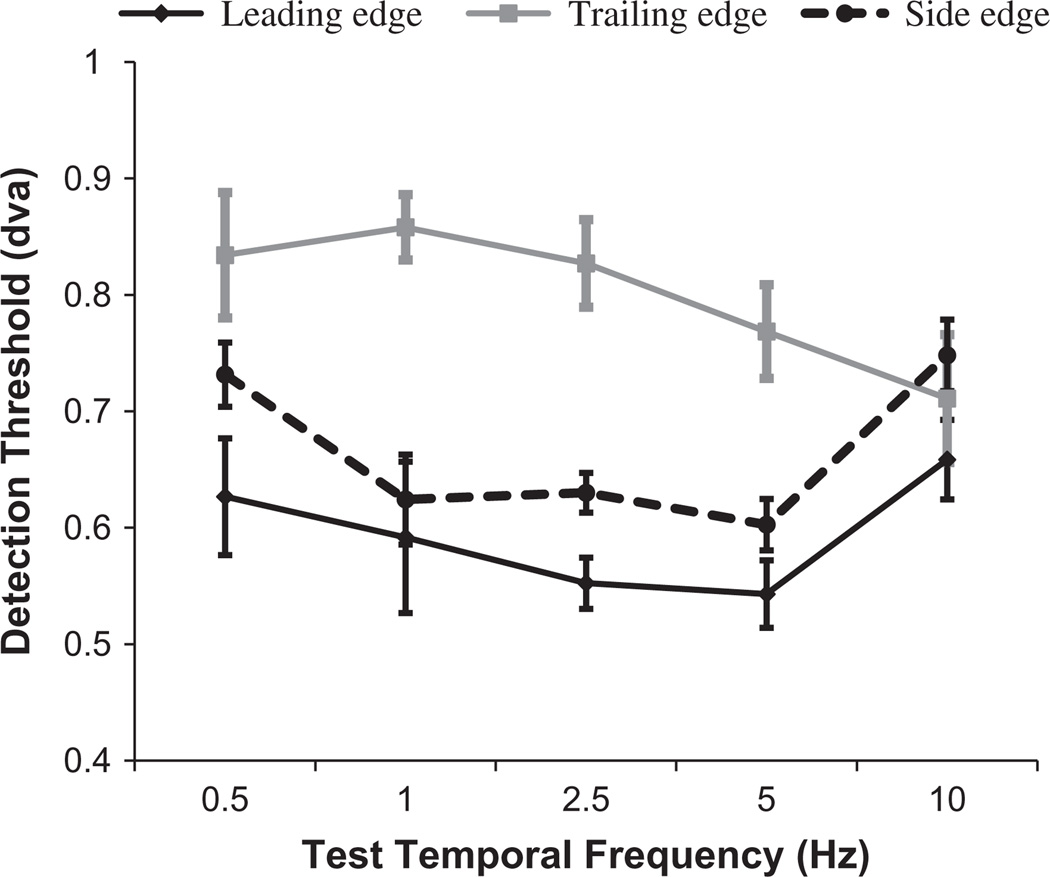
Logistic functions were fitted to individual distributions of correct target localisation as a function of clipping magnitude, and 75% points were taken as estimates of the participants’ spatial detection threshold for an absence of signal (the magnitude of clipping at which they could detect which test stimulus was clipped). Individual thresholds were determined for clipping at leading and trailing edges of motion in vertical waveforms, and for clipping at the side of motion in horizontal gratings, for each of the 5 sampled temporal frequencies.
The side edge condition can be thought of as a baseline for comparison with the leading and trailing edge conditions. For ease of comparison, we therefore conducted two repeated measures ANOVAS, comparing side edge data with leading and trailing edge data. Analysis involving leading edge data revealed a significant main effect of temporal frequency (F4,16 = 9.46, p < 0.001, ηp2 = 0.7), but there was no main effect of clipped edge position (F1,4 = 2.37, p = 0.2, ηp2 = 0.37) or interaction between temporal frequency and edge position (F4,16 = 0.49, p = 0.74, ηp2 = 0.11). These results show that while sensitivity to clipping (an absence of signal) varies as a function of temporal frequency (enhanced in these conditions for intermediate temporal frequencies), there was no other substantive difference between sensitivity to clipping at leading and side edges of motion.
The pattern of results for trailing edge data was markedly different. For the analysis involving trailing edge data, the main effects of temporal frequency (F4,16 = 2.5, p = 0.084, ηp2 = 0.38) and clipped edge position (F1,4 = 7.1, p = 0.056, ηp2 = 0.64) could only be described as marginally significant. This is explained by the robust interaction between temporal frequency and edge position (F4,16 = 4.02, p = 0.019, ηp2 = 0.5). This interaction ensues because while sensitivity to clipping at trailing and side edges of motion was similar at temporal frequencies of 0.5 and 10 Hz, sensitivity for intermediate temporal frequencies was markedly different, worse at trailing edges of motion.
In combination, these results suggest that the remarkable observation concerning sensitivity at leading and trailing edges of motion, relative to sensitivity to one side of motion, is a relative insensitivity at trailing edges of motion at intermediate temporal frequencies. This is consistent with a suppressive interaction at trailing edges of motion, but is fundamentally inconsistent with there being a perceptually explicit signal at leading edges of motion.
9. General discussion
Our data suggest that target sensitivity adjacent to motion is modulated, not because of a perceptually explicit predictive signal (Roach, McGraw, & Johnston, 2011), but because signals concerning proximate physical inputs summate. This process seems to be reduced at trailing edges of motion, relative to leading and side edges. Our evidence is as follows.
First, we found phase-contingent modulations of sensitivity at both leading and trailing edges of motion (see Figs. 4 and 5). While this is consistent with a summation of signals that relate to proximate physical inputs, we would not expect a perceptually explicit predictive signal to be extrapolated in a direction opposite motion perception. Second, we found target/inducer phase-contingent sensitivity modulations using a non-directional flicker (see Fig. 6), for which we would not anticipate a directional prediction. We also found evidence for target/inducer phase-contingent sensitivity modulations at the side edge of motion, where no predictive signal would be expected (although this depended on there being a small gap between target and inducer, see Fig. 7). However, we did not find evidence for target/inducer phase-contingent sensitivity modulations using a luminance-defined motion which sums to grey across a small retinal expanse (see Figs. 8 and 9). Our results are consistent with target sensitivity being modulated by a spatial summation of signals relating to proximate physical inputs, but are at odds with the idea that retinal motion generates perceptually explicit predictive signals selectively at leading edges of motion.
Fig. 6.
Results of Experiment 3 – Target detection adjacent to flicker. Target detection thresholds are plotted as a function of target/inducer phase relationship for flickering target and inducing waveforms. Error bars depict ±1 SEM between 8 individual threshold estimates.
Fig. 8.
Experiment 5 stimuli. A fixation cross hair was positioned in the centre of the display. A low-contrast target was presented either to the left or right of fixation (here the right). High contrast inducing checkerboard patterns were positioned either above or below fixation (here above), with one inducer abutting the target. Both the target and inducing waveforms contained movement drifting in the same direction at the same rate. Inducing motion could be toward the target position (left, leading edge conditions) or away (right, trailing edge conditions).
We would like to point out that the drifting sinusoidal checkerboard stimulus used in Experiment 5 was clearly visible and its direction of drift was unambiguous. Consequently, we do not believe the lack of phase-contingency for this stimulus can be attributed to unstable fixation or to a weak motion signal. Sufficient retinal slip from unstable fixation might reduce the visibility of the stimulus, or make its direction indiscernible, but this did not happen in our experiment.
It should also be noted that the results of our Experiment 5 are in accord with those of a Supplemental experiment reported by Roach, McGraw, and Johnston (2011). They used a 2nd order stimulus, a contrast modulation of white noise, to investigate phase-contingent modulations of target sensitivity, and found no evidence for this happening. An important distinction between their 2nd order stimulus and the sinusoidal checker-board we used in Experiment 5 is that our stimulus generated a luminance-defined 1st order motion signal (see Georgeson & Scott-Samuel, 2000). Our results thus demonstrate that 1st order motion is not sufficient to generate a phase contingent modulation of target sensitivity at leading edges of motion. The two stimuli in question were somewhat similar, though, in that both sum to grey across a small spatial extent. Thus the results of both experiments are consistent with a non-predictive spatial summation of physical signals, which is eliminated when stimuli sum to grey across a small retinal expanse.
Perhaps our strongest evidence concerns sensitivity to an absence of signal. If retinal motion causes the visual system to generate perceptually explicit predictive signals, it should be harder to detect an absence of signal at leading edges of motion than at trailing (or side) edges. We, however, found no such evidence. Sensitivity to an absence of signal tended to be higher at leading, relative to side, edges of motion (see Fig. 11). This contrasts with sensitivity at trailing edges, which was reduced relative to sensitivity at side edges for intermediate temporal frequencies.
Fig. 11.
Results of Experiment 6. Spatial clipping detection thresholds are plotted as a function of test temporal frequency. Thresholds are plotted for clipping at leading (black) and trailing (grey) edges of movement in vertical waveforms, and for clipping beside the direction of motion in horizontal waveforms (dotted black line). Error bars depict ±1 SEM between 5 individual threshold estimates.
A summation of sinusoidal modulations of luminance contrast across space is predictable based on the characteristics of V1 simple cells, which are phase sensitive and have spatially extended receptive fields (Ringach, 2002; Hubel & Wiesel, 1959). From this perspective it would not be the presence of spatial summation for sinusoidal waveforms that is remarkable, but its absence. Our data are broadly consistent with this premise. We have observed evidence for target-inducer phase-contingent sensitivity modulations at both leading and trailing edges of motion, for flickering inputs, and for targets proximate to the side edge of motion. Phase-contingent sensitivity modulations for dynamic stimuli would thus seem to be more a rule than an exceptional situation at leading edges of motion. The fact that such modulations are less pronounced at trailing edges of motion could result from a process of spatial summation being modulated via a directionally selective suppression of neural gain at trailing edges of motion (see Arnold, Thompson, & Johnston, 2007; Whitney et al., 2003). This would involve a direction-tuned modulation of neural responses to physical inputs at trailing edges of motion, rather than a perceptually explicit predictive signal that causes people to see signals where none exist.
Acknowledgment
This research was supported by an Australian Research Council Discovery Project Grant and Fellowship awarded to D.H.A.
References
- Anderson SJ, Burr D. Spatial summation properties of directionally selective mechanisms in human vision. Journal of the Optical Society of America A: Optics, Image Science, and Vision. 1991;8:1330–1339. doi: 10.1364/josaa.8.001330. [DOI] [PubMed] [Google Scholar]
- Arnold DH, Clifford CW. Determinants of asynchronous processing in vision. Proceedings of the Royal Society of London. Series B: Biological Sciences. 2002;269:579–583. doi: 10.1098/rspb.2001.1913. [DOI] [PMC free article] [PubMed] [Google Scholar]
- Arnold DH, Clifford CW, Wenderoth P. Asynchronous processing in vision: Color leads motion. Current Biology. 2001;11:596–600. doi: 10.1016/s0960-9822(01)00156-7. [DOI] [PubMed] [Google Scholar]
- Arnold DH, Thompson M, Johnston A. Motion and position coding. Vision Research. 2007;47:2403–2410. doi: 10.1016/j.visres.2007.04.025. [DOI] [PubMed] [Google Scholar]
- Bartels A, Zeki S. The theory of multistage integration in the visual brain. Proceedings of the Royal Society of London. Series B: Biological Sciences. 1998;265:2327–2332. doi: 10.1098/rspb.1998.0579. [DOI] [PMC free article] [PubMed] [Google Scholar]
- de Rugy A, Marinovic W, Wallis G. Neural prediction of complex accelerations for object interception. Journal of Neurophysiology. 2012;107:766–771. doi: 10.1152/jn.00854.2011. [DOI] [PubMed] [Google Scholar]
- De Valois RL, De Valois KK. Vernier acuity with stationary moving Gabors. Vision Research. 1991;31:1619–1626. doi: 10.1016/0042-6989(91)90138-u. [DOI] [PubMed] [Google Scholar]
- Diaz G, Cooper J, Rothkopf C, Hayhoe M. Saccades to future ball location reveal memory-based prediction in a virtual-reality interception task. Journal of Vision. 2013;13:1–5. doi: 10.1167/13.1.20. [DOI] [PMC free article] [PubMed] [Google Scholar]
- Georgeson M, Scott-Samuel N. Spatial resolution and receptive field height of motion sensors in human vision. Vision Research. 2000;40:745–758. doi: 10.1016/s0042-6989(99)00219-9. [DOI] [PubMed] [Google Scholar]
- Hubel DH, Wiesel TN. 148, 574–591: Receptive fields of single neurones in the cat’s striate cortex. Journal of Physiology. 1959;587:2721–2732. doi: 10.1113/jphysiol.2009.174151. [DOI] [PMC free article] [PubMed] [Google Scholar]
- Marinovic W, Arnold DH. Separable temporal metrics for time perception and anticipatory actions. Proceedings of the Royal Society of London Series B: Biological Sciences. 2012;279:854–859. doi: 10.1098/rspb.2011.1598. [DOI] [PMC free article] [PubMed] [Google Scholar]
- Marinovic W, Arnold DH. An illusory distortion of moving form driven by motion deblurring. Vision Reserach. 2013;88:47–54. doi: 10.1016/j.visres.2013.05.009. [DOI] [PubMed] [Google Scholar]
- Marinovic W, Plooy AM, Arnold DH. The influence of visual motion on interceptive actions and perception. Vision Research. 2012;60:73–78. doi: 10.1016/j.visres.2012.03.010. [DOI] [PubMed] [Google Scholar]
- Maus GW, Nijhawan R. Motion extrapolation into the blind spot. Psychologivcal Science. 2009;19:1087–1091. doi: 10.1111/j.1467-9280.2008.02205.x. [DOI] [PubMed] [Google Scholar]
- McIntyre J, Zago M, Berthoz A, Lacquaniti F. Does the brain model Newton’s laws? Nature Neuroscience. 2001;4:693–694. doi: 10.1038/89477. [DOI] [PubMed] [Google Scholar]
- Meese TS. Spatially extensive summation of contrast energy is revealed by contrast detection of micro-pattern textures. Journal of Vision. 2010;10(8):14. doi: 10.1167/10.8.14. [DOI] [PubMed] [Google Scholar]
- Moutoussis K, Zeki S. A direct demonstration of perceptual asynchrony in vision. Proceedings of the Royal Society of London. Series B: Biological Sciences. 1997;264:393–399. doi: 10.1098/rspb.1997.0056. [DOI] [PMC free article] [PubMed] [Google Scholar]
- Nijhawan R. Motion extrapolation in catching. Nature. 1994;370:256–257. doi: 10.1038/370256b0. [DOI] [PubMed] [Google Scholar]
- Nijhawan R. Visual prediction: Psychophysics and neurophysiology of compensation for time delays. Behavioral and Brain Sciences. 2008;31:179–198. doi: 10.1017/S0140525X08003804. discussion 198–239. [DOI] [PubMed] [Google Scholar]
- Nijhawan R, Wu S. Compensating time delays with neural predictions: Are predictions sensory or motor? Philosophical Transactions of the Royal Society A: Mathematical, Physical and Engineering Sciences. 2009;367:1063–1078. doi: 10.1098/rsta.2008.0270. [DOI] [PubMed] [Google Scholar]
- Ramachandran VS, Anstis SM. Illusory displacement of equiluminous kinetic edges. Perception. 1990;19:611–616. doi: 10.1068/p190611. [DOI] [PubMed] [Google Scholar]
- Ringach DL. Spatial structure and symmetry of simple-cell receptive fields in macaque primary visual cortex. Journal of Neurophysiology. 2002;88:455–463. doi: 10.1152/jn.2002.88.1.455. [DOI] [PubMed] [Google Scholar]
- Roach NW, McGraw PV, Johnston A. Visual motion induces a forward prediction of spatial pattern. Current Biology. 2011;21:740–745. doi: 10.1016/j.cub.2011.03.031. [DOI] [PMC free article] [PubMed] [Google Scholar]
- Roufs JAJ. Perception lag as a function of stimulus luminance. Vision Research. 1963;3:81–89. [Google Scholar]
- Sceniak MP, Ringach DL, Hawken MJ, Shapley R. Contrast’s effect on spatial summation by macaque V1 neurons. Nature Neuroscience. 1999;2:733–739. doi: 10.1038/11197. [DOI] [PubMed] [Google Scholar]
- Whitney D. The influence of visual motion on perceived position. Trends in Cognitive Sciences. 2002;6:211–216. doi: 10.1016/s1364-6613(02)01887-9. [DOI] [PMC free article] [PubMed] [Google Scholar]
- Whitney D, Goltz HC, Thomas CG, Gati JS, Menon RS, Goodale MA. Flexible retinotopy: Motion-dependent position coding in the visual cortex. Science. 2003;302:878–881. doi: 10.1126/science.1087839. [DOI] [PMC free article] [PubMed] [Google Scholar]
- Whitney D, Murakami I. Latency difference, not spatial extrapolation. Nature Neuroscience. 1998;1:656–657. doi: 10.1038/3659. [DOI] [PubMed] [Google Scholar]
- Wilson JA, Anstis SM. Visual delay as a function of luminance. American Journal of Psychology. 1969;82:350–358. [PubMed] [Google Scholar]


