Abstract
The aim of this study was to establish a quantitative standard for the cellular composition in seminiferous tubules at each stage of spermatogenesis in the mouse testis, and thereby evaluate abnormalities in the infertile mouse testis. We applied a combination of lectin histochemistry for acrosomes and immunohistochemistry for various specific cell markers, both of which were visualized with fluorescence, on paraffin sections of the testis. We first examined seminiferous tubules from normal mice and counted the number of each cell type at each stage of spermatogenesis. We then examined seminiferous tubules from genetically modified mice deficient (-/-) for one of the cell adhesion molecules, nectin-2 or nectin-3, and compared the number of each cell type at each stage of spermatogenesis with the corresponding value in normal mice. In both nectin-2-/- and nectin-3-/- mice, which are infertile despite the apparently normal morphology of the seminiferous epithelia, we measured a progressive loss in the later-step spermatids, with significantly lower numbers of step 11–16 spermatids in nectin-3-/- mice and step 15–16 spermatids in nectin-2-/- mice as compared with that in normal control mice. The present study demonstrated that a quantitative analysis of cellular compositions at different stages in seminiferous tubules was useful for evaluating abnormalities in spermatogenesis.
Keywords: spermatogenesis, stage, fluorescence, lectin, immunohistochemistry, cell adhesion molecule
Introduction
Spermatogenesis is a continuous process in the seminiferous tubules from undifferentiated spermatogonia to mature spermatozoa through the mitosis of spermatogonia, meiosis of spermatocytes, and maturation of spermatids (Russell et al. 1990; Kerr et al. 2006; Hermo et al. 2010). Spermatogenesis is routinely divided into 12 stages in mice on the basis of changes in the morphology of the acrosome and nucleus, which is determined using periodic acid-Schiff and hematoxylin (PAS-H) staining (Oakberg 1956; Ahmed and de Rooij 2009; Meistrich and Hess 2013). A section of the mouse testis contains many cross sections of seminiferous tubules, the specific stages of which can be unequivocally determined; however, one tubule section sometimes contains two adjacent stages because of the continuous process of spermatogenesis. Once the stage is determined, all cells present in that section of the seminiferous tubule are potentially identifiable based on the specific combination of different types of spermatogenic cells in each stage (Meistrich et al. 2013).
An earlier study on the mouse testis (Oakberg 1956), using PAS-H staining of 5-µm-thick paraffin sections, counted the numbers of type A, intermediate, and type B spermatogonia, spermatocytes in the preleptotene, leptotene, zygotene, pachytene, and diplotene phases of meiosis, and spermatids within individual seminiferous tubules at different stages, but never reported the numbers of Sertoli cells or spermatids in the different steps. Type A spermatogonia are further classified into several subtypes according to their levels of differentiation, namely, undifferentiated A single (As), A paired (Apr), and A aligned (Aal) spermatogonia, of which As and Apr are considered to involve the spermatogenic stem cell population, and differentiated A1-A4 spermatogonia (de Rooij et al. 2000; Chiarini-Garcia and Russell 2001). However, distinguishing these different subtypes of type A spermatogonia requires skillful observations of semi-thin plastic sections with high-resolution light microscopy, and is not applicable for routine laboratory analyses.
To the best of our knowledge, few studies after that by Oakberg (1956) have performed a quantitative analysis of the cellular composition in mouse seminiferous tubules by counting the numbers of different types of spermatogenic cells in testis sections. The reason for the lack of quantitative studies may be that, with the conventional method using PAS-H staining (Oakberg 1956; Ahmed and de Rooij 2009; Meistrich and Hess 2013) of paraffin sections, it is not necessarily easy to 1) determine the stages of seminiferous tubules precisely, because sometimes acrosomal staining with PAS is not conspicuous; 2) identify different types of spermatogenic cells based solely on morphological features; or 3) count the numbers of different cell types, because excess information from the cytoplasmic stain interferes with nuclear counting. Recent progress in lectin histochemistry and immunohistochemistry (IHC) using fluorescent dye-conjugated molecules appears to have solved such problems. For example, the lectin peanut agglutinin (PNA) is currently being used to visualize the acrosomes of spermatids (Lee and Damjanov 1984; Arya and Vanha-Perttula 1986) and, when combined with nuclear staining with DNA-binding fluorescent dyes such as 4’,6-diamidino-2-phenylindole (DAPI), the stages and cell numbers can be easily determined. Furthermore, antibodies against zinc finger- and BTB domain-containing 16 (ZBTB16) (Buaas et al. 2004; Meistrich and Hess 2013), synaptonemal complex protein 3 (SYCP3) (Lammers et al. 1994), and GATA binding protein 4 (GATA4) (Imai et al. 2004) mainly visualize the nuclei of type A spermatogonia, spermatocytes, and Sertoli cells, respectively, thereby contributing to the precise determination of cell populations in seminiferous tubules. In the present study, using these fluorescence histochemical techniques, we re-evaluated the cellular composition of seminiferous tubules in a normal mouse testis by counting the numbers of Sertoli cells and spermatogenic cell types, including spermatids at different steps, in each stage of spermatogenesis.
Many genetically modified and mutant mouse strains with male infertility have recently been reported (de Rooij and de Boer 2003; Matzuk and Lamb 2008). The histological features of the seminiferous epithelia in these mice vary markedly, from the absence of any spermatogenic cells to an apparently normal cell composition. However, such features have been mainly described in a qualitative manner in terms of the shape of spermatogenic cells, and few quantitative analyses have been performed. This led us to perform a quantitative analysis of the cellular composition in each stage of spermatogenesis in the seminiferous tubules of infertile mice and compare it with the standard values obtained in normal control mice. Nectin-2 and nectin-3 are the cell adhesion molecules localized in the membranes of Sertoli cells and elongating spermatids, respectively, and undergo heterophilic binding with each other (Ozaki-Kuroda et al. 2002; Takai et al. 2008). In the present study, we analyzed the seminiferous tubules of nectin-2 and nectin-3 knockout mice, in which spermatogenesis is known to progress to the final step, but the nuclei of elongating spermatids are irregular in shape and lead to male infertility (Mueller et al. 2003; Inagaki et al. 2006).
Materials & Methods
Animals
The present animal study was specifically approved by Kanazawa University (approval number: AP-132753) and conducted in accordance with the Guidelines for the Care and Use of Laboratory Animals in Kanazawa University. C57BL/6 strain male mice (normal mice) were purchased from Nippon SLC, Inc. (Hamamatsu, Japan). Nectin-2-deficient and nectin-3-deficient 129/Sv; C57BL/6 mixed background mice (nectin-2-/- and nectin-3-/- mice, respectively) were generated as described previously (Mueller et al. 2003; Inagaki et al. 2006). All animals were reared under standard 12 hr light/12 hr dark laboratory conditions with free access to standard food and water, and used at the age of 10 weeks. A total of 9 mice (3 for each of control, nectin-2-/- and nectin-3-/- mouse strain) were used in the present study.
Tissue Preparation
Mice were anesthetized with an intraperitoneal injection of pentobarbital sodium (100 mg/kg). Saline was initially perfused from the left ventricle to clear the blood, followed by 4% paraformaldehyde in 0.1 M phosphate buffer (pH 7.4). The testes were then dissected out and further fixed by immersion in the same fixative for 4 hr at 4C. The specimens were dehydrated in a graded ethanol series, embedded in paraffin, cut into 1-, 3-, and 5-μm-thick sections using a microtome, and mounted onto glass slides. After deparaffinization, the sections were subjected to PAS-H staining, PNA lectin histochemistry, and IHC.
PAS-H Staining
Deparaffinized and rehydrated sections were immersed in 0.5% periodic acid solution for 10 min and rinsed in running tap water and several changes of distilled water. Sections were immersed in Schiff’s reagent (Merck; Darmstadt, Germany) for 15 min and then treated with sulfur water (12 ml sodium bisulfite solution (10%), 10 ml hydrochloric acid (1 N), and 200 ml distilled water) three times for 3 min each. After rinsing in running tap water and several changes of distilled water, the sections were stained with hematoxylin.
PNA Lectin Histochemistry
Deparaffinized and rehydrated sections were immersed in 20 mM Tris-HCl buffer (pH 9.0) and heated at 95C for 15 min using an autoclave apparatus (ACV-3167N, Asahi Techno Glass; Funabashi, Japan). After cooling to room temperature, the sections were washed in PBS and incubated with the Alexa Fluor 488 conjugate of lectin PNA (1:400, Molecular Probes; Eugene, OR) for 30 min at room temperature to visualize the acrosomes, then counterstained with DAPI (300 nM; Molecular Probes).
Antibodies and IHC
Rabbit anti-ZBTB16 (1:200 dilution; HPA001499, Sigma-Aldrich; St. Louis, MO), rabbit anti-SYCP3 (1:400; ab15093, Abcam; Cambridge, UK), goat anti-GATA4 (1:50; sc-1237, Santa Cruz Biotechnology; Dallas, TX), rat anti-Nectin-2 (1:100; ab16912, Abcam), and rabbit anti-nectin-3 (1:100; ab63931, Abcam) polyclonal antibodies were used. Deparaffinized and rehydrated sections were immersed in 20 mM Tris-HCl buffer (pH 9.0) and heated at 95C for 15 min using the autoclave apparatus for antigen retrieval. After cooling to room temperature, the sections were washed in PBS and treated with 1% skim milk/PBS for 1 hr at room temperature to prevent non-specific antibody binding and then incubated overnight at 4C with the indicated primary antibodies. After washing in PBS, the sections were incubated with the appropriate fluorescent dye-conjugated secondary antibody (Alexa Fluor 594- or 488-conjugated donkey anti-rabbit, -rat, or -goat IgG antibodies; 1:400; Molecular Probes) for 1 hr at room temperature. In double IHC, the sections were incubated with a mixture of goat anti-GATA4 and rabbit anti-ZBTB16 or anti-SYCP3 primary antibodies followed by a mixture of fluorescent anti-goat and anti-rabbit IgG secondary antibodies.
For the combination of lectin histochemistry and IHC, sections were first treated with IHC for cell markers and then with PNA lectin histochemistry for acrosomes. The sections were then counterstained with DAPI, mounted on glass slides with Fluoromount (Diagnostic BioSystems, Pleasanton, CA), and examined with a fluorescence microscope (BX50/BX-FLA; Olympus, Tokyo, Japan) using filters passing blue, green and red emissions. Where necessary, Fluoromount was removed and the sections were washed and stained with hematoxylin and eosin (HE).
Cell Quantification Procedures
Cell quantification studies were performed to obtain the absolute numbers of different cell types per section of seminiferous tubule at each stage. In every single testis from normal, nectin 2-/-, or nectin 3-/- mice (n=3 each group), two portions, separated by a distance of more than 100 μm, were selected, and two 3-μm-thick serial sections were cut at each portion. One of the serial sections from each portion was double-immunostained for GATA4 and ZBTB16, and the other for GATA4 and SYCP3. Thereafter, all four sections for each testis were stained with PNA-lectin histochemistry and DAPI, and observed at a 400× total magnification using a 40× objective lens with a numerical aperture of 0.85. In all sections, the seminiferous tubules that were cut in orthogonal transverse sections were selected, and the images obtained at different wavelengths were overlapped using Photoshop CS6 software (Adobe Systems, Inc.; Mountain View, CA). In all seminiferous tubules, the stages of spermatogenesis were determined by the shape of acrosomes according to the known criteria (Oakberg 1956; Ahmed et al. 2009; Meistrich et al. 2013), and the different cell types were identified based on the shape and size of nuclei as well as chromatin patterns and marker immunoreactivity in the nuclei. Among the two pairs of serial sections of the seminiferous tubules, the sections immunostained for ZBTB16 were used to analyze stages I–VI, and those immunostained for SYCP3 were used to analyze stages VII–XII. The numbers of Sertoli cells and all types of spermatogenic cells per seminiferous tubule were counted using ImageJ software (NIH; Bethesda, MD; http://imagej.nih.gov/ij/).
Statistical Analysis
The numbers of specific cell types per seminiferous tubule section are presented as the mean ± standard deviation (SD). A comparison of values among different stages within a single testis from a representative normal mouse was performed with a one-way analysis of variance (ANOVA) followed by Scheffe’s F test, and differences with p<0.01 were considered significant. A comparison of values in the same stage among testes from control, nectin-2-/-, and nectin-3-/- mice (n=3) was performed with a one-way ANOVA followed by Bonferroni’s post-hoc test, and differences with p<0.05 were considered significant.
Results
Optimal Section Thickness
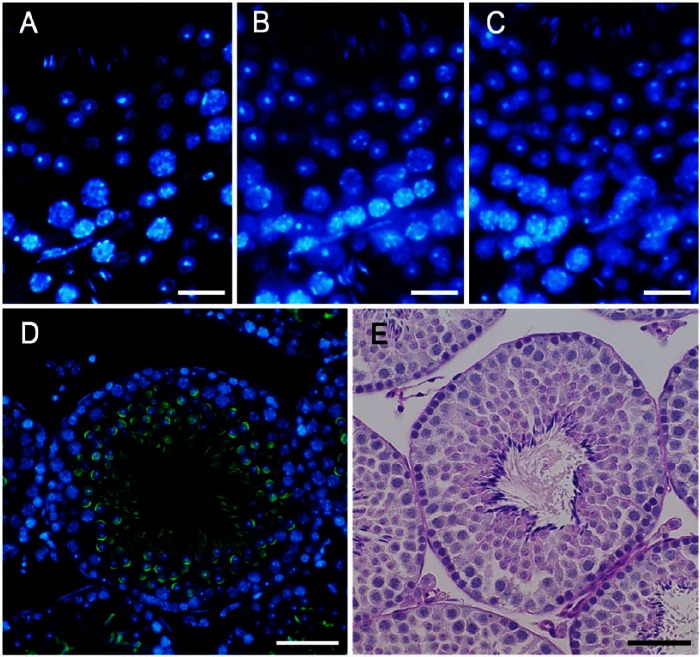
To determine the optimal conditions for quantitative analysis, we prepared serial sections of the normal mouse testis with different thicknesses of 1, 3 and 5 μm, stained the cell nuclei with DAPI, and compared images of the same single seminiferous tubule at 400× magnification (Fig. 1A–1C). In the 1-μm and 3-μm-thick sections, almost all cell nuclei were in focus, whereas some of the nuclei of elongating spermatids in the 5-μm-thick sections were out of focus and difficult to recognize, suggesting that the nuclei of elongating spermatids were small enough to be located at various depths within the sections. On the other hand, it was difficult to determine whether to count some of the larger nuclei of spermatocytes in the 1-μm-thick sections because of their very small size, suggesting that they may represent nuclei cut at edges. Taking into consideration that the calculated depth of focus for the present observations was ±1.20 µm (for blue fluorescence), and that consistently preparing 1-µm-thick paraffin sections was technically difficult, we adopted 3 μm as the thickness of sections and observed them at 400× magnification in subsequent quantitative analyses.
Figure 1.
Sections of the seminiferous epithelium (presumably stage VII or VIII) taken at 1 µm (A), 3 µm (B) and 5 µm (C) in thickness and stained with DAPI. Stage VIII seminiferous tubules shown after fluorescence (D) and periodic acid-Schiff/hematoxylin (PAS-H; E) staining. Acrosomes were stained with PNA lectin histochemistry (green; D) or PAS (E), and nuclei were stained with DAPI (blue; D) or hematoxylin (E). Scale, 15 μm (A–C), 30 μm (D, E).
Determination of Stages in Seminiferous Tubules
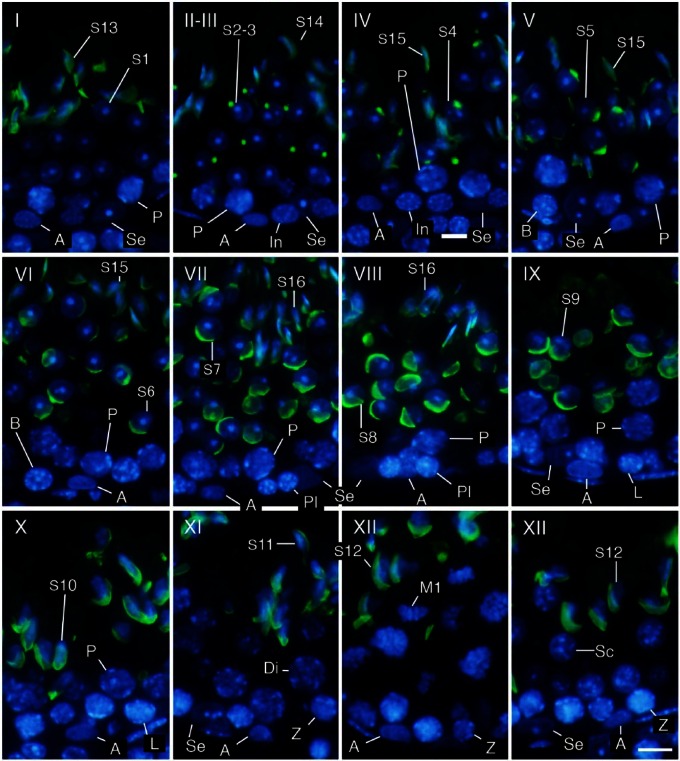
Using only DAPI staining of nuclei, it was possible to roughly distinguish different cell populations in the seminiferous tubules based on the position, size, and shape of the nuclei as well as the appearance of chromatin in the nuclei, and thereby determine the stage of the seminiferous tubules based on the patterns of combinations of these cell populations (Meistrich and Hess 2013). Determining the stages became markedly easier and more reliable with acrosome staining of spermatids. In the present study, the acrosomes of spermatids at various steps were visualized with PNA lectin histochemistry in the same patterns as in those visualized with PAS-H staining, but more conspicuously than the latter (Fig. 1D, 1E). The 12 stages of spermatogenesis were then determined using the combination of PNA lectin histochemistry for acrosomes and DAPI staining for chromatin in the nuclei, according to the established criteria of stages based on the position, size, and shape of acrosomes (Fig. 2). Once the stages were determined, the identification of the cell populations became easier because the patterns of combinations of different types of spermatogenic cells in a particular stage had been established (Oakberg 1956; Ahmed and de Rooij 2009; Meistrich and Hess 2013). For example, intermediate spermatogonia only exist in stages II-III to IV and type B spermatogonia in stages V and VI, whereas type A spermatogonia exist in almost all stages. They were distinguishable from each other due to the size and shape of the nuclei and the pattern of the nucleolus and heterochromatin in the nuclei. However, it was sometimes difficult to accurately differentiate the former from the latter in stages in which type A spermatogonia co-existed with intermediate or type B spermatogonia. Although the round and elongating spermatids (steps 1–12) were distinguishable from co-existing spermatocytes with the presence of PNA lectin-stained acrosomes, ascertaining cell type among the earlier spermatocytes, spermatogonia, and Sertoli cells, which co-existed in contact with the basement membrane, was difficult when based solely on these aforementioned parameters.
Figure 2.
Determination of stages (I–XII) and identification of cell types. Three-µm-thick sections were stained in the nuclei with DAPI (blue) and in the acrosomes with PNA lectin histochemistry (green). Se, Sertoli cells; A, type A spermatogonia; In, intermediate spermatogonia; B, type B spermatogonia; Pl, preleptotene spermatocytes; L, leptotene spermatocytes; Z, zygotene spermatocytes; P, pachytene spermatocytes; Di, diplotene spermatocytes; M1, spermatocytes undergoing the first meiotic division; Sc, secondary spermatocytes; S1-16, step 1-16 spermatids. Scale, 10 μm.
Identification of Cell Populations in Seminiferous Tubules
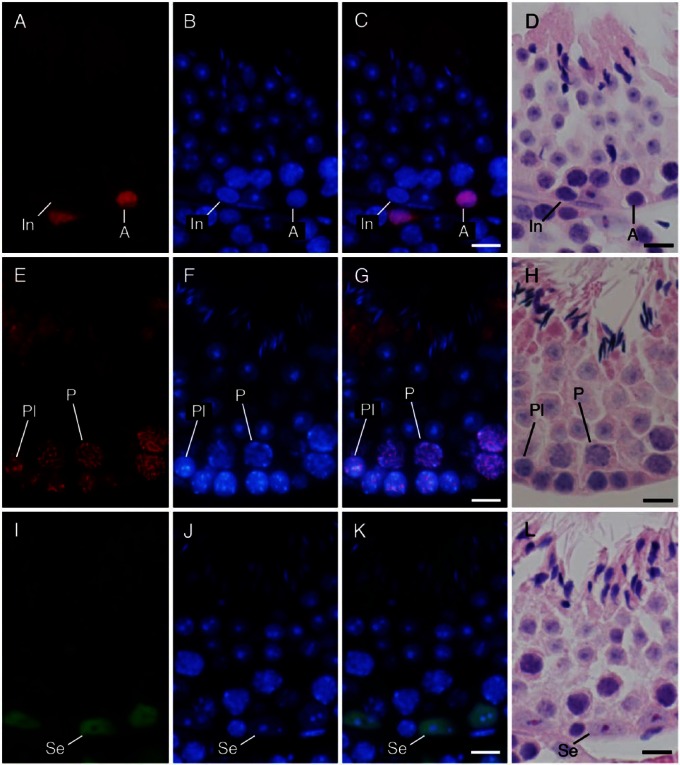
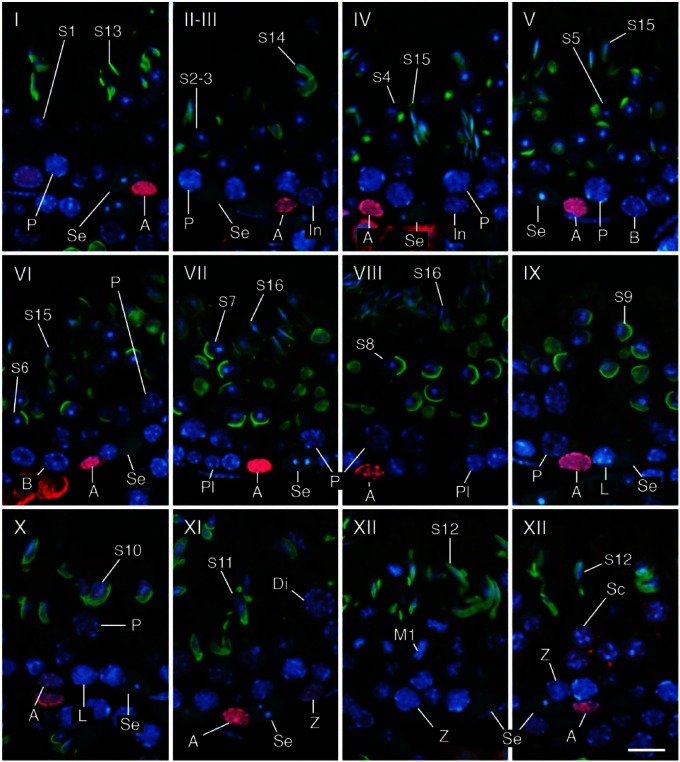
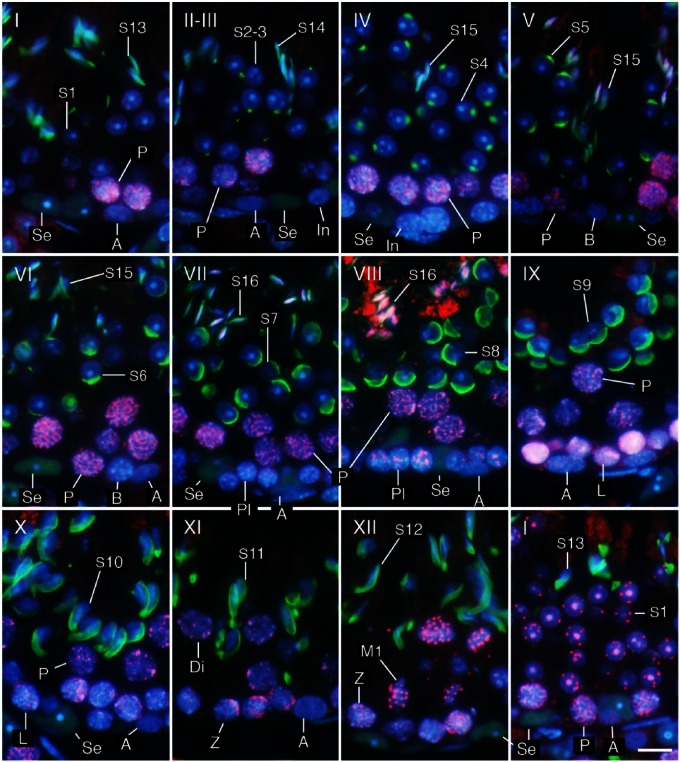
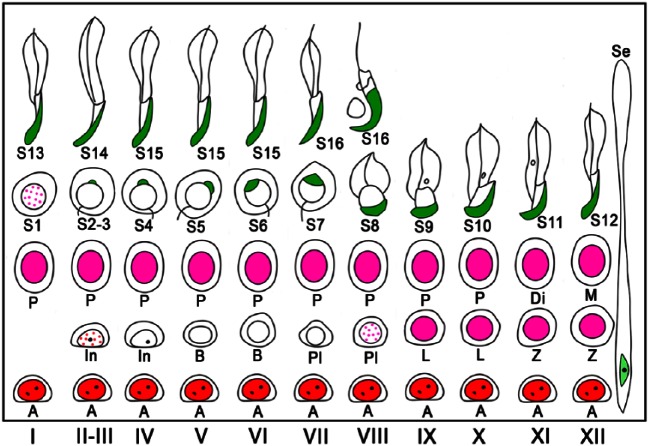
To simplify the identification of cell populations and improve the reliability of the assay, we performed IHC using antibodies against specific cell markers and examined the immunopositive cell types known to be present in each stage of spermatogenesis. We confirmed that immunoreactivities for ZBTB16, SYCP3, and GATA4 were generally localized in the nuclei of type A spermatogonia, spermatocytes, and Sertoli cells, respectively, by comparing fluorescence images with hematoxylin and eosin (HE)-stained images (Fig. 3). We further analyzed sections of seminiferous tubules in different stages of spermatogenesis that were double-immunostained for either GATA4 and ZBTB16 or GATA4 and SYCP3, in combination with PNA lectin histochemistry for acrosomes and DAPI staining for nuclei (Figs. 4, 5). Although both PNA and anti-GATA4 antibody were conjugated with Alexa Fluor 488, thus yielding the same green fluorescence, there was no possibility of their cross reaction, because PNA does not stain Sertoli cell nuclei (Fig. 2), and anti-GATA4 antibody does not stain spermatid acrosomes (Fig. 3). ZBTB16 was localized in the nuclei of type A spermatogonia in all stages and weakly in intermediate spermatogonia in stages II-III, but not in IV (Fig. 4). SYCP3 was localized in the nuclei of preleptotene spermatocytes in stage VIII, but not in VII; leptotene spermatocytes in stages IX and X; zygotene spermatocytes in stages XI and XII; pachytene spermatocytes in stages I through X; diplotene spermatocytes in stage XI; meiotic cells (subsequently defined as cells undergoing the first and second meiotic divisions, including secondary spermatocytes) in stage XII; and step 1 spermatids, albeit weakly, in stage I (Fig. 5). GATA4 was localized in the nuclei of Sertoli cells in all stages (Fig. 4, 5). However, even with the help of IHC for the marker proteins, it was difficult to distinguish the different subtypes of type A spermatogonia (de Rooij and Russell 2000; Chiarini-Garcia and Russell 2001). The use of strong fixatives such as Bouin or glutaraldehyde and embedment in plastic resins were previously reported to be necessary for this purpose, which makes it difficult to apply IHC to these sections. Therefore, in the present study, we did not attempt to distinguish the subtypes of type A spermatogonia. Figure 6 summarizes the patterns of acrosomal staining with PNA lectin and nuclear staining for ZBTB16, SYCP3, and GATA4 at different stages of spermatogenesis based on the results of Figures 4 and 5. As shown in the schematic, we found that ZBTB16 staining was useful for distinguishing stages I, II-III, and IV, whereas SYCP3 staining was useful for distinguishing stages VII, VIII, and IX.
Figure 3.
Immunohistochemical localization of ZBTB16 (A–D), SYCP3 (E–H), and GATA4 (I–L) in the seminiferous tubules at approximate stages of IV, VIII, and VII, respectively. (A, E, I) immunostaining with the antibodies indicated (red in A, E; green in I); (B, F, J) staining with DAPI (blue); and (C, G, K) merged pictures. (D, H, L) Staining with HE after fluorescent staining. (A–D) type A (A) spermatogonia were immunopositive, whereas intermediate (In) spermatogonia were immunonegative. (E–H) Preleptotene (Pl) spermatocytes and pachytene (P) spermatocytes were immunopositive. (I–L) Sertoli cells (Se) were immunopositive. Scale, 10 μm.
Figure 4.
Determination of stages I–XII and identification of cell types using a combination of IHC and PNA lectin histochemistry. Three-µm-thick sections were double-immunostained for GATA4 (green) and ZBTB16 (red), then stained with PNA-lectin histochemistry (green) and DAPI (blue). Se, Sertoli cells; A, type A spermatogonia; In, intermediate spermatogonia; B, type B spermatogonia; Pl, preleptotene spermatocytes; L, leptotene spermatocytes; Z, zygotene spermatocytes; P, pachytene spermatocytes; Di, diplotene spermatocytes; M1, spermatocytes undergoing the first meiotic division; Sc, secondary spermatocytes; S1-16, step 1-16 spermatids. Scale, 10 μm.
Figure 5.
Determination of stages (I–XII) and identification of cell types using a combination of IHC and PNA lectin histochemistry. Three-µm-thick sections were double-immunostained for GATA4 (green) and SYCP3 (red), then stained with PNA-lectin histochemistry (green) and DAPI (blue). Se, Sertoli cells; A, type A spermatogonia; In, intermediate spermatogonia; B, type B spermatogonia; Pl, preleptotene spermatocytes; L, leptotene spermatocytes; Z, zygotene spermatocytes; P, pachytene spermatocytes; Di, diplotene spermatocytes; M1, spermatocytes undergoing the first meiotic division; S1-16, step 1-16 spermatids. Scale, 10 μm.
Figure 6.
Schematic of acrosomal staining patterns with PNA lectin histochemistry and nuclear immunostaining patterns for ZBTB16, SYCP3, and GATA4 at different stages (I–XII) of mouse spermatogenesis. PNA lectin is shown in green, GATA4 in light-green, ZBTB16 in red, and SYCP3 in pink. Dotted red and pink for ZBTB16 and SYCP3, respectively, indicate that immunoreactivity was weak and dot-like in distribution. Se, Sertoli cells; A, type A spermatogonia; In, intermediate spermatogonia; B, type B spermatogonia; Pl, preleptotene spermatocytes; L, leptotene spermatocytes; Z, zygotene spermatocytes; P, pachytene spermatocytes; Di, diplotene spermatocytes; M, meiotic cells; S1–16, step 1-16 spermatids.
Quantification of the Cell Composition in Normal Mouse Seminiferous Tubules
To perform a quantitative analysis of the cell composition in seminiferous tubules, we applied combinations of DAPI staining, PNA lectin histochemistry, and IHC for specific cell markers. In a total of 322 seminiferous tubules, i.e., 157 and 165 from two separate portions, in the representative normal mouse testis, the stages were determined by the shape of the acrosomes, and the cell types in each tubule were identified based on the position, size, and shape of nuclei, the appearance of the nucleolus and chromatin in the nuclei, and specific marker staining in the nuclei. Of the two serial sections in each portion of the testis, one was double-immunostained for GATA4 and ZBTB16 and the other for GATA4 and SYCP3; the former was used to analyze stages I–VI and the latter to analyze stages VII–XII. The numbers of Sertoli cells, type A, intermediate, and type B spermatogonia, as well as preleptotene, leptotene, zygotene, pachytene, diplotene spermatocytes, and meiotic cells, and each of step 1 through to 16 spermatids were counted at each stage in the seminiferous tubule (Table 1). The average number of Sertoli cells per tubule section was 18.1 ± 3.4 in all seminiferous tubules examined (n=322), and values were not significantly different among the various stages. Therefore, in subsequent quantitative analyses, the number of each type of spermatogenic cell was counted as the absolute number per tubule section, without normalization with the number of Sertoli cells in the same section. The number of type A spermatogonia remained low from stages II-III through to VIII, increased gradually from IX through to XII, and was highest in stage I. Intermediate spermatogonia were exclusively detected between stages II and IV, with an average number of 11.8 ± 4.1 per tubule section, whereas type B spermatogonia were exclusively detected in stages V–VI, with an average of 26.1 ± 6.3 per tubule section. No significant differences were observed in the numbers of preleptotene spermatocytes in stages VII and VIII, leptotene spermatocytes in stages IX and X, pachytene spermatocytes from stage I through to X, and diplotene spermatocytes in stage XI and the other stages, with the overall average of 51.4 ± 8.7 per tubule section. Meiotic cells were exclusively detected in stage XII, with an average of 96.3 ± 31.3 per tubule section. The average number of round and elongating spermatids (steps 1–12) through all seminiferous tubules was 144.6 ± 29.8 and this did not significantly differ among the stages. On the other hand, the average number of elongating spermatids (steps 13–16) present in stages I–VIII was, for the most part, significantly lower than that of round spermatids (steps 1–8) present in the same respective stages, and this number varied from stage to stage.
Table 1.
Numbers of Different Cell Types in Seminiferous Tubules at Different Stages.
| Spermatogonia |
Spermatocytes |
Spermatids |
||||||||
|---|---|---|---|---|---|---|---|---|---|---|
| Stage | No. | Sertoli | A | In | B | Pl-L-Z | P-Di | M | Step 1–12 | Step 13–16 |
| I | 37 | 18.5 ± 3.8a | 7.9 ± 2.6a | 51.5 ± 7.7a | 153.0 ± 31.3a | 125.5 ± 23.2bcde | ||||
| II-III | 50 | 18.2 ± 3.1a | 1.6 ± 1.4b | 10.8 ± 3.9d | 53.4 ± 8.5a | 149.8 ± 26.8ab | 110.3 ± 27.3def | |||
| IV | 30 | 17.9 ± 3.0a | 1.8 ± 1.7b | 13.4 ± 3.9d | 51.2 ± 8.4a | 147.6 ± 28.0ab | 97.6 ± 25.6f | |||
| V | 21 | 18.4 ± 3.5a | 2.5 ± 2.5bc | 24.6 ± 3.9e | 47.1 ± 9.0a | 148.7 ± 24.7ab | 98.8 ± 30.2ef | |||
| VI | 17 | 18.3 ± 3.2a | 2.4 ± 1.7bc | 28.1 ± 7.9e | 50.8 ± 7.8a | 146.8 ± 26.7abc | 110.8 ± 30.6cef | |||
| VII | 60 | 18.0 ± 4.0a | 2.4 ± 1.9b | 47.6 ± 7.8a | 51.2 ± 7.1a | 142.9 ± 28.2ab | 112.2 ± 24.7def | |||
| VIII | 28 | 17.9 ± 2.6a | 1.8 ± 1.5b | 49.7 ± 8.0a | 50.4 ± 9.9a | 145.5 ± 23.4ab | 95.4 ± 17.2f | |||
| IX | 29 | 18.3 ± 3.4a | 3.6 ± 2.4bc | 51.3 ± 7.9a | 55.7 ± 7.2a | 138.5 ± 35.5abc | ||||
| X | 14 | 17.4 ± 3.9a | 4.0 ± 1.9bc | 51.9 ± 8.4a | 57.5 ± 12.9a | 138.6 ± 43.1abcd | ||||
| XI | 10 | 18.6 ± 3.6a | 4.5 ± 1.9abc | 53.3 ± 6.2a | 61.3 ± 10.4a | 142.7 ± 20.4abcd | ||||
| XII | 26 | 18.1 ± 2.9a | 5.8 ± 2.6ac | 51.4 ± 7.1a | 96.3 ± 31.3b | 144.6 ± 30.4abc | ||||
| Average | 18.1 ± 3.4 | 3.3 ± 2.9 | 11.8 ± 4.1 | 26.1 ± 6.3 | 51.4 ± 8.7 | 96.3 ± 31.3 | 144.6 ± 29.8 | 108.8 ± 27.1 | ||
The numbers of Sertoli cells and different spermatogenic cell types in each seminiferous tubule section belonging to a particular stage were counted for a total of 322 tubule sections in two tissue sections obtained from two discrete portions of a testis from a single representative normal mouse, and expressed as the mean cell number ± SD per tubule in each stage. No., the number of tubule sections belonging to each stage; A, type A spermatogonia; In, intermediate spermatogonia; B, type B spermatogonia, Pl, preleptotene spermatocytes, L, leptotene spermatocytes; Z, zygotene spermatocytes; P, pachytene spermatocytes; Di, diplotene spermatocytes; M, meiotic cells (cells undergoing the first and second meiotic divisions, including secondary spermatocytes); Average, the average cell number ± SD per tubule of Sertoli cells, type A spermatogonia, intermediate spermatogonia, type B spermatogonia, Pl-Di spermatocytes, meiotic cells, step 1-12 spermatids, and step 13-16 spermatids in all tubule sections that contained the respective cell types. Within the groups of Sertoli cells, spermatogonia, spermatocytes, and spermatids, differences among the mean cell number of each cell type per tubule in different stages were analyzed with a one-way ANOVA followed by Scheffe’s F test, and are represented by the superscripts a, b, c, d, e, and f. A significant difference was observed between two values that had no common superscript (p<0.01).
Morphological Features of Infertile Mouse Seminiferous Tubules
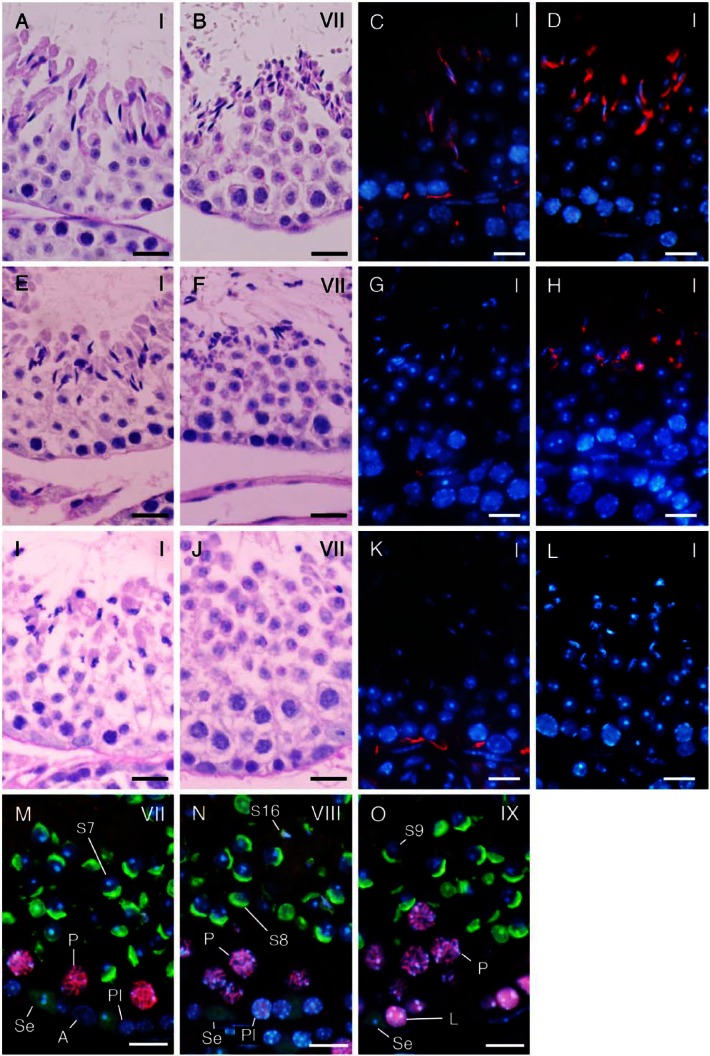
In the testes from both nectin-2-/- and nectin-3-/- mice stained with PAS-H, the basic structure of the seminiferous tubules was not severely defective, and it was possible to identify 12 stages of spermatogenesis as in the control mouse testis based on the acrosomal patterns in round and elongating spermatids (steps 1–12). However, the nuclei of elongated spermatids (steps 13–16), which are present in stages I–VIII of spermatogenesis, appeared to be more irregular in shape and fewer in number than those in the corresponding stages in normal control mice (Fig. 7A, 7B, 7E, 7F, 7I, 7J). This was more prominent in nectin-3-/- than in nectin-2-/- mouse testes, with step 16 spermatids rarely detectable in stage VII and VIII seminiferous tubules in the former (Fig. 7J). Other types of spermatogenic cells were normal in appearance. IHC indicated that immunoreactivity for nectin-2 was localized in the membranes of Sertoli cells in control and nectin-3-/- mice, but was completely absent in nectin-2-/- mice (Fig. 7C, 7G, 7K). On the other hand, immunoreactivity for nectin-3 was localized in the membranes surrounding the head portion of elongating (step 8 and later) spermatids in control and nectin-2-/- mice, but was completely absent in nectin-3-/- mice (Fig. 7D, 7H, 7L). Furthermore, immunoreactivity for nectin-2 was detected only in the basal portions, but not in the apical portions, of Sertoli cell membranes in nectin-3-/- mice (Fig. 7K).
Figure 7.
A comparison of seminiferous tubules in normal control (A–D), nectin-2-/- (E–H), and nectin-3-/- mice (I–O) at the representative stages shown in period acid-Schiff–hematoxylin (PAS-H) staining (A–B, E–F, I–J), IHC for nectin-2 (red; C, G, K) and nectin-3 (red; D, H, L), and double IHC for SYCP3 (red) and GATA4 (green) in combination with PNA-lectin histochemistry (green) (M–O). Nuclei were stained with DAPI (blue; C–D, G–H, K–L, M–O). (A–L) Normal (A, E) and distorted (I) shapes of step 13 spermatids in stage I; abundant (B), fewer (F), and scarce (I) numbers of step 16 spermatids in stage VII; the presence (C, K) and absence (G) of nectin-2-immunoreactivity in Sertoli cells in stage I, as well as the presence (D, H) and absence (L) of nectin-3-immunoreactivity in step 13 spermatids in stage I. (M–O) Stage VII (M), VIII (N), and IX (O) seminiferous tubules were distinguishable with the help of SYCP3 immunoreactivity in preleptotene (PI) spermatocytes at stage VIII, but not in those at stage VII, in leptotene (L) spermatocytes at stage IX, or in pachytene (P) spermatocytes at stages VII–IX, even in the absence of step 16 spermatids (S16) and with similar acrosomal patterns in step 7–9 spermatids (S7-9). Se, Sertoli cells immunopositive for GATA4 (green). Scale, 20 μm (A-–L), 10 μm (M–O).
Quantification of the Cell Composition in Infertile Mouse Seminiferous Tubules
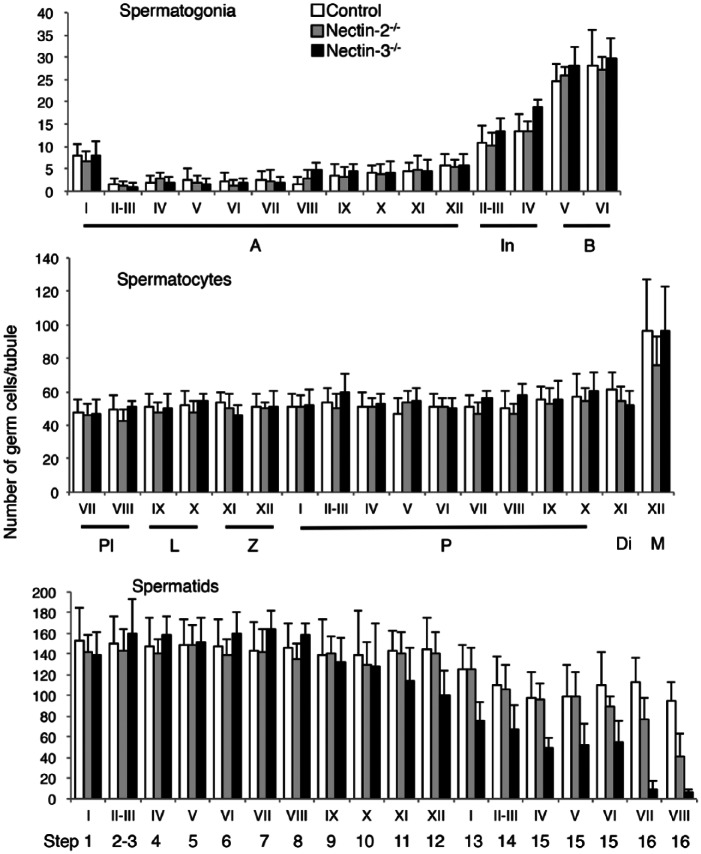
As in control mice, we performed a quantitative analysis of the cellular composition of seminiferous tubules in nectin-2-/- and nectin-3-/- mice using a combination of PNA lectin histochemistry for the acrosomes, DAPI staining in the nuclei, and IHC for SYCP3, ZBTB, and GATA4. Using SYCP3 immunostaining, which enabled stages VII, VIII, and IX to be distinguished even in the absence of elongating spermatids in nectin-3-/- mice (Fig. 7M–7O), we were able to determine all stages of spermatogenesis in nectin-2-/- and nectin-3-/- mice as in control mice. The numbers of all cell types in each stage were counted in a total of 197 seminiferous tubules; i.e., 100 and 97 from two separate portions taken from a representative testis of nectin-2-/- mice, and 220 (108 and 112) in a representative testis of nectin-3-/- mice, and were then compared with the values obtained from the same representative testis of control mice shown in Table 1 (Fig. 8). The average numbers of Sertoli cells per tubule section were not significantly different among the stages and were 17.0 ± 3.2 (n=197) and 16.8 ± 3.5 (n=220) in all seminiferous tubules examined in nectin-2-/- and nectin-3-/- mice, respectively; these values are similar to 18.1 ± 3.4 (n=322) measured for the control mice. No apparent differences were observed in the average numbers of type A, intermediate, and type B spermatogonia, as well as preleptotene, leptotene, zygotene, pachytene, diplotene spermatocytes, and meiotic cells among the 3 mouse strains. However, as was noted in the morphological analysis, the number of elongating spermatids (steps 13–16) appeared to become progressively lower in nectin-2-/- and nectin-3-/- mice than in control mice, starting from earlier stages in nectin-3-/- than in nectin-2-/- mice. Therefore, we performed a statistical analysis of differences in the average numbers of step 10 and later spermatids per tubule section starting from stage X among the control, nectin-2-/- and nectin-3-/- mice using samples from three mice per group (Fig. 9). We confirmed that the numbers of step 15–16 spermatids in nectin-2-/- mice and step 11–16 spermatids in nectin-3-/- mice were significantly lower than the numbers of corresponding spermatids in the control mice (p<0.05; n=3). At stage VIII, the numbers of matured step 16 spermatids in nectin-2-/- and nectin-3-/- mice were 43.2 ± 3.4 and 4.4 ± 1.4, respectively, which were determined to be 45% and 5%, respectively, of 96.3 ± 4.4 measured for the control mice (p<0.05; n=3).
Figure 8.
An analysis of the numbers of different spermatogenic cell types in seminiferous tubules at different stages (I–XII) in normal control, nectin-2-/-, and nectin-3-/- mice. The numbers of all spermatogenic cell types in each stage were counted for a total of 322 (in control mouse), 197 (in nectin-2-/- mouse), or 220 (in nectin-3-/- mouse) seminiferous tubule sections obtained from a testis of a single representative mouse from the respective strains, and expressed as the mean cell number ± SD per tubule in each stage. Data obtained in control mouse are the same as that given in Table 1. A, type A spermatogonia; In, intermediated spermatogonia; B, type B spermatogonia; Pl, preleptotene spermatocytes; L, leptotene spermatocytes; Z, zygotene spermatocytes; P, pachytene spermatocytes; Di, diplotene spermatocytes; M, meiotic cells; S1-16, step 1-16 spermatids.
Figure 9.
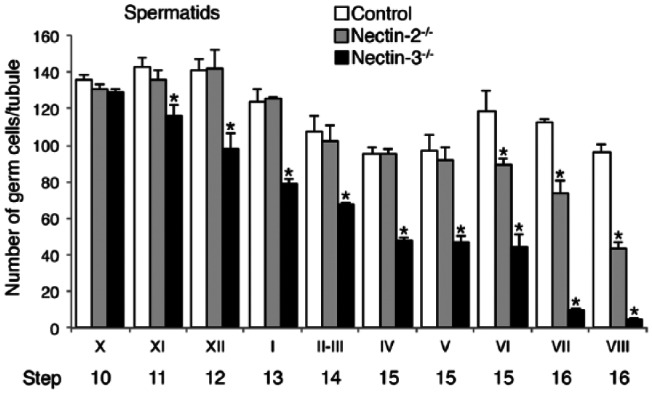
A comparison of the numbers of later-step spermatids among normal control, nectin-2-/-, and nectin-3-/- mice. The mean numbers of step 10 and later spermatids in stage X–VIII seminiferous tubules were first calculated for each testis, as in Figure 8, and the data obtained in 3 testes from 3 animals for each mouse strain are expressed as the average cell number ± SD per tubule in each stage (n=3). Differences in cell numbers among control, nectin-2-/-, and nectin-3-/- mice were analyzed with a one-way ANOVA followed by Bonferroni’s post-hoc test. *significantly lower than the numbers of corresponding spermatids in the same stages in control mice (p<0.05; n=3).
Discussion
In the present study, we first aimed to establish a quantitative standard for the cellular composition of seminiferous tubules in normal adult mice using fluorescence histochemical techniques. Determining the stages of seminiferous tubules and counting the cell number at each stage was easier with the combination of PNA lectin histochemistry for acrosomes and DAPI staining for nuclei than with the PAS-H method. The PAS-H method is based on the purple-red-colored PAS staining of acrosomal glycoproteins and the violet-colored hematoxylin staining of nucleic acids (Ahmed et al. 2009). As spermiogenesis proceeds, the acrosome derived from the Golgi apparatus increases in size and spreads as a flat cap over the nucleus, which undergoes shrinkage due to the condensation of chromatin. The shape of acrosomes in spermatids in various steps as well as the combination pattern of various types of spermatogenic cells in the seminiferous epithelium make it possible to determine the stage of spermatogenesis in a given section of a seminiferous tubule (Meistrich and Hess 2013). Spermatogenesis has been classified into 14 stages in rats (Leblond and Clermont 1952; Russell et al. 1990) and into 12 stages in mice by the PAS-H method (Oakberg 1956; Ahmed and de Rooij 2009; Meistrich and Hess 2013). In the present study, fluorescence-labeled acrosomes and nuclei were easier to recognize than PAS-H-stained ones because the green fluorescence of acrosomes was a good contrast to the blue fluorescence of the DAPI-stained nuclei, both of which were a good contrast to the fluorescence-free background of the cytoplasm. The greatest advantage of the fluorescence method is that multiple antigens can be visualized with IHC in combination with acrosomes visualized with lectin histochemistry. In the present study, using IHC for ZBTB16, SYCP3, and GATA4, specific nuclear markers for type A spermatogonia, spermatocytes, and Sertoli cells, respectively, we easily and precisely identified the different cell types in each stage of seminiferous tubule development.
The present results on the quantitative composition of spermatogenic cells in the seminiferous tubules of normal adult mice at different stages were consistent with the earlier findings of Oakberg (1956); however, we showed the numbers of Sertoli cells and spermatids at all different steps whereas Oakberg did not. In the present study, the average numbers of intermediate spermatogonia, type B spermatogonia, and spermatocytes (preleptotene-diplotene) per tubule in all tubule sections that contained the respective cell types were 11.8 ± 4.1, 26.1 ± 6.3, 51.4 ± 8.7, respectively, which roughly equates to 1:2:4; this is in agreement with the theoretical values deduced from the final two mitotic divisions of differentiated spermatogonia. On the other hand, the average number of step 1–12 spermatids was 144.6 ± 29.8. This number was approximately 2.81-fold higher than that of spermatocytes, which was only 70% of the theoretical value of 4.0 deduced from two sequential meiotic divisions of spermatocytes.
However, the ratio of the numbers of spermatids to spermatocytes within a section needs to be corrected with the probability of cells to be involved in the cross sections of a testis, which is a function of the diameter of cells, the distance between neighboring cells, and the thickness of the sections (Abercrombie 1946; Oakberg 1956). Therefore, we randomly selected 10 tubules from each of the 9 stages (I, II-III through to X) and measured the nuclear diameter of one typical pachytene spermatocyte in each tubule at each stage. The average nuclear diameter of pachytene spermatocytes at each stage (n=10) ranged from 9.165 µm (at stage I) to 11.520 µm (at stage X). The corrected count (CC) of pachytene spermatocytes per tubule at each stage was calculated using the following equation, which assumes that the nuclear distance is equal to the section thickness (Abercrombie 1946; Oakberg 1956): CC = number of pachytene spermatocytes × section thickness (3 µm) / (section thickness + nuclear diameter). The calculated mean CC of pachytene spermatocytes per tubule in all stages (n=9) was 12.165. We also measured the nuclear diameter of one typical step 2–3 spermatid in each of the randomly selected 10 tubules at stage II-III, and determined the average nuclear diameter of step 2-3 spermatids (n=10) to be 6.362 µm. The calculated CC of step 2–3 spermatids per tubule at stage II-III was 47.996. Therefore, the corrected ratio of the numbers of step 2–3 spermatids to pachytene spermatocytes was 3.945 (47.996/12.165). This equates to 98.6% of the theoretical value of 4.0. This calculation could be roughly applied to the ratio of all step 1–12 spermatids to all spermatocytes. Together, with no significant difference observed in the average numbers of preleptotene, leptotene, zygotene, and pachytene spermatocytes, the present results imply that the loss of cell number, if any, was very small during spermatocyte meiosis.
The average numbers of elongating (step 13-16) spermatids at stages I–VIII ranged from 95.4 ± 17.2 to 125.5 ± 23.2, and these values were mostly lower than those of round spermatids (steps 1–8) present in the respective stages, which also varied among the stages. However, the ratio of elongating to round spermatids may also need to be corrected because 1) some of the nuclei of elongating spermatids, which were very small, may have been out of the focus and not counted in the 3-µm-thick sections, and 2) the expected numbers of nuclei in elongating spermatids in sections may have been less than those in round spermatids due to differences in their diameters. Therefore, the loss in cell number, if any, may have been small during the process of spermiogenesis. Large numbers of spermatogenic cells are thought to undergo apoptosis in the testis (Oakberg 1956; Hess et al. 2008). However, the present results imply that such apoptosis mainly occurs in earlier (type A) spermatogonia and not in the other cell types. It is important to note that the present analysis was only performed in random portions of seminiferous tubules included in a 3-µm section of the testis. To achieve a more precise analysis of changes in the cellular composition accompanying spermatogenesis, cell numbers in 3D-reconstructed seminiferous tubules should be evaluated in the future.
In the present study, based on the quantitative standard of the cell composition in the seminiferous tubules obtained in normal control mice, we revealed a progressive decrease in the numbers of later-step spermatids in the seminiferous tubules of genetically modified nectin-2-/- and nectin-3-/- mice, with the numbers of steps 11–16 in nectin-3-/- and steps 15–16 in nectin-2-/- mice being significantly lower than those in the control mice. Nectin-2 and nectin-3 are Ca2+-independent immunoglobulin-like cell adhesion molecules (Takai et al. 2008). In the mouse testis, nectin-2 and nectin-3 are localized in the membranes of Sertoli cells and elongating (step 8–16) spermatids, respectively, and undergo heterophilic binding with each other at the junctions between these cell types (Ozaki-Kuroda et al. 2002). Nectin-2-/- mice have male-specific infertility due to severe spermatozoon head and mid-piece malformation, impaired binding to the zona pellucida, and impaired oocyte penetration (Mueller et al. 2003). Nectin-3-/- mice also have male-specific infertility and exhibit defects in the later steps of sperm morphogenesis, including distorted nuclei, an abnormal distribution of mitochondria, and impaired localization of nectin-2 at the Sertoli–spermatid junctions (Inagaki et al. 2006). These suggest that the heterophilic trans-interaction between nectin-2 and nectin-3 may be essential for the formation and maintenance of Sertoli–spermatid junctions, which may play a critical role in spermatid development. The present study performed a quantitative analysis of spermatogenic cells in the seminiferous tubules of nectin-2-/- and nectin-3-/- mice for the first time. The results obtained were consistent with the proposed roles of nectin-2 and nectin-3 in the final phase of spermatogenesis, i.e., spermiogenesis. The absence of the interaction of elongating spermatids with Sertoli cells through binding of these cell adhesion molecules may cause impairments in the maturation of these spermatids and lead to their progressive detachment from Sertoli cells. The present study also revealed that decreases in the numbers of spermatids began earlier and were more severe in nectin-3-/- mice than in nectin-2-/- mice. This may be interpreted by a lack of nectin-2 in the apical portions of Sertoli cell membranes in nectin-3-/- mice, a phenomenon that was reported previously by Inagaki et al. (2006) and confirmed in the present study. In the case of nectin-2-/- mice, intact nectin-3 on later-step spermatids may bind with some cell adhesion molecules other than nectin-2 on Sertoli cells, which may compensate for the absence of nectin-2.
Various natural mutants as well as genetically modified mouse strains have male-specific infertility (de Rooij and de Boer 2003; Matzuk and Lamb 2008). In some of these infertile strains, the histological features of seminiferous epithelia appear normal or not severely impaired. However, the application of a quantitative analysis to these strains may disclose specific points of the abnormality in spermatogenesis, as was accomplished in the present study. Thus, the present procedure can become a standard in the quantitative analysis of abnormalities in spermatogenesis. The ultimate goal of the present study is the application of this procedure to the study of human male infertility. Most cases of male infertility have been attributed to impaired spermatogenesis (non-obstructive azoospermia), which is mostly idiopathic (Lipshultz et al. 2009). The state of spermatogenesis in the seminiferous tubules of infertile males has been evaluated using the Johnsen score, a testicular biopsy score that covers scores from 1 (neither germ cells nor Sertoli cells present) through to 10 (complete spermatogenesis and perfect tubules). However, this evaluation method is largely qualitative and does not distinguish spermatogenic stages; therefore, cases in which spermatogenesis normally progresses to the later steps, but ultimately leads to complete infertility, can be apparently assessed as higher scores. The difficulty associated with the quantitative evaluation of spermatogenesis in human seminiferous tubules resides in the area of each stage being so small that a single section of seminiferous tubules commonly contains several different stages, as well as the fact that acrosomes of spermatids are difficult to stain with conventional PAS-H, such that human spermatogenesis is only divided into 6 stages based solely on cell associations (Clermont 1963). However, a recent study reported that the visualization of acrosomes with IHC for acrosin enabled 12 stages to be distinguished in human spermatogenesis (Muciaccia et al. 2013). Therefore, provided that a precise determination of stages can be achieved, the present, quantitative procedure will become useful in disclosing the specific points of abnormalities in spermatogenesis with human infertility.
Acknowledgments
We are grateful to Dr. Jun Miyoshi for scientific contribution in preparing the nectin-3-/- mice. We also thank Mr. Shuichi Yamazaki for technical assistance in making the paraffin sections.
Footnotes
Declaration of Conflicting Interests: The authors declared no potential conflicts of interest with respect to the research, authorship, and/or publication of this article.
Funding: The authors disclosed receipt of the following financial support for the research, authorship, and/or publication of this article: This study was supported in part by a Grant-in-Aid for scientific research from the Ministry of Education, Culture, Science, Sports and Technology of Japan to TW (#25460241).
References
- Abercrombie M. (1946). Estimation of nuclear population from microtome sections. Anat Rec 94:239-247. [DOI] [PubMed] [Google Scholar]
- Ahmed EA, de Rooij DG. (2009). Staging of mouse seminiferous tubule cross-sections. Methods Mol Biol 558:263-277. [DOI] [PubMed] [Google Scholar]
- Arya M, Vanha-Perttula T. (1986). Comparison of lectin-staining pattern in testis and epididymis of gerbil, guinea pig, mouse, and nutria. Am J Anat 175:449-469. [DOI] [PubMed] [Google Scholar]
- Buaas FW, Kirsh AL, Sharma M, McLean DJ, Morris JL, Griswold MD, de Rooij DG, Braun RE. (2004). Plzf is required in adult male germ cells for stem cell self-renewal. Nat Genet 36:647-652. [DOI] [PubMed] [Google Scholar]
- Chiarini-Garcia H, Russell LD. (2001). High-resolution light microscopic characterization of mouse spermatogonia. Biol Reprod 65:1170–1178. [DOI] [PubMed] [Google Scholar]
- Clermont Y. (1963). The cycle of the seminiferous epithelium in man. Am J Anat 112:35-51. [DOI] [PubMed] [Google Scholar]
- de Rooij DG, Russell LD. (2000). All you wanted to know about spermatogonia but were afraid to ask. J Androl 21:776–798. [PubMed] [Google Scholar]
- de Rooij DG, de Boer P. (2003). Specific arrests of spermatogenesis in genetically modified and mutant mice. Cytogenet Genome Res 103:267–276. [DOI] [PubMed] [Google Scholar]
- Hermo L, Pelletier RM, Cyr DG, Smith CE. (2010). Surfing the wave, cycle, life history, and genes/proteins expressed by testicular germ cells. Part 2: Changes in spermatid organelles associated with development of spermatozoa. Microsc Res Tech 73:279–319. [DOI] [PubMed] [Google Scholar]
- Hess RA, Renato de, Franca L. (2008). Spermatogenesis and cycle of the seminiferous epithelium. Adv Exp Med Biol 636:1-15. [DOI] [PubMed] [Google Scholar]
- Imai T, Kawai Y, Tadokoro Y, Yamamoto M, Nishimune Y, Yomogida K. (2004). In vivo and in vitro constant expression of GATA-4 in mouse postnatal Sertoli cells. Mol Cell Endocrinol 214:107-115. [DOI] [PubMed] [Google Scholar]
- Inagaki M, Irie K, Ishizaki H, Tanaka-Okamoto M, Miyoshi J, Takai Y. (2006). Role of cell adhesion molecule nectin-3 in spermatid development. Genes Cells 11:1125-1132. [DOI] [PubMed] [Google Scholar]
- Johnsen SG. (1970). Testicular biopsy score count – a method for registration of spermatogenesis in human testes: normal values and results in 335 hypogonadal males. Hormones 1:2-25. [DOI] [PubMed] [Google Scholar]
- Kerr JB, Loveland KL, O’Bryan MK, de Kretser DM. (2006). Cytology of the testis and intrinsic control mechanisms. In Knobil and Neill’s Physiology of Reproduction, edn 3, pp 827-947. Ed Neill JD. New York: Academic Press. [Google Scholar]
- Lammers JH, Offenberg HH, van Aalderen M, Vink AC, Dietrich AJ, Heyting C. (1994). The gene encoding a major component of the lateral elements of synaptonemal complexes of the rat is related to X-linked lymphocyte-regulated genes. Mol Cell Biol 14:1137-1146. [DOI] [PMC free article] [PubMed] [Google Scholar]
- Leblond CP, Clermont Y. (1952). Definition of the stages of the cycle of the seminiferous epithelium in the rat. Ann NY Acad Sci 55:548-573. [DOI] [PubMed] [Google Scholar]
- Lee MC, Damjanov I. (1984). Anatomic distribution of lectin-binding sites in mouse testis and epididymis. Differentiation 27:74-81. [DOI] [PubMed] [Google Scholar]
- Lipshultz LI, Howards SS, Niederberger CS. (2009). Infertility in the Male, 4th ed. Kambridge, NY: Kambridge University Press. [Google Scholar]
- Matzuk MM, Lamb DJ. (2008). The biology of infertility: research advances and clinical challenges. Nat Med 14:1197-1213. [DOI] [PMC free article] [PubMed] [Google Scholar]
- Meistrich ML, Hess RA. (2013). Assessment of spermatogenesis through staging of seminiferous tubules. Methods Mol Biol 927:299-307. [DOI] [PubMed] [Google Scholar]
- Muciaccia B, Boitani C, Berloco BP, Nudo F, Spadetta G, Stefanini M, de Rooij DG, Vicini E. (2013). Novel stage classification of human spermatogenesis based on acrosome development. Biol Reprod 89:60. [DOI] [PubMed] [Google Scholar]
- Mueller S, Rosenquist TA, Takai Y, Bronson RA, Wimmer E. (2003). Loss of nectin-2 at Sertoli-spermatid junctions leads to male infertility and correlates with severe spermatozoan head and midpiece malformation, impaired binding to the zona pellucida, and oocyte petetration. Biol Reprod 69:1330-1340. [DOI] [PubMed] [Google Scholar]
- Oakberg EF. (1956). A description of spermiogenesis in the mouse and its use in analysis of the cycle of the seminiferous epithelium and germ cell renewal. Am J Anat 99:391-414. [DOI] [PubMed] [Google Scholar]
- Ozaki-Kuroda K, Nakanishi H, Ohta H, Tanaka H, Kurihara H, Mueller S, Irie K, Ikeda W, Sakai T, Wimmer E, Nishimune Y, Takai Y. (2002). Nectin couples cell-cell adhesion and the actin scaffold at heterotypic testicular junction. Curr Biol 12:1145-1150. [DOI] [PubMed] [Google Scholar]
- Russell LD, Ettlin RA, Sinha-Hikim AP, Clegg ED. (1990). Histological and histopathological evaluation of the testis. Vienna, IL: Cache River Press. [Google Scholar]
- Takai Y, Ikeda W, Ogita H, Rikitake Y. (2008). The immunoglobulin-like cell adhesion molecule nectin and its associated protein afadin. Annu Rev Cell Dev Biol 24:309-342. [DOI] [PubMed] [Google Scholar]


