

Abstract
Structural studies of membrane proteins have highlighted the likely influence of membrane mimetic environments (i.e., lipid bilayers versus detergent micelles) on the conformation and dynamics of small α-helical membrane proteins. We have used molecular dynamics simulations to compare the conformational dynamics of BM2 (a small α-helical protein from the membrane of influenza B) in a model phospholipid bilayer environment with its behavior in protein–detergent complexes with either the zwitterionic detergent dihexanoylphosphatidylcholine (DHPC) or the nonionic detergent dodecylmaltoside (DDM). We find that DDM more closely resembles the lipid bilayer in terms of its interaction with the protein, while the short-tailed DHPC molecule forms “nonphysiological” interactions with the protein termini. We find that the intrinsic micelle properties of each detergent are conserved upon formation of the protein–detergent complex. This implies that simulations of detergent micelles may be used to help select optimal conditions for experimental studies of membrane proteins.
Introduction
Membrane proteins reside in a complex bilayer environment, containing multiple species of lipids. However, by necessity, most structural and biophysical studies require protein reconstitution into either a simple lipid bilayer or a membrane–mimetic detergent environment. Combined with the difficulties of overexpression of membrane proteins, this has led to membrane protein structures being under-represented in the Protein Data Bank (www.rcsb.org) compared to water-soluble proteins (http://blanco.biomol.uci.edu/mpstruc/). We therefore need to improve our understanding of how experimental conditions may influence the properties of a given membrane protein.
Recent successes in membrane protein structural biology and biophysics provide a wealth of experimental data to enable us to explore the effect of environment on their structure. A particularly well-characterized example of a “simple” membrane protein is provided by the transmembrane (TM) domain of the influenza A/M2 proton channel. A/M2-TM is a small, tetrameric, α-helical membrane protein, the structure of which has been determined by X-ray crystallography,1 by solution NMR,2,3 and by solid-state NMR4 under a range of conditions.5 A comparison of the various structures proves that the packing of the helices within the A/M2 tetramer is sensitive to the environment in which the protein has been studied. We may expect similar observations to be made for a wider range of membrane proteins as the number of deposited structures continues to expand.6
Molecular dynamics (MD) simulations provide a powerful tool in the study of membrane proteins as they allow us to “transplant” the protein into an environment of interest. The majority of efforts are dedicated toward restoring these proteins in a native-like bilayer,7 but the same tools may be used to simulate these proteins under conditions reflecting those used in experiments, thus replicating the conditions used in vitro. Examples of this include MD simulations of crystal packing in OmpA8 and of the behavior of protein–detergent complexes (PDCs) in mass spectrometry experiments.9
Simulations of PDCs pose a number of additional challenges as the time scales required to fully sample the process of micelle formation are not readily accessible by conventional atomistic (AT) simulation, while reduced representations (e.g., coarse-grained simulations) may not capture all of the details of the process.10 However, these limitations may be overcome by a variety of methods, including multiscale approaches,10 and by averaging over multiple simulations.11
In the current study, we have focused on the proton channel from the influenza B virus (BM2) as a model membrane protein. BM2 is a small, tetrameric, α-helical membrane protein12,13 homologous in both structure and function to the A/M2 channel protein (see above), although BM2 is less well-studied.14 The structure of the TM domain of BM2 (BM2-TM) has been determined by solution NMR15 in detergent micelles.
We used simulations to study BM2-TM in three membrane–mimetic environments, a simple model lipid bilayer (DPPC; dipalmitoylphosphatidylcholine), a zwitterionic detergent (DHPC; dihexanoylphosphatidylcholine) used in the NMR studies, and a nonionic detergent (DDM; n-dodecyl-β-d-maltoside) that has been used in many crystallographic studies of membrane proteins16 (Figure 1). To the best of our knowledge, this is the first comparative MD study of an α-helical membrane protein in two types of detergent micelles and in a model lipid bilayer, adding to a number of previous simulation studies of membrane proteins in a bilayer versus a detergent micelle (see, e.g., refs (17−23)). We note that there are several differences between DHPC and DDM micelles. The geometry (prolate versus oblate), critical micelle concentration, and aggregation size are all expected to play a role in the properties of the PDC. Thus, the effect that these properties of the detergents have on the structure and dynamics of membrane proteins within PDCs is studied using BM2-TM as a model of α-helical membrane proteins.
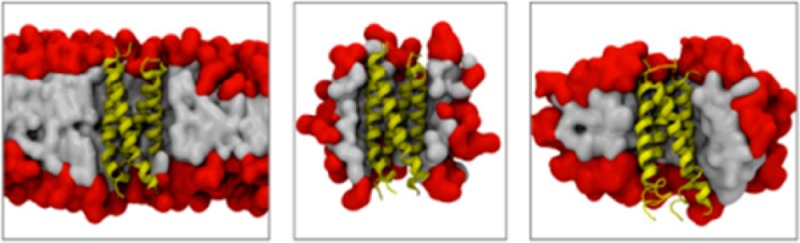
Figure 1.
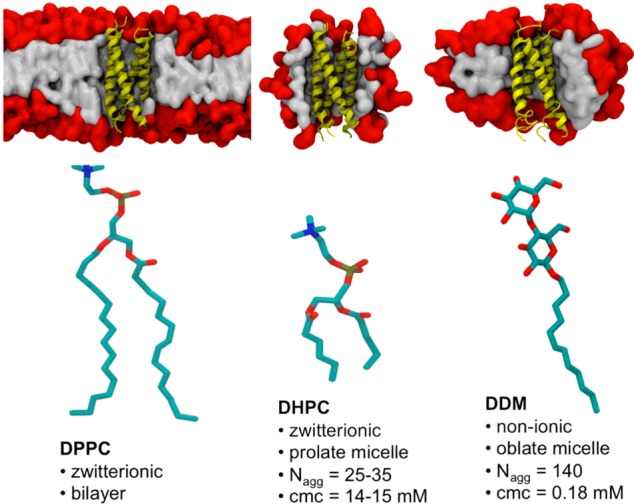
(Upper panel) Simulation systems showing the BM2 tetrameric helix bundle in yellow in a DPPC bilayer and in DHPC and DDM micelles. Head groups are shown in red, and tails are in gray. (Lower panel) Lipid (DPPC) and detergents (DHPC, DDM) used in this study. The aggregation properties of DHPC and DDM micelles are as reported in ref (24).
Materials and Methods
All simulations were performed using GROMACS v4.6 (www.gromacs.org).25 The initial coordinates of the BM2-TM domain were from pdb entry 2KIX.15 His19 residues were singly protonated and His27 residues doubly protonated.26 This was done on the basis of experimental data for these residues at the pH (7.5) at which the NMR structure was solved.270 Exploratory simulations investigating the influence of different combinations of the His27 protonation state showed no significant differences in stability (Figure S12, Supporting Information). CG and AT parameters for DHPC and DDM were as described those in ref (9) and available from LipidBook (http://lipidbook.bioch.ox.ac.uk/).27 Analyses were performed using GROMACS tools, MDAnalysis (mdanalysis.googlecode.com),28 and locally written code. Visualization used VMD.29
Multiscale Simulations
Coarse-grained (CG) simulations used the MARTINI v2.1 force field30,31 and were performed as described elsewhere.32 Standard simulation parameters associated with the MARTINI force field were used, unless stated otherwise. A time step of 20 fs was used. The temperature (323 or 300 K) and pressure (1 bar) were maintained using the Berendsen coupling schemes. CG simulations were 1 μs in duration, unless stated otherwise. Long-range interactions were cut off at 1.2 nm. Conversion to AT resolution was achieved using a fragment-based method, as described elsewhere.32 AT simulations used the OPLS-UA force field with Berger lipids33 and TIP4P water as described in ref (9). Additional DPPC simulations used the OPLS-AA34 and GROMOS 56a3 force fields,35 the latter with the SPC water model. AT simulations were 100 ns in duration, unless otherwise stated. A time step of 2 fs was used. The particle mesh Ewald method36 was used for calculation of long-range electrostatics. AT simulations used the Berendsen thermostat (323 or 300 K) and Parrinello–Rahman barostat (1 bar).37
BM2 in a DPPC Bilayer
As in previous studies,32 a multiscale simulation procedure was used in which CG simulations were used to self-assemble a bilayer around the protein. Briefly, these were generated by CGMD simulation of the BM2-TM domain tetramer with elastic network model restraints. DPPC molecules were randomly distributed within the cubic simulation box (size 9 nm3) and allowed to self-assemble about the protein in a 1 μs simulation. A representative snapshot was converted to AT resolution.
Generation of DHPC Micelles
An ATMD simulation of 200 DHPC molecules randomly distributed about a simulation box containing ∼75 000 water molecules was performed. The concentration of DHPC in this system was ∼300 mM, intended to match the concentrations used in the solution NMR BM2-TM experiment.15 The detergent/protein ratio was ∼200:1; therefore, 200 DHPC monomers was chosen as a minimum system size.
Generation of DDM Micelles
The Packmol38 software was used to build two sizes of CG DDM micelle, N = 132 and 150 in a 10 nm3 box. CGMD simulations were performed followed by conversion to AT resolution. The DDM sugar rings adopted a chair conformation.
Results and Discussion
DHPC Micelle Generation
AT resolution simulations of the self-assembly of DHPC micelles at experimentally relevant detergent concentrations were comparable to small-angle X-ray scattering (SAXS) data,24 implying that this approach may also be used to study BM2–DHPC complex formation (Supporting Information Figure S1). This method of self-assembling detergent molecules has been used successfully for previous studies with zwitterionic detergents.8,40 Properties of an individual DHPC micelle that formed within 25 ns and remained stable for the duration of the simulation (Supporting Information Figure S2) were compared to experimental SAXS data. The prolate shape of the micelle (c > a = b) may be quantified by calculation of the semiaxis lengths (which are in turn calculated from the micelle moments of inertia, I1 > I2 > I3).41 The polar length, corresponding to the thickness of the head group region, is found by calculating the semiaxis lengths of the acyl tails alone and subtracting these from the overall lengths. These along with the micelle size and radius of gyration are shown in Supporting Information Table S1. The prolate shape of the micelle (a/c ratio = 1.5) is in reasonable agreement with SAXS measurements (a/c ratio = 2.2). There is good agreement between the thickness of the head group region calculated from SAXS data (3.0–4.0) and that from MD simulations (3.7 ± 0.4). The radius of gyration of the simulated micelle (Rg) is lower than the experimental value, corresponding to a more compact assembly. The discrepancy between experimental and MD values may be related to hydrated components of the head group region of the micelle contributing to the SAXS data.42 However, the overall agreement between the experimental data and the MD data is reasonable. The analysis of pure DHPC micelle formation suggested that self-assembly via ATMD simulations may be used to generate models of protein–DHPC complexes. CG simulations would allow longer simulations to be performed. However, initial CG simulations of DHPC self-assembly led to no apparent upper limit in micelle size with standard MARTINI water (as reported elsewhere43), suggesting that this method may be of limited use in predicting the size of the PDC.
DDM Micelle Generation
In contrast to the case for DHPC, AT resolution self-assembly simulations of DDM were not found to equilibrate within comparable time scales. A more computationally efficient manner of generating BM2–DDM complexes was therefore developed using a multiscale approach, in which preformed DDM micelles were allowed to interact with BM2. The monomer–micelle equilibrium lies much further to the right for DDM compared to that for DHPC (Figure 1), such that the concentration of DDM monomers in bulk solution is approximately 2 orders of magnitude lower than that for DHPC. It seems reasonable, therefore, to simulate the interaction of a DDM aggregate (i.e., a preformed micelle) with the membrane protein. This may in principle be generated using self-assembly simulations of DDM; however, we found equilibration to be rather slow (on the microsecond time scale) and therefore chose to use preformed micelles in the interest of computational efficiency. (Examples of self-assembly simulations are shown in Supporting Information Figure S3 for comparative purposes.) Two sizes of micelles were built, N = 132 and 150. These are within the experimentally determined aggregation range and allow comparison to both experimental results and a recent MD study of DDM micelles.42 The initial spherical aggregate for the N = 150 system is shown in Supporting Information Figure S4. Upon CGMD simulation, the micelle “flattens out” to adopt a more oblate shape, consistent with experimental observations. There is also a tendency for the maltose head groups to cluster together on the surface, leaving the alkyl tails to some extent exposed to solvent. The final CG-DDM micelle was then converted to an AT representation, using either the OPLS-AA or the GROMOS 56a3 force field. Upon ATMD simulation of the DDM micelle, the dimensions decrease, and the micelle ellipticity decreases slightly while maintaining an oblate shape (Supporting Information Table S2). Such changes upon CG2AT conversion are not unexpected. For example, water molecules are able to penetrate into the head group region of the AT micelle, whereas the larger water particles used in CGMD limit the degree of penetration. The clustering of maltose head groups, leading to a “rough” surface was maintained in the ATMD simulations. The DDM micelle systems tested are summarized in Supporting Information Table S2 with calculated parameters compared to those from MD and experiment. As was observed for the DHPC micelle, there is some difference between the calculated dimensions of the simulated DDM micelles (including those from ref (42)) and the experimental scattering data. The main disparity between experiment and simulation appears to be the degree of ellipticity (measured by the a/c ratio).
This study and previous studies have shown that there is a need to improve agreement between experimentally and computationally calculated properties. It may be expected that advances in methodology, such as developments in polarizable force fields,44 may lead to improvements. However, the choice of experimental method for determining micelle properties still causes greater deviation in calculated properties than the difference between experimental and computational results.43
Taken together, the simulations of the detergent-only systems provide protocols for each detergent (i.e., AT self-assembly for DHPC versus multiscale simulations from a CG preformed aggregate for DDM) that could be extended to simulate formation of respective detergent complexes with the BM2 protein.
BM2–DHPC Complex Formation
A similar approach to the one described for the DHPC-only simulation was set up to self-assemble a BM2–DHPC PDC. The NMR structure of BM2 was restrained in the center of the box, and 200 DHPC lipids were randomly positioned and oriented around it. This was the starting point for a 50 ns ATMD simulation during which the condensation of DHPC detergent molecules onto the protein surface was monitored. Similarly to the DHPC-only simulation, small DHPC clusters formed within a few nanoseconds (Supporting Information Figure S5). Following the initial 50 ns of ATMD simulation, 115 DHPC residues were found to be directly or indirectly in contact with the protein in a “loose” aggregate. The majority of these were in contact with the hydrophobic region of the protein. A smaller micelle of N ≈ 25 was attached to the N-terminal extracellular region. The majority of the hydrophobic surface residues were in contact with the DHPC tails, and water was excluded from this region (Supporting Information Figure S6). The charged residues near the protein termini remained largely accessible to water. Once the initial loose PDC complex formed (after 50 ns), the main PDC was removed and simulated further in a smaller box (while maintaining the same overall concentration of DHPC), allowing for a reduction in computational cost of the equilibration process, in a manner similar to that described in ref (40). During the 100 ns simulation, the smaller DHPC micelle attached to the N-terminus was found to dissociate, and the geometry of the remaining PDC stabilized within a 100 ns time scale, as evidenced by its radius of gyration (Supporting Information Figure S7).
Formation of the BM2–DDM Complex
The calculated values of the aggregation number of DDM micelles range from 98 to ∼140.45 Previous simulations and calculations have shown that upon binding to a protein, the number of detergent molecules can increase above that of the aggregation number of pure detergent as the hydrophobic core of the protein provides additional surface area with which the alkyl tails may interact.46 On the basis of this evidence, a micelle of DDM at the upper end of the predicted aggregation number, that is, 150 DDM molecules, was used as the starting point for the generation of a BM2–DDM complex. The BM2 protein and DDM micelle were initially separated in the simulation box at a distance greater than the interaction cutoffs. Five simulations of 1 μs based on this starting configuration were performed (Supporting Information Figure S8). In each case, the micelle and BM2-TM interacted. In four of the simulations, the protein became incorporated into the center of the DDM micelle, following a variable time spent in a more surface-bound orientation. These stages may be monitored in terms of the protein solvent-accessible surface area (SASA) and simulation box volume (Supporting Information Figure S9). The distributions of DDM head groups in each of the four simulations where BM2 becomes fully incorporated into the complex reveal a degree of variation in the position of the protein within the micelle (Supporting Information Figure S10). This is reminiscent of a previous suggestion that small peptides in large detergent micelles may adopt multiple conformations, corresponding to their adopting a range of positions and/or orientations within such micelles.47 The PDC generated in the first simulation was converted to AT resolution and simulated for 20 ns at 323 K, with positional restraints on the protein to enable the repacking of detergent molecules around the protein. Similarly to the DDM-only micelle control, the protein–micelle complex became more compact (measured by an initial rapid decrease in Rg of the complex from 27.5 to 27.0 Å), and the geometry stabilized (small fluctuations in Rg in the region of ±0.2 Å) during this 20 ns simulation.
BM2-TM in a DPPC Bilayer
AT simulations of BM2-TM in a DPPC bilayer highlighted some regions of relative instability in the protein. The average Cα RMSD over the course of the 100 ns ATMD simulation was 3.0 Å (±0.1) (Supporting Information Figure S11). In particular, the pore radius was found to decrease rapidly during the first 1 ns of simulation (Supporting Information Figure S12). This is reminiscent of behavior observed by us and others48 for UCP2, another membrane protein structure determined by NMR, in simulations in a lipid bilayer. Interestingly, the structure of the UCP2 protein was also determined by NMR spectroscopy in the presence of zwitterionic detergents.49 A further destabilizing feature of BM2 seemed to be the His27 residues, which were lipid-facing in the structure solved in detergent micelles and of which at least one rotated into the pore during all simulations, independent of the force field used (Supporting Information Figure S13). DPPC was chosen as a model membrane widely used in CGMD simulations and as a simple model of the high membrane order of the influenza viral membrane.50 However, it would be of interest in future studies to perform simulations using a range of more physiologically relevant lipid compositions to explore their effect on BM2.
Stability of BM2-TM in a DPPC Bilayer Compared with DHPC and DDM Micelles
Preliminary simulations performed of the solution NMR structure revealed that the conformational stability of the protein (measured as the degree of retention/loss of secondary structure over the course of the simulation) was reduced in DHPC compared to that in a bilayer. This was the case independent of temperature (300 and 323 K) and protonation state of the His27 residues (Supporting Information Figure S14). It is probable that the lateral pressure of the bilayer allowed the helices to pack more tightly, forming intersubunit contacts. The absence of this lateral pressure in the DHPC micelles allowed the helices to unfold before these contacts could be made. In order to simulate the NMR structure in a micelle environment, the structure of the TM domain following 10 ns equilibration in a DPPC bilayer (referred to as the “equilibrated NMR structure”) was chosen as the starting point for further simulations (Supporting Information Figure S14). All following simulations of the equilibrated NMR structure refer to those using the NMR structure from 10 ns of ATMD simulation time in the DPPC bilayer at 323 K as the starting structure. The structure and stability of the equilibrated NMR structure in each micelle environment was assessed in terms of the Cα root-mean-square deviation (RMSD) and α-helical content during simulation at two temperatures (Supporting Information Figure S15A). The structural drift during each simulation was comparable (Supporting Information Table S3). The smallest deviation from the equilibrated NMR structure was observed in the DHPC simulation at 300 K, closest to the experimental conditions in which the solution NMR structure was determined. A decline in the number of residues in α-helical conformation is observed in all simulations. The fluctuations of the protein show slight differences between the three environments.
PDCs Retain Features of Their “Parent” Detergent Micelles
The PDCs retain some of the features of their “parent” detergent-only micelles (Supporting Information Table S4). DHPC micelles are prolate both in the presence and in the absence of BM2. The architecture of the protein–DDM complex is similar to that of the DDM-only micelle. The maltose head groups are again seen to cluster slightly on the surface, as was observed in CGMD and ATMD simulations of the detergent-only micelle. To compare the DHPC and DDM micelle environments to that of the DPPC bilayer, density distribution plots of key protein residues and detergent components were calculated along the principal axis of the TM helix bundle (Figure 2). Several key differences may be seen upon comparison of the three density plots: (i) the protein sits asymmetrically within the DDM micelle such that the lysine and arginine residues are exposed to the water; (ii) a clear additional peak in the glycerol oxygen density is present in the DHPC micelle in the region of the lysine and arginine residues; and (iii) there is density attributable to the alkyl carbons of DHPC at the terminal regions of the protein. The differences between the distribution of the lipid/detergent head groups and alkyl tails were investigated further by generation of spatial distribution plots over the last 50 ns of simulation time for each system (Supporting Information Figure S16). In the case of DHPC, the presence of detergent molecule inserted into the pore at the N- and C-termini is evident from the density profile. This was also observed in the preliminary CG simulations in which DHPC self-assembled around BM2 and was seen to insert between the helices. In each case, the hydrophobic core of the protein is in contact with the hydrophobic lipid tails.
Figure 2.
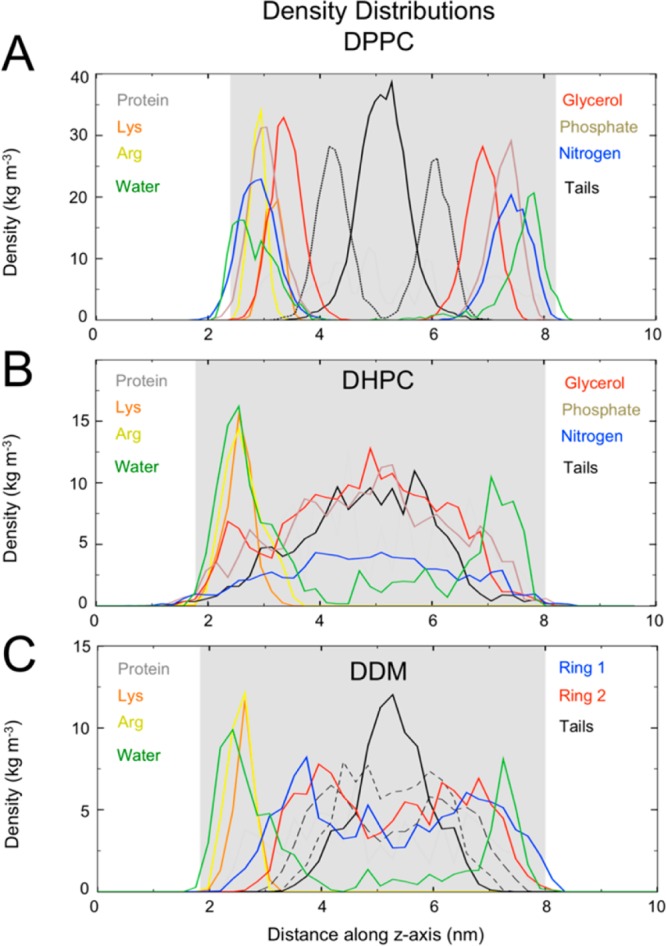
Density distribution plots of the (A) DPPC, (B) DHPC, and (C) DDM systems. The density was calculated at 500 intervals along the z-axis (corresponding to the bilayer normal or the protein principle axis of symmetry). The area shaded in gray corresponds to the region containing protein. Distributions for lysine and arginine residues are shown in orange and yellow, respectively. The nearest 100 water molecules to the protein are used in the calculation of water density. In (A), only the closest 150 lipids to the protein are included in calculations, and the density of the phosphorus atoms has been divided by 2 for clarity. In (A) and (B), only the first alkyl chain was used. The atoms used for calculating the tail’s density are the terminal and middle carbons for DPPC, the terminal carbon for DHPC, and the carbons at each end of the acyl tail and the middle carbon for DDM. In (C), the density Ring 1 corresponds to a single oxygen on the ring furthest from the acyl tail, and the Ring 2 density corresponds to the equivalent oxygen of the other glucose ring.
Protein–Detergent Interactions
Analysis of contacts between the lipid or detergent and protein (Figure 3) demonstrated similar patterns of contacts for the bilayer and the micelle systems. A comparison of protein–head group interactions for the three systems shows that most of the contacts made in the DPPC bilayer system are largely replicated within the DHPC micelle. In contrast, in the BM2–DDM complex, the C-terminal lysine and arginine residues were more exposed to water than those in a DHPC micelle or in the DPPC bilayer. This is presumably due to the inability of DDM to form salt bridges with charged residues, making increased solvation of these side chains possible. This contact analysis demonstrates that most of the contacts formed in a bilayer environment are fulfilled by the DHPC micelle environment (with some additional contacts), while for the DDM micelle, the hydrophobic core is shifted slightly toward the N-terminus, allowing charged residues in the C-terminal region to interact with water.
Figure 3.
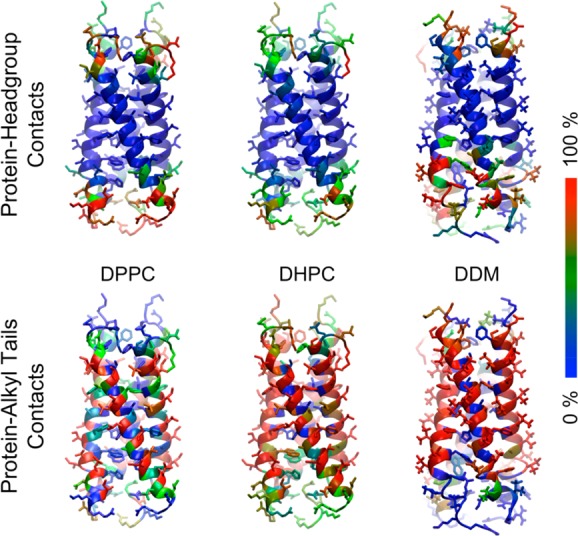
Lipid–detergent interactions per residue of the BM2 protein. Residues are colored according to time spent in contact with lipid/detergent head groups or tails during each simulation on a blue–green–red scale. Blue corresponds to 0% of simulation, green = 50% simulation time, and red = the residue is in contact with a lipid head group or tail for 100% of the simulation.
Binding Mode of DHPC Compared to DPPC and DDM
The most frequently occupied positions of the lipid/detergent tails over the final 10 ns of each simulation are shown in Figure 4. In the DPPC bilayer environment, the lipid tails around the BM2 protein tend to align parallel to the bilayer normal (i.e., parallel to the long axis of the protein). In the DHPC micelle, such a binding mode is not possible due to the shorter acyl chains. Instead, the majority of the DHPC tails are aligned perpendicular to the micelle surface, maximizing coverage of the hydrophobic surface of the protein. In the DDM micelle, those hydrophobic tails close to the protein surface tend to align in a similar manner to the tails of DPPC. However, the shorter length of the DDM tail means that two detergent molecules with extended carbon tails are not sufficient to cover the hydrophobic surface, and therefore, slightly more distant detergent molecules align such that the termini of their alkyl chains are directed toward the protein surface. Plots of SCD for DDM provide a means to quantify this picture of lipid orientation (Supporting Information Figure S17). To determine if any conserved interaction sites between the protein and the lipid/detergent acyl tails exist, the two most similar protein conformations of BM2-TM in DPPC and DDM were chosen for comparison. The average positions of the DPPC and DDM tails over a 10 ns period of the trajectories were superimposed and are shown in Figure 5. An example of the tail of a DDM molecule occupying the same region of the protein surface as the DPPC lipid is highlighted.
Figure 4.
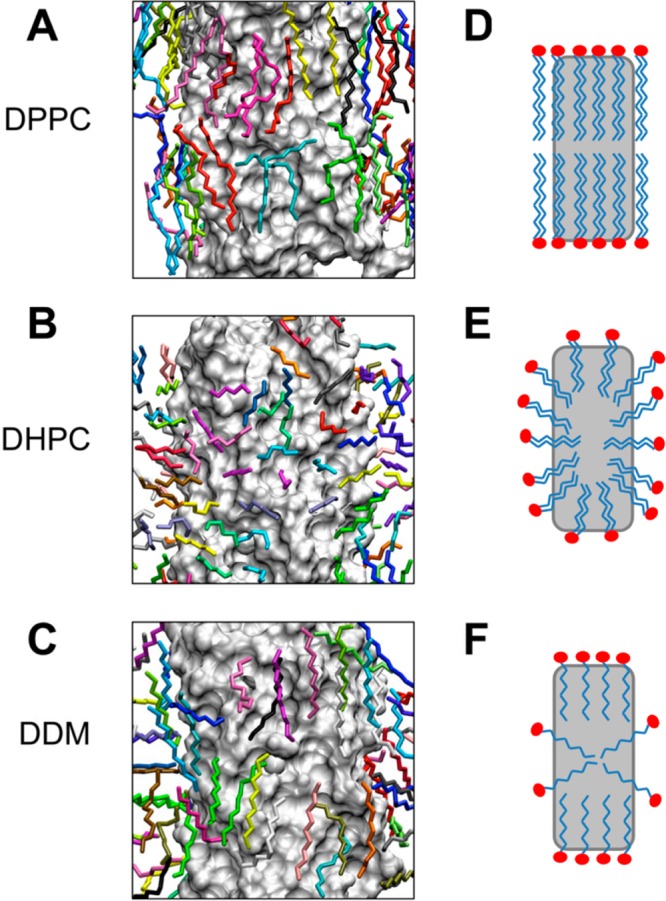
Lipid/detergent binding modes to the BM2 protein in the DPPC bilayer (A,D), DHPC micelle (B,E), and DDM micelle (C,F) simulations. In A–C, the protein is displayed as a gray surface. Alkyl tails of the lipids/detergents are shown in stick representation (colored per molecule). The positions of the tails are the average positions adopted over the final 10 ns of each simulation performed at 323 K. Corresponding cartoons of the modes of interaction are shown in D–F.
Figure 5.
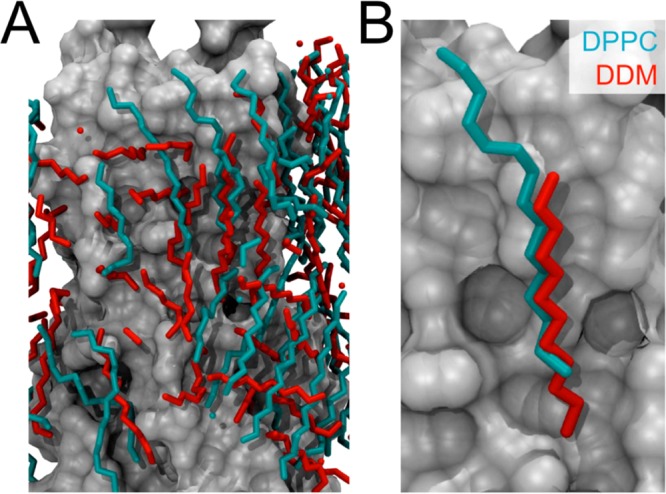
Interaction of acyl tails of DPPC and DDM with the protein surface. (A) Superimposition of the most highly occupied positions of the alkyl tails of DPPC (cyan) and DDM (red) tails during 10 ns of each simulation (see text for details). (B) An example of the same region on the protein surface occupied by an alkyl tail in the two different simulations. The protein is displayed as a gray surface in each case.
Detergent Dynamics
Visual inspection of the trajectories suggested that the DHPC molecules are more dynamic than their DDM and DPPC counterparts. A direct comparison of diffusion coefficients of lipid molecules in a bilayer compared to detergent molecules in a micelle would be difficult to interpret because (i) the lipids in a bilayer are effectively restricted to lateral motion, whereas in a micellar system, the detergent molecules can potentially sample a spherical region, and (ii) the bilayer patch in question (∼300 lipids) may not be large enough to avoid conserved motion of lipids between periodic images.51 Therefore, rather than attempt to compare diffusion coefficients of each lipid or detergent molecule, the space sampled by individual lipid and detergent molecules within 6 Å of the protein was calculated for each of the trajectories (Figure 6). The spatial distributions indicate that the DHPC complex is consistent with the picture of micelles being highly dynamic species.3 However, DDM and DPPC have similar spatial distributions. The DPPC and DHPC head groups are identical; therefore, the higher mobility of DHPC may be attributed to the shorter tail lengths of DHPC, leading to differing binding modes. To allow a quantitative comparison, analysis of detergent MSDs (mean-square deviations) over the final 10 ns of the trajectory yielded diffusion coefficients of 7 (±1) × 10 –7 cm2 s–1 (DHPC) and 0.4 (±0.1) × 10–7 cm2 s–1 (DDM).
Figure 6.

Spatial distribution plots of five representative lipid/detergent molecules within 6 Å of the protein for each environment. The initial position of each lipid or detergent molecule is shown in stick representation, and the resultant spatial distributions are shown as colored dots. The lipid/detergent molecules in the DPPC and DDM simulations move to a comparable extent during the simulation, while those in the DHPC simulation sample a far greater volume of space.
N-Terminal Region of the Pore Remains Hydrated
The highly mobile nature of the DHPC micelle might be expected to affect the degree of water penetration into the hydrophobic core. To assess if this was the case, calculations of the SASA of the protein were performed for each environment, and the average SASA per residue over the final 10 ns of simulation time is shown in Supporting Information Figure S18. The low protein SASA is largely maintained in the hydrophobic TM region. Radial density distribution plots of the water position relative to the protein over the simulations are shown in Supporting Information Figure S19. These highlight the hydrophobic band around the protein, where no water is present in either of the micelle simulations. It is evident that there is water density within the protein pore in each case, with no clear distinction between the N-terminal region of the pore in the three environments. This is consistent with our previous study of a self-assembled BM2 tetramer,52 as well as a recent simulation study of the BM2 NMR structure.53
Conclusions
The results of this work enable comparisons to be made between three types of environment for a membrane protein: a simple model phospholipid (DPPC) lipid bilayer, small zwitterionic detergent (DHPC) micelles used in solution NMR experiments, and nonionic, larger detergent (DDM) micelles commonly used in protein purification and X-ray crystallography.
We have shown that both detergent types fulfilled the hydrophobic and polar contacts that are present in a lipid bilayer. However, DHPC was observed to form additional “non-native” interactions with the protein, in which the hydrophobic tail inserted into the pore region of BM2. Thus, DDM appeared to better mimic the interaction of the protein with bilayer phospholipids than did DHPC, even though DHPC and DPPC share the same zwitterionic head groups. This reflects the alignment of DDM tails in grooves on the protein surface in a similar fashion to those of DPPC. This mode of interaction may help to explain the successful use of DDM and related detergents in mimicking the lipid bilayer in a number of crystallographic structure determinations.45 The binding modes of detergents within the protein–detergent complexes may be related to the properties of the “parent” pure detergent micelles, providing further evidence that the nature of a membrane–protein complex does not necessarily depend on the head group type of the lipid used but rather on the geometric properties of the detergent micelle.46 The presence of monomeric DHPC in solution (due to the higher critical micelle concentration of DHPC compared to that of DDM, DPPC, and other lipids) is potentially a reason for concern as DHPC monomers were observed to form “nonphysiological” interactions with regions of the protein that would not be accessible to lipids within a bilayer.
It is informative to reflect on the methods employed in this study. Different methods for generating initial PDCs were found to be more appropriate for each detergent type. Although it would be ideal to employ a single method for all detergent types, the development of sugar head group parameters for the MARTINI force field is relatively new,31 and further studies are required to fully investigate the simulation conditions required to fully satisfy available experimental data. For example, in studies of DHPC, it has been suggested that the use of a MARTINI polarizable water model is important in replicating experimental results for zwitterionic detergents. It will be of interest to develop similar studies on DDM and related detergents commonly used in membrane protein solubilization.
In summary, the BM2-TM channel was shown to exhibit a degree of sensitivity to its lipid/detergent environment. In particular, helix packing interactions could be perturbed by the presence of certain detergent molecules. The results of these simulations indicate that BM2 (like the related A/M2 protein) may exhibit a range of conformations due to the relative malleability of the helix–helix packing interactions and their sensitivity to their environment. It is likely that the conformational flexibility of these “simple” viral ion channels (or viroporins47) may be related to their functional dynamics, in particular, channel gating.
Acknowledgments
The authors thank J. Schnell, F. Fraternali, J. Goose, P. Fowler, P. Stansfeld, D. Durand, and P. Vachette for helpful discussion. This work was supported by the following grants: ScalaLife (EU), CCPBioSim (EPSRC); The Wellcome Trust; and BBSRC.
Glossary
Abbreviations
- MD
molecular dynamics
- CG
coarse-grained
- AT
atomistic
- DHPC
dihexanoylphosphatidylcholine
- DDM
n-dodecyl-β-d-maltoside
- DPPC
dipalmitoylphosphatidylcholine
- PDC
protein–detergent complex
- SASA
solvent-accessible surface area
- SAXS
small-angle X-ray scattering
- NMR
nuclear magnetic resonance
Supporting Information Available
19 Figures and 4 Tables. Figure S1: DHPC micelles are prolate; Figure S2: snapshots showing self-assembly of DHPC monomers into micelles; Table S1: properties of DHPC micelles calculated from experimental data and from MD simulation; Figure S3: ATMD and CGMD self-assembly simulations of the BM2–DDM complex; Figure S4: CGMD simulation of the preformed DDM micelle; Table S2: properties of DDM micelles from experiment and MD simulation; Figure S5: self-assembly of the BM2–DHPC complex; Figure S6: solvent-accessible surfaces of BM2; Figure S7: equilibration of the protein–detergent complex; Figure S8: snapshots of the BM2–DDM complex formation; Figure S9: properties of the system during BM2–DDM initial association and subsequent rearrangement; Figure S10: final BM2–DDM complexes following 1 μs CGMD simulation; Figure S11: simulations of BM2-TM in a DPPC bilayer; Figure S12: collapse of the BM2-TM pore; Figure S13: rotation of His27 residues; Figure S14: e of the solution NMR structure of the BM2-TM domain; Figure S15: stability and dynamics of the equilibrated NMR structure in different environments; Table S3: details of protein stability during simulations; Table S4: protein–detergent complexes retain geometry of parent micelles; Figure S16: spatial distributions of lipid/detergent head groups and tails; Figure S17: DDM and DHPC acyl chain order parameters SCD; Figure S18: averaged solvent-accessible surface area over the chain and the last 10 ns of each simulation; Figure S19: radial density plots of water; and additional references. This material is available free of charge via the Internet at http://pubs.acs.org.
Author Present Address
† S.L.R.: Centre for Structural Biology, Department of Life Sciences, Imperial College London, Level 6 Sir Ernst Chain Building, South Kensington, London SW7 2AZ.
Author Contributions
The manuscript was written through contributions of all authors. All authors have given approval to the final version of the manuscript.
The authors declare no competing financial interest.
Supplementary Material
References
- Stouffer A. L.; Acharya R.; Salom D.; Levine A. S.; Di Costanzo L.; Soto C. S.; Tereshko V.; Nanda V.; Stayrook S.; DeGrado W. F. Structural Basis for the Function and Inhibition of an Influenza Virus Proton Channel. Nature 2008, 451, 596–599. [DOI] [PMC free article] [PubMed] [Google Scholar]
- Schnell J. R.; Chou J. J. Structure and Mechanism of the M2 Proton Channel of Influenza A Virus. Nature 2008, 451, 591–595. [DOI] [PMC free article] [PubMed] [Google Scholar]
- Claridge J. K.; Aittoniemi J.; Cooper D. M.; Schnell J. R. Isotropic Bicelles Stabilize the Juxtamembrane Region of the Influenza M2 Protein for Solution NMR Studies. Biochemistry 2013, 52, 8420–8429. [DOI] [PubMed] [Google Scholar]
- Sharma M.; Yi M.; Dong H.; Qin H.; Peterson E.; Busath D. D.; Zhou H.-X.; Cross T. A. Insight into the Mechanism of the Influenza A Proton Channel from a Structure in a Lipid Bilayer. Science 2010, 330, 509–512. [DOI] [PMC free article] [PubMed] [Google Scholar]
- Cross T. A.; Sharma M.; Yi M.; Zhou H.-X. Influence of Solubilizing Environments on Membrane Protein Structures. Trends Biochem. Sci. 2011, 36, 117–125. [DOI] [PMC free article] [PubMed] [Google Scholar]
- Zhou H.-X.; Cross T. A. Influences of Membrane Mimetic Environments on Membrane Protein Structures. Annu. Rev. Biophys. 2013, 42, 361–392. [DOI] [PMC free article] [PubMed] [Google Scholar]
- Stansfeld P. J.; Sansom M. S. P. Molecular Simulation Approaches to Membrane Proteins. Structure 2011, 19, 1562–1572. [DOI] [PubMed] [Google Scholar]
- Bond P. J.; Sansom M. S. P. Membrane Protein Dynamics versus Environment: Simulations of OmpA in a Micelle and in a Bilayer. J. Mol. Biol. 2003, 329, 1035–1053. [DOI] [PubMed] [Google Scholar]
- Rouse S. L.; Marcoux J.; Robinson C. V.; Sansom M. S. P. Dodecyl Maltoside Protects Membrane Proteins in Vacuo. Biophys. J. 2013, 105, 648–656. [DOI] [PMC free article] [PubMed] [Google Scholar]
- Brocos P.; Mendoza-Espinosa P.; Castillo R.; Mas-Oliva J.; Piñeiro Á. Multiscale Molecular Dynamics Simulations of Micelles: Coarse-Grain for Self-Assembly and Atomic Resolution for Finer Details. Soft Matter 2012, 8, 9005. [Google Scholar]
- Khelashvili G.; LeVine M. V.; Shi L.; Quick M.; Javitch J. A.; Weinstein H. The Membrane Protein LeuT in Micellar Systems: Aggregation Dynamics and Detergent Binding to the S2 Site. J. Am. Chem. Soc. 2013, 135, 14266–14275. [DOI] [PMC free article] [PubMed] [Google Scholar]
- Mould J. A.; Paterson R. G.; Takeda M.; Ohigashi Y.; Venkataraman P.; Lamb R. A.; Pinto L. H. Influenza B Virus BM2 Protein Has Ion Channel Activity That Conducts Protons across Membranes. Dev. Cell 2003, 5, 175–184. [DOI] [PubMed] [Google Scholar]
- Paterson R. G.; Takeda M.; Ohigashi Y.; Pinto L. H.; Lamb R. A. Influenza B Virus BM2 Protein Is an Oligomeric Integral Membrane Protein Expressed at the Cell Surface. Virology 2003, 306, 7–17. [DOI] [PubMed] [Google Scholar]
- Cross T. A. Flu BM2 Structure and Function. Nat. Struct. Mol. Biol. 2009, 16, 1207–1209. [DOI] [PMC free article] [PubMed] [Google Scholar]
- Wang J.; Pielak R. M.; McClintock M. A.; Chou J. J. Solution Structure and Functional Analysis of the Influenza B Proton Channel. Nat. Struct. Mol. Biol. 2009, 16, 1267–1271. [DOI] [PMC free article] [PubMed] [Google Scholar]
- Raman P.; Cherezov V.; Caffrey M. The Membrane Protein Data Bank. Cell. Mol. Life Sci. 2006, 63, 36–51. [DOI] [PMC free article] [PubMed] [Google Scholar]
- Cheng X.; Jo S.; Lee H. S.; Klauda J. B.; Im W. CHARMM-GUI Micelle Builder for Pure/Mixed Micelle and Protein/Micelle Complex Systems. J. Chem. Inf. Model. 2013, 53, 2171–2180. [DOI] [PubMed] [Google Scholar]
- O’Mara M. L.; Mark A. E. The Effect of Environment on the Structure of a Membrane Protein: P-Glycoprotein under Physiological Conditions. J. Chem. Theory Comput. 2012, 8, 3964–3976. [DOI] [PubMed] [Google Scholar]
- Rodríguez-Ropero F.; Fioroni M. Structural and Dynamical Analysis of an Engineered FhuA Channel Protein Embedded into a Lipid Bilayer or a Detergent Belt. J. Struct. Biol. 2012, 177, 291–301. [DOI] [PubMed] [Google Scholar]
- Choutko A.; Glättli A.; Fernández C.; Hilty C.; Wüthrich K.; van Gunsteren W. F. Membrane Protein Dynamics in Different Environments: Simulation Study of the Outer Membrane Protein X in a Lipid Bilayer and in a Micelle. Eur. Biophys. J. 2011, 40, 39–58. [DOI] [PubMed] [Google Scholar]
- Cuthbertson J. M.; Bond P. J.; Sansom M. S. P. Transmembrane Helix–Helix Interactions: Comparative Simulations of the Glycophorin a Dimer. Biochemistry 2006, 45, 14298–14310. [DOI] [PubMed] [Google Scholar]
- Patargias G.; Bond P. J.; Deol S. S.; Sansom M. S. P. Molecular Dynamics Simulations of GlpF in a Micelle vs in a Bilayer: Conformational Dynamics of a Membrane Protein as a Function of Environment. J. Phys. Chem. B 2005, 109, 575–582. [DOI] [PubMed] [Google Scholar]
- Cheng X.; Im W. NMR Observable-Based Structure Refinement of DAP12-NKG2C Activating Immunoreceptor Complex in Explicit Membranes. Biophys. J. 2012, 102, L27–9. [DOI] [PMC free article] [PubMed] [Google Scholar]
- Lipfert J.; Columbus L.; Chu V. B.; Lesley S. A.; Doniach S. Size and Shape of Detergent Micelles Determined by Small-Angle X-ray Scattering. J. Phys. Chem. B 2007, 111, 12427–12438. [DOI] [PubMed] [Google Scholar]
- Hess B.; Kutzner C.; van der Spoel D.; Lindahl E. GROMACS 4: Algorithms for Highly Efficient, Load-Balanced, and Scalable Molecular Simulation. J. Chem. Theory Comput. 2008, 4, 435–447. [DOI] [PubMed] [Google Scholar]
- Otomo K.; Toyama A.; Miura T.; Takeuchi H. Interactions between Histidine and Tryptophan Residues in the BM2 Proton Channel from Influenza B Virus. J. Biochem. 2009, 145, 543–554. [DOI] [PubMed] [Google Scholar]
- Otomo K.; Toyama A.; Miura T.; Takeuchi H. Interactions between Histidine and Tryptophan Residues in the BM2 Proton Channel from Influenza B Virus.. J. Biochem. 2009, 145, 543–554. [DOI] [PubMed] [Google Scholar]
- Domański J.; Stansfeld P. J.; Sansom M. S. P.; Beckstein O. Lipidbook: A Public Repository for Force-Field Parameters Used in Membrane Simulations. J. Membr. Biol. 2010, 236, 255–258. [DOI] [PubMed] [Google Scholar]
- Michaud-Agrawal N.; Denning E. J.; Woolf T. B.; Beckstein O. MDAnalysis: A Toolkit for the Analysis of Molecular Dynamics Simulations. J. Comput. Chem. 2011, 32, 2319–2327. [DOI] [PMC free article] [PubMed] [Google Scholar]
- Humphrey W.; Dalke A.; Schulten K. VMD: Visual Molecular Dynamics. J. Mol. Graphics 1996, 1433–3827–28. [DOI] [PubMed] [Google Scholar]
- Marrink S. J.; Risselada H. J.; Yefimov S.; Tieleman D. P.; de Vries A. H. The MARTINI Force Field: Coarse Grained Model for Biomolecular Simulations. J. Phys. Chem. B 2007, 111, 7812–7824. [DOI] [PubMed] [Google Scholar]
- López C. A.; Rzepiela A. J.; de Vries A. H.; Dijkhuizen L.; Hünenberger P. H.; Marrink S. J. Martini Coarse-Grained Force Field: Extension to Carbohydrates. J. Chem. Theory Comput. 2009, 5, 3195–3210. [DOI] [PubMed] [Google Scholar]
- Stansfeld P. J.; Sansom M. S. P. From Coarse Grained to Atomistic: A Serial Multiscale Approach to Membrane Protein Simulations. J. Chem. Theory Comput. 2011, 7, 1157–1166. [DOI] [PubMed] [Google Scholar]
- Ulmschneider J. P.; Ulmschneider M. B. United Atom Lipid Parameters for Combination with the Optimized Potentials for Liquid Simulations All-Atom Force Field. J. Chem. Theory Comput. 2009, 5, 1803–1813. [DOI] [PubMed] [Google Scholar]
- Kaminski G. A.; Friesner R. A.; Tirado-Rives J.; Jorgensen W. L. Evaluation and Reparametrization of the OPLS-AA Force Field for Proteins via Comparison with Accurate Quantum Chemical Calculations on Peptides. J. Phys. Chem. B 2001, 105, 6474–6487. [Google Scholar]
- Schuler L. D.; Daura X.; Van Gunsteren W. F. An Improved GROMOS96 Force Field for Aliphatic Hydrocarbons in the Condensed Phase. J. Comput. Chem. 2001, 22, 1205–1218. [Google Scholar]
- Darden T.; York D.; Pedersen L. Particle Mesh Ewald: An N·log(N) Method for Ewald Sums in Large Systems. J. Chem. Phys. 1993, 98, 10089. [Google Scholar]
- Parrinello M. Polymorphic Transitions in Single Crystals: A New Molecular Dynamics Method. J. Appl. Phys. 1981, 52, 7182. [Google Scholar]
- Martínez L.; Andrade R.; Birgin E. G.; Martínez J. M. PACKMOL: A Package for Building Initial Configurations for Molecular Dynamics Simulations. J. Comput. Chem. 2009, 30, 2157–2164. [DOI] [PubMed] [Google Scholar]
- Böckmann R. A.; Caflisch A. Spontaneous Formation of Detergent Micelles around the Outer Membrane Protein OmpX. Biophys. J. 2005, 88, 3191–3204. [DOI] [PMC free article] [PubMed] [Google Scholar]
- Abel S.; Sterpone F.; Bandyopadhyay S.; Marchi M. Molecular Modeling and Simulations of AOT–Water Reverse Micelles in Isooctane: Structural and Dynamic Properties. J. Phys. Chem. B 2004, 108, 19458–19466. [Google Scholar]
- Abel S.; Dupradeau F.-Y.; Raman E. P.; MacKerell A. D.; Marchi M. Molecular Simulations of Dodecyl-β-Maltoside Micelles in Water: Influence of the Headgroup Conformation and Force Field Parameters. J. Phys. Chem. B 2011, 115, 487–499. [DOI] [PMC free article] [PubMed] [Google Scholar]
- Kraft J. F.; Vestergaard M.; Schiøtt B.; Thøgersen L. Modeling the Self-Assembly and Stability of DHPC Micelles Using Atomic Resolution and Coarse Grained MD Simulations. J. Chem. Theory Comput. 2012, 8, 1556–1569. [DOI] [PubMed] [Google Scholar]
- Warshel A.; Kato M.; Pisliakov A. V. Polarizable Force Fields: History, Test Cases, and Prospects. J. Chem. Theory Comput. 2007, 3, 2034–2045. [DOI] [PubMed] [Google Scholar]
- Le Maire M.; Champeil P.; M?ller J. V. Interaction of Membrane Proteins and Lipids with Solubilizing Detergents. Biochim. Biophys. Acta 2000, 1508, 86–111. [DOI] [PubMed] [Google Scholar]
- Ivashyna O.; García-Sáez A. J.; Ries J.; Christenson E. T.; Schwille P.; Schlesinger P. H. Detergent-Activated BAX Protein Is a Monomer. J. Biol. Chem. 2009, 284, 23935–23946. [DOI] [PMC free article] [PubMed] [Google Scholar]
- Columbus L.; Lipfert J.; Jambunathan K.; Fox D. A.; Sim A. Y. L.; Doniach S.; Lesley S. A. Mixing and Matching Detergents for Membrane Protein NMR Structure Determination. J. Am. Chem. Soc. 2009, 131, 7320–7326. [DOI] [PMC free article] [PubMed] [Google Scholar]
- Zoonens M.; Comer J.; Masscheleyn S.; Pebay-Peyroula E.; Chipot C.; Miroux B.; Dehez F. Dangerous Liaisons between Detergents and Membrane Proteins. The Case of Mitochondrial Uncoupling Protein 2. J. Am. Chem. Soc. 2013, 135, 15174–15182. [DOI] [PubMed] [Google Scholar]
- Berardi M. J.; Shih W. M.; Harrison S. C.; Chou J. J. Mitochondrial Uncoupling Protein 2 Structure Determined by NMR Molecular Fragment Searching. Nature 2011, 476, 109–113. [DOI] [PMC free article] [PubMed] [Google Scholar]
- Gerl M. J.; Sampaio J. L.; Urban S.; Kalvodova L.; Verbavatz J.-M.; Binnington B.; Lindemann D.; Lingwood C. A.; Shevchenko A.; Schroeder C.; et al. Quantitative Analysis of the Lipidomes of the Influenza Virus Envelope and MDCK Cell Apical Membrane. J. Cell Biol. 2012, 196, 213–221. [DOI] [PMC free article] [PubMed] [Google Scholar]
- Klauda J. B.; Brooks B. R.; Pastor R. W. Dynamical Motions of Lipids and a Finite Size Effect in Simulations of Bilayers. J. Chem. Phys. 2006, 125, 144710. [DOI] [PMC free article] [PubMed] [Google Scholar]
- Rouse S. L.; Carpenter T.; Stansfeld P. J.; Sansom M. S. P. Simulations of the BM2 Proton Channel Transmembrane Domain from Influenza Virus B. Biochemistry 2009, 48, 9949–9951. [DOI] [PubMed] [Google Scholar]
- Zhang Y.; Shen H.; Zhang M.; Li G. Exploring the Proton Conductance and Drug Resistance of BM2 Channel through Molecular Dynamics Simulations and Free Energy Calculations at Different pH Conditions. J. Phys. Chem. B 2013, 117, 982–988. [DOI] [PubMed] [Google Scholar]
Associated Data
This section collects any data citations, data availability statements, or supplementary materials included in this article.