Abstract
Maxillary hypoplasia occurs due to insufficient maxillary intramembranous ossification, leading to poor dental occlusion, respiratory obstruction and cosmetic deformities. Conditional deletion of Jagged1 (Jag1) in cranial neural crest (CNC) cells using Wnt1-cre; Jagged1f/f (Jag1CKO) led to maxillary hypoplasia characterized by intrinsic differences in bone morphology and density using μCT evaluation. Jag1CKO maxillas had altered collagen deposition, delayed ossification, and reduced expression of early and late determinants of osteoblast development during maxillary ossification. In vitro bone cultures on Jag1CKO mouse embryonic maxillary mesenchymal (MEMM) cells demonstrated decreased mineralization that was also associated with diminished induction of osteoblast determinants. BMP receptor expression was dysregulated in the Jag1CKO MEMM cells suggesting that these cells were unable to respond to BMP-induced differentiation. JAG1-Fc rescued in vitro mineralization and osteoblast gene expression changes. These data suggest that JAG1 signaling in CNC-derived MEMM cells is required for osteoblast development and differentiation during maxillary ossification.
Keywords: maxillary hypoplasia, Jagged1, cranial neural crest, mesenchymal cells, osteoblasts, ossification, bone morphogenic protein, osteogenesis, osteoporosis, osteosclerosis
2.1 Introduction
Craniofacial bone development occurs through intramembranous ossification via direct osteoblast differentiation of neural crest derived mesenchyme [1]. Maxillary hypoplasia arises when the upper jaw fails to elongate, causing an outwardly–visible sunken appearance to the mid-face which affects mastication, respiration, and communication. Costly and invasive corrective surgery is the only clinical option to treat this debilitating condition accounting for more than an estimated 76.5 million dollars in annual medical costs. Thus there is a significant need to characterize normal and pathologic maxillary development to provide a mechanism-based understanding necessary to identify novel therapeutic targets to potentially prevent and/or treat maxillary hypoplasia.
Although the cause of maxillary hypoplasia is likely multifactorial, it can manifest from intrinsic growth deficiency seen in humans with Alagille syndrome (JAG1 and NOTCH mutations) [2, 3]. As such, our overarching hypothesis is that the JAG1-NOTCH pathway is necessary and essential for maxillary development. In support, we have previously reported a mouse model of post-natal maxillary hypoplasia in Jag1f/f; Wnt1-cre+ conditional knockouts (Jag1CKOs) caused by intrinsic maxillary growth deficiencies that result in death by P21 due to starvation from the inability to masticate [4]. The JAG1-NOTCH signaling axis plays critical roles during bony development and maintenance; however, there are conflicting reports on the inhibitory or inductive potential of the NOTCH pathway during osteoblastogenesis [5-10]. JAG1 is a transmembrane bound ligand that binds NOTCH receptors (NOTCH1-4) inducing cell fate, proliferation/apoptosis, and differentiation [11]. Once ligand is bound, the NOTCH intracellular domain (NICD) is cleaved by γ-secretase and transclocated to the nucleus to associate with transcription factors Recombining binding protein suppressor of hairless (RBPJ) and Mastermind-like (MAML). This interaction directly up-regulates the expression of transcription factors Hairy/Enhancer of Split (HES) and HES-related genes (HEY, CHF, HRT,HESR) [12] which modulate down-stream canonical Notch signaling. Hence, the purpose of this work was to determine the role of canonical JAG1 signaling during maxillary osteoblast development and identify critical down-stream targets of this pathway that could explain our observed maxillary hypoplasia phenotype.
Through complementary in vivo and in vitro experiments we reveal that intrinsic differences during development and post-natal growth of the Jag1CKO maxillary bone are associated with the inability of maxillary mesenchymal cells to undergo osteoblast differentiation and mineralization. The addition of JAG1-Fc restored Jag1CKO mesenchymal cell responsiveness to osteogenic media in vitro, confirming the necessity of JAG1 for osteoblast development. These results are the first to reveal a unique model of maxillary hypoplasia that allows the study of maxillary intramembranous ossification in the context of cell-autonomous JAG1 signaling both during embryonic development and the early stages of post-natal maturation.
3.1 Materials and Methods
3.1.1 Murine Model
Jag1CKO mice were generated as previously described [4]. Wnt1-cre mice were obtained from Jax labs and Jag1f/f were a gift from Dr. Kathleen Loomes [13-15]. Jag1f/f; Wnt1-cre− (control) and Jag1f/f;Wnt1-cre+ (Jag1CKO) mice were analyzed at E14, E16, E18, and P14 via timed pregnancies. All procedures and protocols were done in accordance with a Vanderbilt IACUC approved protocol.
3.1.2 Micro-computed tomography
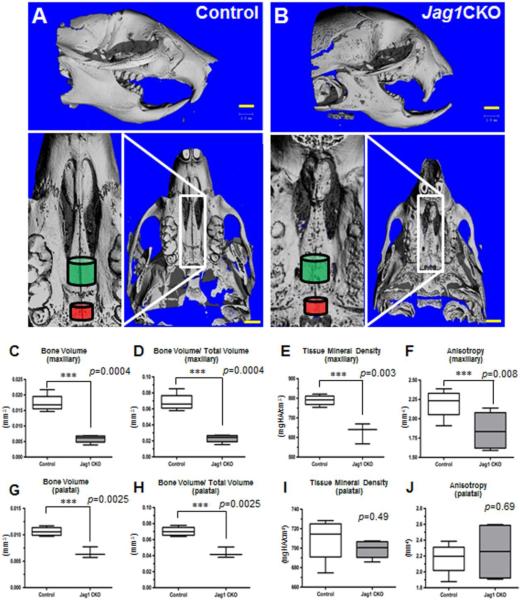
Control and Jag1CKO mice were sacrificed by CO2 inhalation at P14. The skull was placed in 10% formalin for 24 hours and bone properties were determined using micro-computed tomography (μCT). Skulls were loaded into standard μCT tubes (diameter 12.3 mm) and aligned with the scanning axis of a μCT apparatus (Scanco μCT-40 Medical; Switzerland). Subsequent to identifying the region of interest from a scout scan data was acquired at a resolution of 12 μm voxels (isotropic) with projections every 1° through 180° at unvarying X-ray source settings (55 kEV and 145 uA). Through algorithms provided by Scanco, data was determined as bone volume, bone fraction volume, bone tissue mineral density, and anisotropy. Analysis was targeted at two different anatomic areas of the skull, anterior and posterior portions of the maxilla (Figure 1A and 1B: green and red cylinders), in both control and Jag1CKO mice.
Figure 1. Jagged1 is required for maxillary development.
μCT was used to visualize the post-natal maxilla in control (A) and Jag1CKO (B) P14 mice. Jag1 CKO mice had a significantly shorter maxilla when compared to control mice with no difference in the length of the mandible. Compositional and structural properties of Jag1CKO's maxillary (green cylinder) and palatine (red cylinder) bones were measured and compared to controls (C-J). n=3; ***=p<0.05.
3.1.3 Tissue preparation
Embryos were harvested at E14, E16, and E18, genotyped, and processed as previously described [4]. Briefly, heads were fixed in 4% paraformaldehyde (PFA) for 30 minutes to 1 hour and frozen in optimal cutting temperature (OCT) media after sucrose dehydration. All staining was performed 8 μm thick coronal sections that were thawed and rehydrated in phosphate buffered saline (PBS).
3.1.4 In vivo ossification
Tri chrome
Slides were fixed in 4% PFA for 10 minutes followed by 2 washes in PBS for 5 minutes each and washed in running dH2O for 5 minutes. Slides were then incubated in Weigerts Hematoxylin for 5 minutes followed by a 5 minute rinse in running dH2O. Sections were dehydrated in 1% HCl/70% EtOH for 5 minutes and rinsed in running dH2O for 5 minutes followed by several rinses in 95% EtOH. Without letting the slides dry, working maritus yellow solution was applied for 2 minutes followed by several changes in running dH2O. Slides were incubated in working crystal ponceau 6R for 10 minutes, rinsed in dH2O, incubated in 1% phosphotungstic acid for 5-10 minutes, and rinsed in dH2O. Methyl blue solution was applied for 2-5 minutes followed by dH2O rinse. Slides were finally dehydrated, cleared, and cover-slipped with clear mounting media.
Von Kossa
Slides were fixed in 4% PFA for 10 minutes followed by 2 washes in PBS for 5 minutes each and washed in running dH2O for 5 minutes. Slides were incubated in a 5% silver nitrate solution in bright sunlight or under 60-watt lamp for 1 hour or until calcium turns black, and subsequently rinsed in 3 changes of dH2O. Next, 5% Hypo (sodium thiosulfate) solution is applied for 5 minutes and slides are rinsed in dH2O. Slides were then incubated with nuclear fast red for 5 minutes and rinsed in dH2O. Slides were finally dehydrated, cleared, and cover-slipped with clear mounting media.
Quantification of ossified areas
Image J software was used to calculate the areas of ossification both anteriorly and posteriorly in stained sections from 3 embryos of control and Jag1CKO mice at E14, E16, and E18.
3.1.5 Immunofluorescence
After allowing slides to dry at room temperature for 15 minutes, slides were fixed in acetone (−80°C) for 5 minutes and allowed to dry for 8 minutes. Slides were washed 3 times in PBS for 3-5 minutes each wash and permeabilized in 3 successive changes of 0.1% Tween-20 for 3-5 minutes. Sections were blocked with 10% donkey serum for 1 hour at room temperature and incubated with primary antibodies: CD-31 (BD Pharmingen) and RUNX2 (Abcam) diluted in 1% donkey serum overnight at 4°C. The following day the slides are washed with PBS followed by 0.1% Tween-20 as previously stated and incubated with secondary antibodies (Invitrogen) for 1 hour at room temperature. Finally they are washed in PBS followed by dH2O and counterstained with hard mount DAPI (Vectastain).
All imaging was performed on a Nikon E800 microscope, and images were obtained with SPOT imaging software (Diagnostic Instruments, Inc.).
3.1.6 qPCR
To determine changes in gene expression, we used qPCR as previously described [16]. Total RNA was isolated using the TRIzol reagent (Invitrogen) according to the manufacturer's protocol. cDNA was generated from 1 μg total RNA using oligo-dT primers and Superscript III polymerase (Invitrogen). Primer pairs are shown in Table 1. Real-time PCR analysis was done with iQ SYBR green supermix (Bio-Rad) in the Bio-Rad iCycler for 40 cycles. The expression levels are calculated using the ΔΔCT method. The threshold cycle (CT) represents the PCR cycle at which an increase of the reporter fluorescence above the baseline is first detected. The fold change in expression levels, R, is calculated as follows: R=2−ΔΔCT (where R = 2 (ΔCT treated-ΔCT control)) to normalize the abundance of all transcripts to the level of GAPDH RNA expression.
Table 1.
qPCR primer sequences
| Gene | Sense Primer (5’→3’) | Anti-sense Primer (5’→3’) |
|---|---|---|
| GAPDH | ATGACAATGAATACGGCTACAG | TCTCTTGCTCAGTGTCCTTG |
| RUNX2 | CCCAGCCACCTTTACCTACA | TATGGAGTGCTGCTGGTCTG |
| Osterix | ATCTTCCACTTCGCCTGC | AACCAATGGGTCCAGCAC |
| Collagen 1 | CACCCTCAAGAGCCTGAGTC | GTTCGGGCTGATGTACCAGT |
| Alk Phos | GCTGATCATTCCCACGTTTT | CTGGGCCTGGTAGTTGTTGT |
| Osteocalcin | TGCTTGTGACGAGCTATCAG | GAGGACAGGGAGGATCAAGT |
| Jagged1 | GGGAGAGTGATACTTGATGGG | CTCATTGTGGCTTTTGTGGAG |
| Notch1 | ATGTCAATGTTCGAGGACCAG | CTGGATGAGGTTACCGATAG |
| Notch4 | TGTGAAATCCCTCTAACCTGC | TCTGAGTCTTCCCCTTCTGG |
| RBPJ | GACCCTGTATCACAACTCCAC | GAAGCTCCATCGTTTATCATTTCC |
| Hes1 | CCGAGCGTGTTGGGGAAATAC | GTTGATCTGGGTCATGCAGTTGG |
| Hey1 | TGAGCTGAGAAGGCTGGTAC | ACCCCAAACTCCGATAGTCC |
| BMP2 | TTATCAGGACATGGTTGTGGAG | GGGAAATATTAAAGTGTCAGCTGG |
| BMP4 | GTAGTGCCATTCGGAGCG | ATCAGCATTCGGTTACCAGG |
| ALK2 | AGAGGGTCGATATTTGGGC | AACTTGGGTCATTGGGAAC |
| ALK3 | ACCATTTCCAGCCCTACA | TCACTGGGCACCATGTT |
| BMPR2 | TTCTCTGGATCTTTCAGCCAC | CCTGATTTGCCATCTTGTGTTG |
| Dlx5 | TCTCTAGGACTGACGCAAACA | GTTACACGCCATAGGGTCGC |
| Dlx6 | TTCCCGAGAGAGCCGAACT | GTGGGTTACTACCCTGCTTCA |
| Hand2 | CAGATACATCGCCTACCTCATG | CTGCTCACTGTGCTTTTCAAG |
| End1 | AGACCAGAAGTTGACGCAC | GATGGTCTTGCTAAGATCCCAG |
3.1.7 Mouse embryonic maxillary mesenchymal cell culture
Primary mouse embryonic maxillary mesenchymal (MEMM) cells were generated from E14 embryos. Embryos were harvested and the maxilla was dissected and incubated in trypsin at 37°C with 5% CO2 for 30 minutes. The epithelium was removed from the mesenchyme, and the tissue was pipetted up and down vigorously until the cells were dispersed. The cells were filtered through a 100 μm mesh and cultured in DMEM/F12 supplemented with 10% FBS and 100 μg/mL penicillin/streptomycin.
3.1.8 Osteoblast mineralization
The capacity of MMEM cells to mineralize surrounding matrix was tested by providing confluent monolayers osteogenic media (OM): α-MEM containing 2.5% FBS, 100 μg/mL penicillin/streptomycin, 100 μg/mL ascorbic acid, 5 mM β-glycerophosphate, and 100 ng/mL BMP2 (R&D Systems). To assure that osteogenic media was essential for matrix mineralization, control wells were incubated in growth media (GM): α-MEM containing 2.5% FBS, 100 μg/ml penicillin/streptomycin, and vehicle. Cultures were incubated for 16 days at 37°C with 5% CO2 with changes of media every 2 days. Cell cultures were washed with PBS twice and fixed in 4% PFA for 30 minutes at room temperature. The monolayers grown in each well of a 12 well tissue culture plate were washed twice with dH2O prior to the addition of 500 μL of 40 mM alizarin red staining (ARS) solution and incubated for 20 minutes at room temperature with gentle rocking. The monolayers were then washed 4 times with excess dH2O for 4 minutes at room temperature while shaking. The plates were then tilted and left at an angle to remove all excess water from the well. Plates were photographed and stored at −20°C until solubilization of the dye. To quantify ARS, 400 μL of 10% acetic acid was added to each well and incubated for 30 minutes at room temperature with shaking. The monolayers were transferred to a 1.5 mL microfuge tube by scraping each well with a cell scraper. The tubes were vortexed for 30 minutes and 250 μL of mineral oil was added to each tube. Each tube was heated to 85°C for 10 minutes, cooled on ice for 5 minutes, and centrifuged at 20,000 g for 15 minutes. 250 μL of the acetic acid phase was transferred to a new tube and 100 μL of 10% ammonium hydroxide was added to neutralize the acid. Aliquots of each sample were read on SpectraMax M5 (Molecular Devices) plate reader in triplicate at 405 nm in 96-well format using opaque-walled, transparent-bottomed plates. Data was collected with Soft Max Pro (Molecular Devices) software.
3.1.9 Cell Proliferation
Cell proliferation following mineralization was measured using Cell Proliferation Elisa, BrdU Colorimetric kit (Roche) according to the manufacturer's protocol. Wells were read on SpectraMax M5 (Molecular Devices) plate reader in triplicate at 370 nm in 96-well format using tissue culture treated flat-bottomed plates. Data was collected with Soft Max Pro (Molecular Devices) software. Total DNA extraction was used as an additional means of determining differences in cell proliferation. Briefly, cells were incubated in DNA lysis buffer overnight at 50 °C. DNA was precipitated with isopropanol and resuspended in Tris buffer. DNA concentration was determined using Nanovue (GE©).
3.1.10 Immobilized JAG1-Fc
The process of ligand immobilization was performed as previously described [17]. Briefly, tissue culture plates were incubated with a solution of goat anti-human IgG antibody (20 μg/mL) in PBS for 30 minutes at 37°C and subsequently blocked with growth medium for 30 minutes. Plates were then incubated with either IgG (10 μg/mL) or JAG1-Fc (10 μg/mL) diluted in growth media for 2 hours at 37°C. Plates were washed with growth media and cells were seeded.
3.1.11 JAG1 inhibition
DAPT (Sigma) was added to the culture medium 2h before the addition of OM to yield a final concentration of 50 μM. Concentration of the gamma secretase inhibitor DAPT is comparable to that used in previous studies[18, 19]. Control wells, lacking inhibitor, were supplemented with an equivalent volume of DMSO (Sigma). The inhibitor was added with each media change and therefore present for the duration of the experiment.
3.1.12 Statistical Analysis
Paired students t-test was performed to establish significance. Data are presented as the mean of three experiments ± SEM for one littermate pair, unless otherwise specified. P-values of <0.05 were considered significant.
4.1 Results
4.1.1 Maxillary hypoplasia in Jag1CKO mice is associated with reduced bone volume, bone mineral density, and bone organization
Three dimensional reconstruction of μCT data obtained from control (Fig. 1A) and Jag1CKO (Fig. 1B) skulls illustrates severe maxillary hypoplasia in the Jag1CKO mice. In addition to the reduced size of the maxilla, these images also reveal decreased ossification of the maxillary and palatine bones (Fig. 1 A, B bottom images). Compositional algorithms of these data reveal significantly reduced mineralization of developing bone as measured by bone volume, bone fraction volume (bone volume/total volume) and tissue mineral density in Jag1CKO's maxillary (green cylinder) bones compared to controls (Fig. 1C, D, E). Additionally, as bone develops, the orientation of trabecular networks results in high anisotropy providing its unique biomechanical properties to respond differently to forces acting on it from different directions [20]. As such, anisotropy was significantly decreased in Jag1CKO maxillary bones relative to controls (Fig. 1F), suggesting impaired structural deficiencies. Bone volume and bone fraction volume were also diminished in the palatine bone (red cylinder) of Jag1CKO's when compared to controls (Fig. 1G, H), however, the median tissue mineral density and anisotropy in the Jag1CKO palatine bone was no different from controls (Fig. 1J). The morphological differences observed in the maxillary and palatine bones of the CKO demonstrate that Jag1CKO maxillary hypoplasia resulting from the loss of JAG1 signaling in neural crest cells is associated with deficient intrinsic growth and development of the maxilla hallmarked by reduced mineralization and trabecular order.
4.1.2 Delayed maxillary ossification in Jag1CKO embryos
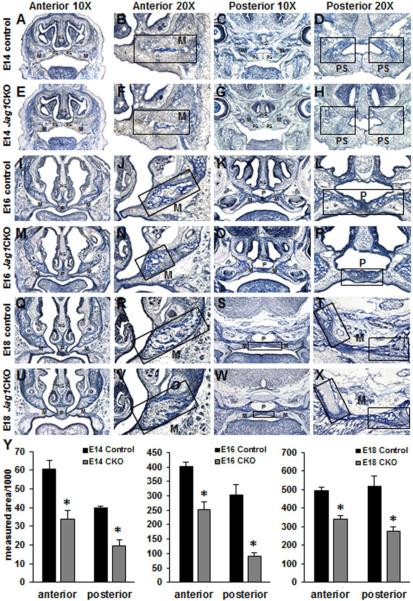
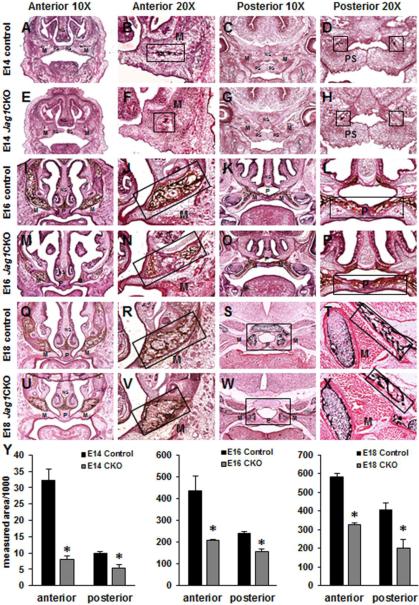
Histological examination of the maxillary prominence from E14, E16, and E18 Jag1CKO embryos revealed reduced collagen deposition using Tri-chrome staining (Fig. 2) and delayed development of mesenchymal condensations that becomes ossified bone using Von Kossa staining (Fig. 3) when compared to controls. At E14, collagen deposition and mesenchymal condensations have formed in the anterior lateral maxilla (Fig. 2A, B and 3A, B) and the posterior palate shelves of control embryos (Fig. 2C, D and 3C, D) whereas Jag1CKO embryos had reduced collagen deposits and mesenchymal condensations compared to controls (Fig. 2E, F, G, H and 3E, F, G, H). At E16 collagen deposition and ossification of the lateral maxilla expanded medially and continued within the palatine region posteriorly in control embryos (Fig. 2I, J, K, L and 3I, J, K, L); whereas, Jag1CKO embryos revealed a poorly organized pattern of collagen deposition and ossification (Fig. 2M, N, O, P and 3M, N, O, P) that was reduced in size when compared to controls. Staining at E18 revealed the expansion of collagen deposition and ossified bone throughout the maxillary and palatine bone within the maxilla in control embryos (Fig. 2Q, R, S, T and 3Q, R, S, T), and analysis of the same area within the CKOs demonstrated less collagen deposition and reduced overall ossification occurring at the same developmental time point (Fig. 2U, V, W, X and 3U, V, W, X). Quantification of the areas of collagen deposition and ossification revealed a significant reduction in the measurements both anteriorly and posteriorly in Jag1CKO embryos at E14, E16, and E18 when compared to controls (Fig. 2Y and 3Y). Previous work has shown that the Wnt1-cre transgene has resulted in expansion of the midbrain with disruption of midbrain dopaminergic neuron differentiation [21]. This phenotype could potentially affect cranial ossification and growth if the size of the midbrain resulted in a strain on other areas of the skull. Here we compared ossification of the maxilla and the mandible in control and Wnt1-cre+ littermates and did not find any differences in collagen deposition or the formation of mesenchymal condensations (Sup. Fig. 1).
Figure 2. Reduced calcium deposition in Jag1CKO maxillas and palates.
Tri-chrome staining was performed on anterior and posterior frozen sections through the developing maxilla at E14 (A-H), E16 (I-P), and E18 (Q-X) in control and Jag1CKO embryos. Reduced areas calcification in both the lateral maxillary bone (M) and medial palatine bone (P) were revealed in Jag1CKO embryos when compared to controls (boxes and graphs). Columns, mean area obtained from 3 separate experiments; bars, SEM; *=p<0.05. M=maxilla, PS=palate shelf, P=palate.
Figure 3. Diminished ossification in Jag1CKO maxillary and palatine bones.
Von Kossa staining was performed on anterior and posterior frozen sections through the developing maxilla at E14 (A-H), E16 (I-P), and E18 (Q-X) in control and Jag1CKO embryos. Reduced areas of ossification in both the lateral maxillary bone (M) and medial palatine bone (P) were revealed in Jag1CKO embryos when compared to controls (boxes and graphs). Columns, mean area obtained from 3 separate experiments; bars, SEM; *=p<0.05. M=maxilla, PS=palate shelf, P=palate.
4.1.3 Reduced expression of osteoblast regulators in Jag1CKO maxillas
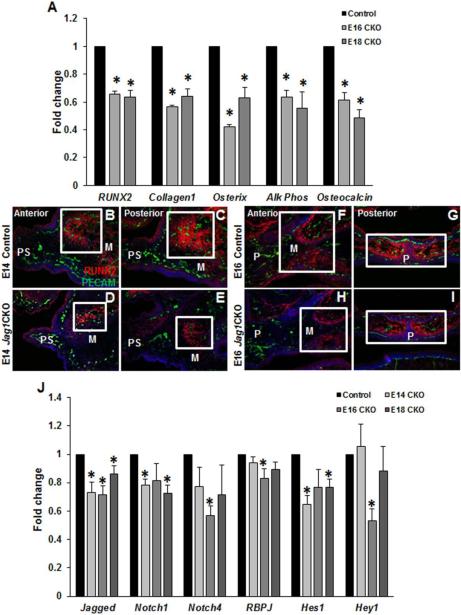
Gene expression changes in key regulators of osteoblast development and differentiation were analyzed by qPCR on whole maxillary mRNA from control and Jag1CKO embryos. The mRNA levels of genes coding for essential regulatory proteins expressed from the pre-osteoblast stage to the mature osteoblast (Runx2, Collagen1, Osterix, Alk Phos, Osteocalcin) were significantly reduced at E16 and E18 in Jag1CKO maxillary tissue relative to controls (Fig. 4A). RUNX2 immunohistochemistry of control and Jag1CKO sections through E14 maxillas revealed that control embryos developed broad areas of ossification centers (RUNX2+) within the lateral maxillary prominence (Fig. 4B, C), whereas RUNX2+ areas within Jag1CKO maxillas were drastically reduced in size (Fig. 4D, E). At E16, the ossification centers within the anterior maxillary prominence have expanded and RUNX2+ cells are now seen posteriorly within the fused palatine bone of controls (Fig. 4F, G). However, the expansion of these ossification centers and RUNX2 expression within the palatine bone was reduced inJag1CKO sections (Fig. 4H, I). Recent work has identified a novel role for JAG1-NOTCH signaling in the establishment of dorsal identity and repression of ventral fates in zebrafish [22]. Evaluation of osteoblast transcriptional regulators, Dlx5/6, Hand2, and End1, active during facial patterning and dependent on Jagged1 expression demonstrated alterations in expression with decreases in all of these transcription factors during later development that induce osteoblast differentiation (Sup. Fig. 2G). These results reveal that key regulatory proteins required for osteoblast maturation are reduced in Jag1CKO maxillas suggesting that maxillary ossification is delayed in Jag1CKO embryos during embryonic development of the maxillary prominence, which results in deficient post-natal bone expansion and growth.
Figure 4. Aberrant osteoblast development and differentiation in Jag1CKO maxillas.
qPCR revealed a decrease in the induction of osteoblast differentiation genes at both E16 and E18 in Jag1CKO whole maxillary mRNA when compared to control littermates at the same developmental time point (A). Columns, median fold change obtained from 3 separate experiments; bars, SEM; *=p<0.05. Immunohistochemistry (B-I): Frozen sections from the anterior and posterior developing maxilla in control and Jag1CKO were stained with an early marker of osteoblast differentiation, RUNX2, and endothelial cell marker, PECAM. The density of RUNX2 staining (boxes) was reduced in Jag1CKO maxillas at E14 (D, E) and E16 (H, I) when compared to control littermates (B, C, F, G). n=3 for each time point. M=maxilla, PS=palate shelf, P=palate. qPCR was used to compare the expression of Jagged1 ligand, Notch 1 and 4 receptors, and downstream effectors: RBPJ, Hes1, and Hey1 in Jag1CKO whole maxillary mRNA at E14, E16, and E18 to control littermate whole maxillary mRNA at the same developmental time point (J). Columns, mean fold change obtained from 3 separate experiments; bars, SEM; *=p<0.05.
4.1.4 Altered canonical JAG1-NOTCH signaling in the Jag1CKO maxillas
The expression of NOTCH signaling pathway mediators was significantly altered by qPCR on whole maxillary mRNA (Fig. 4J). At E14, Notch1 and Hes1 were significantly downregulated in the Jag1CKOs. At E16, the expression of Notch4, RBPJ, and Hey1 were reduced compared to controls. At E18, Notch1 and Hes1 were diminished similar to the E14 analysis. These data indicate that aberrant signaling within the JAG1-NOTCH canonical pathway in the Jag1CKO occurs during the critical time points of maxillary ossification.
4.1.5 Reduced in vitro differentiation and ossification in Jag1CKO MEMM cells
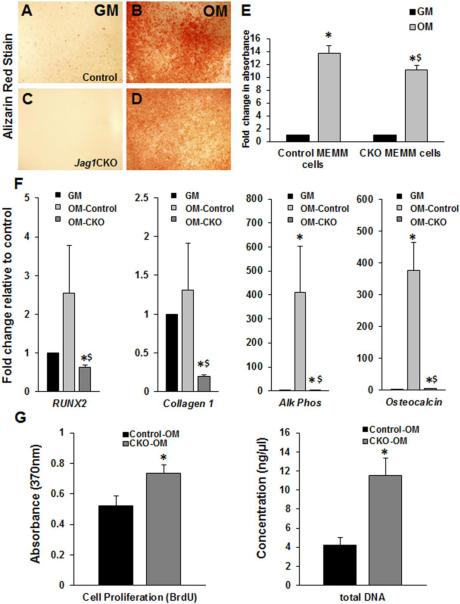
Mouse embryonic maxillary mesenchymal (MEMM) cells were harvested from control and Jag1CKO embryos at E14 and cultured in osteogenic media (OM) + BMP2 to induce differentiation and mineralization. Mineralization was decreased in Jag1CKO MEMM cells following a 16d differentiation when compared to controls (Fig. 5A-E). Similarly, the induction of osteoblast regulatory genes was significantly down-regulated in Jag1CKO cells compared to controls following differentiation (Fig. 5F). However, cell proliferation was significantly increased in Jag1CKO MEMM cells compared to controls after the 16d incubation in OM (Fig 5G). These data indicated that Jag1CKO MEMM cells had an intrinsic deficiency in their ability to respond to BMP2-induced osteoblast differentiation and form ossified bone. Increased proliferation in the Jag1CKO cells suggested that the mesenchymal precursors were stuck in the proliferative phase that occurs prior to osteoblast commitment during ossification.
Figure 5. Reduced mineralization and osteoblast differentiation in Jag1CKO MEMM cells in vitro.
Control and Jag1CKO MEMM cells were incubated in growth media (GM) or osteogenic media (OM) for 16d and stained with alizarin red to analyze mineralization (A-D). The alizarin red stain was solubilized and quantified (E). qPCR revealed the induction of osteoblast differentiation markers in mRNA extracted from the cells (F). Differentiated Jag1CKO cells (OM-CKO) were compared to Jag1CKO cells incubated in GM. Differentiated control cells (OM-control) were compared to control cells in GM. Columns, mean fold change obtained from 3 separate experiments; bars, SEM; *=p<0.05 compared to GM; $=p<0.05 compared to OM-control. Cell proliferation following 16d differentiation in OM was measured by BrdU EILISA and total DNA extraction (G). Columns, mean obtained from 3 separate experiments; bars, SEM; *=p<0.05
4.1.6 Inhibition of JAG1-NOTCH signaling results in reduced mineralization in vitro
The presence of γ-secretase inhibitor DAPT (50 μM) during the entire 16d differentiation period reduced alizarin red staining in control MEMM cells (Sup. Fig. 3A-D). Quantification of the stained cells revealed an approximately 2 fold decrease in the incorporation of alizarin red in cells treated with DAPT (Sup. Fig. 3E). These results are consistent with the necessity of the JAG1-NOTCH signaling axis during MEMM mineralization.
4.1.7 Altered BMP ligand and receptor expression in Jag1CKO MEMM cells in vitro
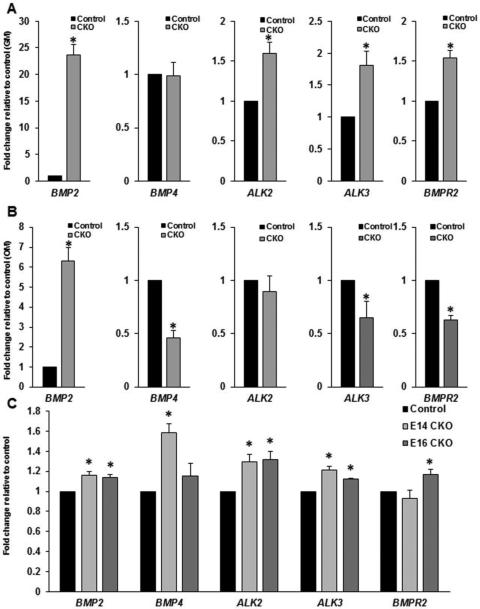
The reduced ability of the Jag1CKO MEMM cells to respond to BMP2 induction of osteoblast differentiation in vitro suggested that the BMP pathway was altered by the loss of JAG1 in CNC cells. qPCR analysis of undifferentiated MEMM cells revealed a 23 fold increase in the expression of BMP2, 1.5 fold increase in ALK2 (BMPR1b), 1.7 fold increase in ALK3 (BPMR1a), and 1.5 fold increase in BMPR2 in Jag1CKO MEMM cells compared to controls (Fig. 6A). There was no significant difference in the expression of BMP4 (Fig. 6A). Following 16d differentiation in OM + BMP2 a 6 fold increase in the expression of BMP2 was revealed while BMP4, ALK3 (BMPR1a), and BMPR2 were all significantly reduced by 2 fold, 1.7 fold, and 1.8 fold, respectively, in the Jag1CKO MEMM cells (Fig. 6B). No significant difference was seen in the expression of ALK2 (BMPR1b) following differentiation (Fig. 6B). These data suggest that Jag1CKO MEMM cells cannot appropriately respond to the signals that induce osteoblast differentiation due to the misexpression of BMP pathway molecules at both the mesenchymal cell stage as well as post differentiation.
Figure 6. Misexpression of BMP ligands and receptors Jag1CKO MEMM cells in vitro and in vivo.
Control and Jag1CKO MEMM cells were incubated in either growth media (GM) or osteogenic media (OM) for 16d, and qPCR was used compare the expression of BMP ligands and receptors. A: mRNA levels in undifferentiated Jag1CKO cells (OM-CKO) relative to the levels in undifferentiated control cells (OM-control). B: mRNA levels in differentiated Jag1CKO cells (OM-CKO) relative to the levels in differentiated control cells (OM-control). C: Jag1CKO whole maxillary mRNA at E14 and E16 relative to control littermate whole maxillary mRNA at the same developmental time point (J). Columns, mean fold change obtained from 3 separate experiments; bars, SEM; *=p<0.05.
4.1.8 BMP signaling molecules are dysregulated in Jag1CKO maxillas
qPCR on whole maxillary mRNA from control and Jag1CKO embryos revealed gene expression differences in BMP pathway molecules at E14 and E16 (Fig. 6C), but no differences at E18 (data not shown). At E14, analyses detected small, however significant, increases in the expression of BMP2 (1.2 fold), BMP4 (1.6 fold), ALK2 (BMPR1b) (1.3 fold), and ALK3 (BMPR1a) (1.2 fold), but no difference in BMPR2 (Fig. 6C). Similarly, expression of BMP2, ALK2 (BMPR1b), ALK3 (BMPR1a), and BMPR2 were increased by 1.1, 1.3, 1.1, and 1.2 fold, respectively, at E16, however no difference was revealed in BMP4 (Fig. 6C). These data are consistent with what was shown in undifferentiated Jag1CKO MEMM cells suggesting that the mesenchymal cells within the Jag1CKO maxillas have alterations in the genes regulating osteoblast differentiation leading to an intrinsic delay in osteoblast development.
4.1.9 JAG1-Fc rescues in vitro MEMM cell ossification
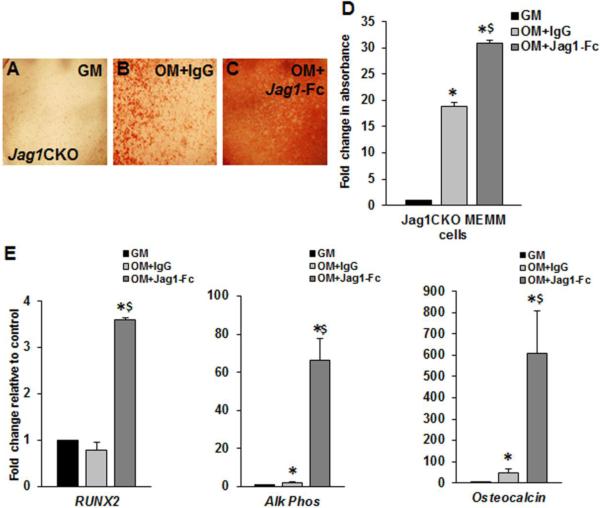
The presence of immobilized JAG1-Fc enhanced mineralization of Jag1CKO MEMM cells cultured in OM with BMP2 (Fig. 7A-D). Additionally, qPCR analysis revealed that Jag1-Fc was sufficient for the induction of genes regulating osteoblast differentiation (RUNX2, collagen1, alkaline phosphatase, and osteocalcin) (Fig. 7E) during in vitro ossification assays. Taken together, these data demonstrated that JAG1-Fc was necessary to rescue the deficiency in osteoblast development and differentiation in response to OM + BMP2 in Jag1CKO MEMM cells.
Figure 7. JAG1-Fc is sufficient to rescue mineralization and osteoblast marker induction.
Jag1CKO MEMM cells were incubated in growth media (GM), osteogenic media in the presence of immobilized IgG (OM+IgG), or osteogenic media in the presence of immobilized Jagged1-Fc (OM+Jag1-Fc) for 16d and stained with alizarin red to analyze mineralization (A-C). The alizarin red stain was solubilized and quantified (E). qPCR revealed the induction of osteoblast differentiation markers in mRNA extracted from the cells. Columns, mean fold change obtained from 3 separate experiments; bars, SEM; *=p<0.05 compared to GM; $=p<0.05 compared to OM+IgG.
5.1 Discussion
Conditional targeted deletion of Jag1 in CNC cells demonstrated several important cell-autonomous roles of JAG1 during maxillary ossification. We demonstrated the necessity of Jagged1 during maxillary mesenchyme osteoblast differentiation in vivo and in MEMM cells in vitro (Sup. Fig. 2A-F), supporting the importance of Jagged1 in cell-autonomous mesenchymal signaling. Maxillary hypoplasia due to the loss of Jagged1 was characterized by aberrant osteoblast regulatory gene expression, associated with histologic, and μCT findings of aberrant bone formation. Abrogation of JAG1-NOTCH signaling in maxillary mesenchymal cells resulted in an overall delay in osteoblast development and differentiation, which may be due in part to altered BMP signaling, and was rescued by exogenous JAG1. This study demonstrated the requirement of Jagged1 during osteoblast maturation and ossification, which were critical for normal maxillary development.
5.1.1 Maxillary hypoplasia associated with aberrant osteoblast development in Jag1CKO mice
CNC cells migrate from the dorsal neural tube and populate the maxillary prominence with mesenchymal osteoblast precursors [23, 24]. The maxillary bone is formed through intramembranous ossification where the mesenchymal condensations differentiate directly into pre-osteoblast and form ossification centers with no cartilaginous phase [1]. The maxillary bone comprises the fusion of the lateral maxillary processes and the palatine bones, both of which are derived after fusion of the palate shelves. Osteoblast differentiation begins in the lateral maxilla and continues medially while ossification of palatine bone begins as an independent process. Expansion of these ossification centers continues until ossification of the maxillary prominence is complete. Conditional deletion of Jagged1 in the CNC led to maxillary hypoplasia that phenocopied the facial features of Alagille syndrome patients who have JAG1 or NOTCH mutations [4]. Jag1CKO mice had reduced bone density that was poorly organized post-natally (Fig. 1). Our data suggests that the post-natal phenotype was a result of reduced collagen deposition (Fig. 2) and delayed ossification (Fig. 3) associated with reduced osteoblast regulatory gene expression required for normal osteoblast development and differentiation (Fig. 4). Similarly, Bmpr1a, or ALK3, conditional mutant mice have delayed palatal bone formation and reduced osteoblast regulatory gene expression; however, these mice die shortly after birth due to cleft palate formation preventing post-natal evaluation of bone development [25]. Palatal bone defects result from osteoblasts failing to mature occur in Tbx22 null mice as shown by a complete lack of mineralized bone, and these mice also die at birth due to cleft palate formation and choanal atresia [26]. The Jag1CKO model of intrinsic maxillary hypoplasia uniquely allows the examination of maxillary osteoblast development and differentiation as well as early post-natal maxillary growth.
5.1.2 JAG1 signaling is required for maxillary osteoblast development and differentiation
JAG1-NOTCH signaling was required during osteoblast maturation, but there are conflicting reports as to whether the NOTCH pathway plays an inductive or inhibitory role during ossification. Over-expression of the NOTCH intracellular domain (NICD) in pre-osteoblast mesenchymal cells repressed differentiation and led to osteopenia [27]. However, NICD over-expression in later stage committed osteoblasts resulted in abnormal proliferation and osteosclerosis [28]. HEY1, a direct downstream target of JAG1-NOTCH signaling, has been shown to suppress RUNX2, the earliest pre-osteoblast regulator of differentiation [29]. Conversely, inhibition of NOTCH signaling in MC3T3 cells was shown to result in decreased regulators of bone development: RUNX2, Alkaline Phosphatase, Collagen1, and Osteocalcin [7]. Several recent studies demonstrated that JAG1 acts to induce mesenchymal stem cells to differentiate into osteoblasts and undergo mineralization [5, 30]. In these studies, JAG1 induced expression of bone sialoprotein and Alkaline Phosphatase, demonstrating the role of JAGGED1 during the induction of mesenchymal cells into osteoblasts [30]. In addition, mutations in Jag1 cause Alagille syndrome in humans which is associated with craniofacial defects, butterfly vertebrae, digit abnormalities, osteoporosis, and pediatric bone fractures, suggesting that JAG1 plays an important role in human bone development and maintenance [31]. In Jag1CKO maxillary mesenchymal cells, JAG1 was required both in vivo and in vitro for the induction of osteoblast regulatory genes, such as RUNX2, collagen1, alkaline phosphatase, osterix, and osteocalcin (Fig. 4 and 5). Additionally, replacement of JAG1 in vitro was sufficient to rescue gene expression (Fig. 7) demonstrating the sufficiency of JAG1 to induce osteoblast differentiation in response to OM. Analysis of JAG1-NOTCH canonical pathway members in Fig. 4J revealed decreased Notch 1, Notch 4, Hes1 and Hey 1 expression during critical time points of maxillary ossification. Taken together, these data suggests that JAG1, likely acting through the canonical NOTCH pathway, was required for induction of osteoblast development and differentiation in maxillary mesenchyme during intramembranous ossification. Previously published data from our lab revealed decreased proliferation within the maxillary mesenchyme at E14, but not at P14 [4], which suggested that lack of proliferation contributed to the phenotype seen in the Jag1CKO. Here we show that MEMM cells have increased proliferation, but decreased mineralization, at the end of a 16d differentiation in OM + BMP2 (Fig. 5G). These data suggest that the Jag1CKO mesenchymal progenitors, unable to undergo osteoblast differentiation, continue to proliferate, where the control cells have already passed the proliferative phase and are ossifying.
5.1.3 JAG1-NOTCH signaling during patterning of the vertebrate facial skeleton
Facial skeletal development occurs through the complex patterning of CNC cells along the dorsoventral axis. Elegant studies of Jagged1's role during dorsal and ventral craniofacial development in zebrafish revealed a complex relationship between Jagged1, Dlx5, Dlx6, End1 and Hand2, all of which are transcription factors necessary for osteoblast differentiation[22]. In the zebrafish model BMP2 plays a prominent role of inducing Hand2 expression, which represses Dlx5/6 expression. In the Jag1CKO mice, the expression of Dlx5, Dlx6, Hand2, and End1 are dysregulated at each developmental time point analyzed (Sup. Fig. 2G). These data suggested that, similar to zebrafish, Jagged1 signaling affects the expression of these ventral specifying transcription factors, thus affecting patterning of the maxilla, a dorsal structure. Furthermore, the alteration in Dlx5, Dlx6, Hand2, and End1 expression during maxillary osteoblast differentiation suggests that these transcription factors are down-stream of Jagged1 functioning, and that their dysregulated expression was associated with reduced maxillary osteoblast differentiation.
5.1.4 Altered BMP signaling in Jag1CKO MEMM cells
The role of BMP signaling in facial skeletal development has been extensively studied; with a recent report demonstrating the necessity of BMPR1a (ALK3) during palate ossification [25]. The absence of BMPR1a (ALK3) led to reduced growth of the palate shelves, deficient bone formation of the maxillary and palatine bones, and cleft palate formation associated with reduced proliferation within the mesenchyme and misexpression of Msx1, Fgf10, and Shh [25]. Interestingly BMPR1a, or ALK3, as well as BMPR2 and BMP4 expression was significantly reduced in Jag1CKO MEMM cells following 16d differentiation in vitro (Fig. 6). BMP2 has been shown to induce the expression of canonical NOTCH target HEY1 [29]. Inhibition of NOTCH1, the canonical JAG1 receptor, has been shown to reduce BMP target genes, such as Id1, suggesting that the NOTCH and BMP pathways may function synergistically [7]. In addition,JAG1-NOTCH signaling was essential for BMP2 induced osteoblast differentiation and BMP signaling itself in human mesenchymal stem cells [7]. Jag1CKO MEMM cells had reduced mineralization in vitro in response to BMP2 (Fig. 5) that was associated with reduced expression of osteoblast regulatory genes (Fig. 5) suggesting that Jag1CKO cells were unable to respond to BMP2 induced osteoblast differentiation. However, the expression of BMP2 as well as the BMP receptors ALK2, ALK3, and BMPR2 was significantly greater in Jag1CKO MEMM cells in vitro than in controls prior to osteoblast differentiation (Fig. 6). Additionally, in vivo expression of the same BMP signaling molecules was significantly greater in Jag1CKO whole maxillary mRNA than in controls at E16 which is a critical point of maxillary ossification. This suggested that Jag1CKO mesenchymal cells have up-regulated BMP signaling, possibly to compensate for their inability to respond to osteo-inductive signals during maxillary mesenchymal differentiation. This failure to respond to osteo-inductive signals results in an overall inability in their genetic program to regulate osteoblast development and differentiation. Following differentiation in vitro, BMP2 expression was still increased, but the BMP receptors were decreased indicating that the timing of induction of BMP pathway molecules was misregulated. Future studies will determine the mechanism by which JAG1 regulates the reception of BMP and whether maxillary hypoplasia in Jag1CKO mice is due to the loss of responsiveness to BMP signaling (Fig.8).
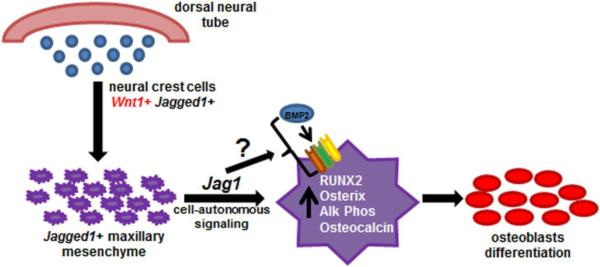
Figure 8.
Jagged1 cell autonomous signaling is required in CNC-derived maxillary mesenchyme during osteoblast development and differentiation.
6.1 Conclusion
Taken together, these data demonstrated that JAG1 cell-autonomous signaling in CNC cells was required for normal maxillary osteoblast development and differentiation (Fig. 8), and the loss of JAG1 led to post-natal intrinsic maxillary hypoplasia characterized by delayed maxillary ossification and aberrant bone formation. Uncovering the importance of JAG1 signaling to BMP-responsiveness of the CNC derived mesenchyme during osteoblast differentiation and ossification is an important first step towards understanding the pathways necessary for maxillary formation. Understanding the mechanisms of JAG1 signaling during maxillary development may increase our understanding of intrinsic maxillary hypoplasia in humans.
Supplementary Material
Highlights.
JagCKO in cranial neural crest cells results in maxillary hypoplasia.
This phenotype included changes in bone morphology and decreased bone density.
Jag1CKO embryos show delayed osteoblast development and differentiation.
In vitro assays indicated an intrinsic insufficiency to form mineralized bone.
Acknowledgements
We would like to thank the expert technical assistance from Yan Zhao and Xiaomin Fu. We also thank Joey Barnett for critical reading of the manuscript.
7.1.1 Source of Funding: This research was supported by grant 5K08DE17953-5 from the National Institutes of Health.
1.1 Abbreviations
- ALK
Activin Receptor-Like Kinases
- ARS
Alizarin red staining
- BMP
Bone Morphogenetic Protein
- CKO
Conditional Knockout
- CNC
cranial neural crest
- GM
growth media
- HES
Hairy/Enhancer of split
- Jag1
Jagged1
- MAML
master-mind like
- M
maxilla
- MEMM
mouse embryonic maxillary mesenchymal
- NICD
Notch intracellular domain
- NS
nasal septum
- OM
osteogenic media
- P
palate
- PS
palate shelf
- RBPJ
recombining binding protein suppressor of hairless
- SEM
standard error of the mean
- μCT
micro-computed tomography
Footnotes
Publisher's Disclaimer: This is a PDF file of an unedited manuscript that has been accepted for publication. As a service to our customers we are providing this early version of the manuscript. The manuscript will undergo copyediting, typesetting, and review of the resulting proof before it is published in its final citable form. Please note that during the production process errors may be discovered which could affect the content, and all legal disclaimers that apply to the journal pertain.
References Cited
- 1.Franz-Odendaal TA. Induction and patterning of intramembranous bone. Frontiers in Bioscience-Landmark. 2011;16:2734–2746. doi: 10.2741/3882. [DOI] [PubMed] [Google Scholar]
- 2.Kamath BM, et al. Facial features in Alagille syndrome: Specific or cholestasis facies? American Journal of Medical Genetics. 2002;112(2):163–170. doi: 10.1002/ajmg.10579. [DOI] [PubMed] [Google Scholar]
- 3.Cohen SR, et al. Cumulative Operative Procedures in Patients Aged 14 Years and Older with Unilateral or Bilateral Cleft-Lip and Palate. Plastic and Reconstructive Surgery. 1995;96(2):267–271. doi: 10.1097/00006534-199508000-00003. [DOI] [PubMed] [Google Scholar]
- 4.Humphreys R, et al. Cranial neural crest ablation of Jagged1 recapitulates the craniofacial phenotype of Alagille syndrome patients. Human Molecular Genetics. 2012;21(6):1374–1383. doi: 10.1093/hmg/ddr575. [DOI] [PMC free article] [PubMed] [Google Scholar]
- 5.Osathanon T, et al. Surface-bound orientated Jagged-1 enhances osteogenic differentiation of human periodontal ligament-derived mesenchymal stem cells. Journal of Biomedical Materials Research Part A. 2013;101A(2):358–367. doi: 10.1002/jbm.a.34332. [DOI] [PubMed] [Google Scholar]
- 6.Dishowitz MI, et al. Systemic Inhibition of Canonical Notch Signaling Results in Sustained Callus Inflammation and Alters Multiple Phases of Fracture Healing. Plos One. 2013;8(7) doi: 10.1371/journal.pone.0068726. [DOI] [PMC free article] [PubMed] [Google Scholar]
- 7.Nobta M, et al. Critical regulation of bone morphogenetic protein-induced osteoblastic differentiation by Delta1/Jagged1-activated Notch1 signaling. Journal of Biological Chemistry. 2005;280(16):15842–15848. doi: 10.1074/jbc.M412891200. [DOI] [PubMed] [Google Scholar]
- 8.Engin F, Lee B. NOTCHing the bone: Insights into multi-functionality. Bone. 2010;46(2):274–280. doi: 10.1016/j.bone.2009.05.027. [DOI] [PMC free article] [PubMed] [Google Scholar]
- 9.Dishowitz MI, et al. Notch signaling components are upregulated during both endochondral and intramembranous bone regeneration. Journal of Orthopaedic Research. 2012;30(2):296–303. doi: 10.1002/jor.21518. [DOI] [PMC free article] [PubMed] [Google Scholar]
- 10.Zanotti S, Canalis E. Notch Regulation of Bone Development and Remodeling and Related Skeletal Disorders. Calcified Tissue International. 2012;90(2):69–75. doi: 10.1007/s00223-011-9541-x. [DOI] [PMC free article] [PubMed] [Google Scholar]
- 11.Harper JA, et al. Notch signaling in development and disease. Clinical Genetics. 2003;64(6):461–472. doi: 10.1046/j.1399-0004.2003.00194.x. [DOI] [PubMed] [Google Scholar]
- 12.Iso T, Kedes L, Hamamori Y. HES and HERP families: Multiple effectors of the Notch signaling pathway. Journal of Cellular Physiology. 2003;194(3):237–255. doi: 10.1002/jcp.10208. [DOI] [PubMed] [Google Scholar]
- 13.Danielian PS, et al. Modification of gene activity in mouse embryos in utero by a tamoxifen-inducible form of Cre recombinase. Current Biology. 1998;8(24):1323–1326. doi: 10.1016/s0960-9822(07)00562-3. [DOI] [PubMed] [Google Scholar]
- 14.High FA, et al. Murine Jagged1/Notch signaling in the second heart field orchestrates Fgf8 expression and tissue-tissue interactions during outflow tract development. Journal of Clinical Investigation. 2009;119(7):1986–1996. doi: 10.1172/JCI38922. [DOI] [PMC free article] [PubMed] [Google Scholar]
- 15.Kiernan AE, Xu JX, Gridley T. The Notch ligand JAG1 is required for sensory progenitor development in the mammalian inner ear. Plos Genetics. 2006;2(1):27–38. doi: 10.1371/journal.pgen.0020004. [DOI] [PMC free article] [PubMed] [Google Scholar]
- 16.Hill CR, et al. BMP2 signals loss of epithelial character in epicardial cells but requires the Type III TGF beta receptor to promote invasion. Cellular Signalling. 2012;24(5):1012–1022. doi: 10.1016/j.cellsig.2011.12.022. [DOI] [PMC free article] [PubMed] [Google Scholar]
- 17.Varnum-Finney B, et al. Immobilization of Notch ligand, Delta-1, is required for induction of Notch signaling. Journal of Cell Science. 2000;113(23):4313–4318. doi: 10.1242/jcs.113.23.4313. [DOI] [PubMed] [Google Scholar]
- 18.Dahlqvist C, et al. Functional Notch signaling is required for BMP4-induced inhibition of myogenic differentiation. Development. 2003;130(24):6089–99. doi: 10.1242/dev.00834. [DOI] [PubMed] [Google Scholar]
- 19.Yao J, et al. Gamma-secretase inhibitors exerts antitumor activity via down-regulation of Notch and Nuclear factor kappa B in human tongue carcinoma cells. Oral Dis. 2007;13(6):555–63. doi: 10.1111/j.1601-0825.2006.01334.x. [DOI] [PubMed] [Google Scholar]
- 20.Odgaard A. Three-dimensional methods for quantification of cancellous bone architecture. Bone. 1997;20(4):315–28. doi: 10.1016/s8756-3282(97)00007-0. [DOI] [PubMed] [Google Scholar]
- 21.Lewis AE, et al. The widely used Wnt1-Cre transgene causes developmental phenotypes by ectopic activation of Wnt signaling. Developmental Biology. 2013;379(2):229–34. doi: 10.1016/j.ydbio.2013.04.026. [DOI] [PMC free article] [PubMed] [Google Scholar]
- 22.Zuniga E, Stellabotte F, Crump JG. Jagged-Notch signaling ensures dorsal skeletal identity in the vertebrate face. Development. 2010;137(11):1843–52. doi: 10.1242/dev.049056. [DOI] [PMC free article] [PubMed] [Google Scholar]
- 23.Chai Y, et al. Fate of the mammalian cranial neural crest during tooth and mandibular morphogenesis. Development. 2000;127(8):1671–1679. doi: 10.1242/dev.127.8.1671. [DOI] [PubMed] [Google Scholar]
- 24.Yoshida T, et al. Cell lineage in mammalian craniofacial mesenchyme. Mechanisms of Development. 2008;125(9-10):797–808. doi: 10.1016/j.mod.2008.06.007. [DOI] [PubMed] [Google Scholar]
- 25.Baek JA, et al. Bmpr1a signaling plays critical roles in palatal shelf growth and palatal bone formation. Developmental Biology. 2011;350(2):520–531. doi: 10.1016/j.ydbio.2010.12.028. [DOI] [PMC free article] [PubMed] [Google Scholar]
- 26.Pauws E, et al. Loss of Tbx22 causes submucous cleft palate, ankyloglossia and choanal atresia. Mechanisms of Development. 2009;126:S122–S122. [Google Scholar]
- 27.Zanotti S, et al. Notch inhibits osteoblast differentiation and causes osteopenia. Endocrinology. 2008;149(8):3890–3899. doi: 10.1210/en.2008-0140. [DOI] [PMC free article] [PubMed] [Google Scholar]
- 28.Engin FZ, et al. Dimorphic effects of Notch signaling in bone homeostasis. Nature Medicine. 2008;14(3):299–305. doi: 10.1038/nm1712. [DOI] [PMC free article] [PubMed] [Google Scholar]
- 29.Zamurovic N, et al. Coordinated activation of Notch, Wnt, and transforming growth factor-beta signaling pathways in bone morphogenic protein 2-induced osteogenesis Notch - Target gene Hey1 inhibits mineralization and Runx2 transcriptional activity. Journal of Biological Chemistry. 2004;279(36):37704–37715. doi: 10.1074/jbc.M403813200. [DOI] [PubMed] [Google Scholar]
- 30.Dishowitz MI, et al. Jagged1 immobilization to an osteoconductive polymer activates the Notch signaling pathway and induces osteogenesis. Journal of Biomedical Materials Research Part A. 2013 doi: 10.1002/jbm.a.34825. [DOI] [PubMed] [Google Scholar]
- 31.Alagille D, et al. Hepatic Ductular Hypoplasia Associated with Characteristic Facies, Vertebral Malformations, Retarded Physical, Mental and Sexual Development, and Cardiac Murmur. Journal of Pediatrics. 1975;86(1):63–71. doi: 10.1016/s0022-3476(75)80706-2. [DOI] [PubMed] [Google Scholar]
Associated Data
This section collects any data citations, data availability statements, or supplementary materials included in this article.


