

Abstract
The trochlear and abducens nerves (TN and AN) control the movement of the superior oblique and lateral rectus muscles of the eyeball, respectively. Despite their immense clinical and radiological importance no morphometric data was available from a wide spectrum of age groups for comparison with either pathological or other conditions involving these nerves. In the present study, morphometry of the TN and AN was performed on twenty post-mortem samples ranging from 12–90 years of age. The nerve samples were processed for resin embedding and toluidine blue stained thin (1µm) sections were used for estimating the total number of myelinated axons by fractionator and the cross sectional area of the nerve and the axons by point counting methods. We observed that the TN was covered by a well-defined epineurium and had ill-defined fascicles, whereas the AN had multiple fascicles with scanty epineurium. Both nerves contained myelinated and unmyelinated fibers of various sizes intermingled with each other. Out of the four age groups (12–20y, 21–40y, 41–60y and >61y) the younger groups revealed isolated bundles of small thinly myelinated axons. The total number of myelinated fibers in the TN and AN at various ages ranged from 1100–3000 and 1600–7000, respectively. There was no significant change in the cross-sectional area of the nerves or the axonal area of the myelinated nerves across the age groups. However, myelin thickness increased significantly in the AN with aging (one way ANOVA). The present study provides baseline morphometric data on the human TN and AN at various ages.
Keywords: stereology, morphometry, ocular motor nerves, myelin thickness
Aging can affect vision in many ways. Cataract and presbyopia are the commonest manifestations of aging in the general population. Rarely, diplopia may occur due to various reasons, including abnormalities of motor control of the eyeballs. The oculomotor (ON), trochlear (TN) and abducens (AN) nerves work in tandem to dynamically control the muscles that either fix or move the eyeball in order to attain the optimum view of the world around. Diseases affecting these nerves can cause double-vision, altered visual acuity or a general disorientation in space. These nerves may be involved either individually or collectively in various physiological or pathological conditions that result in defects of gaze and/or of the accommodation reflex. The ON, TN and AN have their motor nuclei in the midbrain and pons that are interconnected by the medial longitudinal fasciculus [1].
On exiting the brainstem, these nerves have a long intracranial course, with AN having the longest in the subarachnoid cisterns, among all cranial nerves [1]. Hence, any disease conditions that affect the skull base and meninges can cause pathological changes (neuropathy) in these nerves. Trauma, especially torsional head injury is a cause for AN injury [2–5] and minor strain can result in isolated IV nerve palsy [6]. Inflammatory and infectious diseases like sarcoidosis, chronic meningitis (tuberculosis or Lyme disease) can cause neuropathy in both nerves [6]. The predominance of myelinated fibers in the ocular motor nerves [7] also predisposes the TN and AN to demyelinating diseases like multiple sclerosis [8–10].
Vascular aneurysms impinging on these nerves can cause compressive neuropathy [6]. Microvasculopathy secondary to diabetes, atherosclerosis, or hypertension also may cause isolated fourth nerve palsy [11]. Intracranial hypotension – after lumbar puncture has been reported to cause VI nerve palsy [12] . In addition, any space occupying tumour in the cranial cavity can cause compression neuropathy of these nerves. Elevated intracranial pressure causing brainstem displacement can lead to compression of the AN in the Dorello canal and this is responsible for up to 30% cases of isolated VI nerve palsy observed with pseudotumor cerebri [13]. The TN is also susceptible to trauma because of its long course and delicate structure. The traumatic compression by the overlying tentorium cerebelli is the most frequent cause of acquired TN paralysis [14–16]. Hence, detailed knowledge of each anatomical segment and components of the ocular motor nerves is crucial for investigations, diagnosis and management of various conditions arising in these nerves.
Often, clinical examinations do not reveal the exact site of pathological lesions; therefore various noninvasive techniques such as MRI have been used to study the normal and pathological ocular motor nerves [17]. However, morphometric data derived from noninvasive imaging modalities need to be correlated with actual morphological data in order to be meaningful to diagnosis. Therefore, reliable baseline morphological data that describes size, numbers and distribution of nerve fibers, derived from un-biased stereological methods [18], are required from across the ages to assess changes that may define either diseases or abnormal conditions. To our knowledge and after extensive search of scientific literature we did not find any study that described the TN and AN at various ages and therefore we have undertaken a detailed morphological study of the connective tissue organization and fiber composition of these nerves using un-biased stereological methods.
MATERIAL AND METHODS
Sample collection and processing
Twenty samples each of the pre-cavernous parts of the TN and AN were collected from the mortuary of the department of Forensic Medicine, within 12 hours of death of individuals of both sexes, whose age ranged from the second to the ninth decade without any reported history of diabetes mellitus, neurological diseases or ocular injuries. (Appropriate clearance was obtained from the Ethics Committee at the All India Institute of Medical Sciences, New Delhi, India for this study). The samples were divided into four groups of five nerve samples each according to the available minimum and maximum ages- group A had nerve samples from 12 to 20; group B, 21 – 40; group C, 41 – 60 years of age; and group D, 61 years and above.
Initially, the nerve samples were fixed in a solution containing 4% paraformaldehyde, 1% glutaraldehyde in 0.1M phosphate buffer (pH 7.4) for 48 hours and thereafter they were post-fixed in 1% osmium tetroxide in 0.1M phosphate buffer. The samples were processed for resin-embedding (Araldite) and 1 µm thick cross-sections of the nerves were obtained using a Reichert Ultramicrotome. The sections were stained with toluidene blue and mounted with araldite resin and were used for morphological observations and stereology. Specimens showing autolysis were not used in the study. The images of the nerves were outlined and traced using a mouse connected to a computer, under the 10X objective of an Olympus BX61 research microscope attached to CX9000 MBF Biosciences CCD camera which were calibrated and aligned with a calibration grid slide (250 µm, 25 µm) provided with the StereoInvestigator software (MicroBrightField Inc., VT, USA). The alignment of the motorized microscope was also calibrated parfocally and parcentrically to permit automatic movement of the image of the tracing when the objective lens is changed.
Morphometry
Cross-sectional area of the nerve
The cross sections of the nerves were often of different geometrical shapes and rarely irregular. Automated image analysis systems make the erroneous assumption that all axons are cylindrical tubes, therefore, instead of measuring multiple random diameters of the nerve transverse sections, we chose to measure the area by point counting method [19]. Subsequently, in order to follow the conventional reporting of nerve morphometry we also computed the diameter by the formula ‘d = 2√(A/π)’. The software applied a random point grid within the delineated contour of the nerve. We calculated the area of the cross section by using the formula Â=a/p.P (Â = area estimated, a/p= area per point (Δx. Δy), P = number of points hitting the cross section) [20]. Since the nerves were embedded in such a manner that the cutting surface was perpendicular to the length of the nerve, most of the cross-sections were of uniform dimensions; therefore we repeated the measurements randomly in at least three sections per nerve and the cross-sectional area was expressed as mean (µm2) (standard deviation-SD). Only the transversely sectioned nerve was used for estimation of area.
Designing a random sampling scheme for the fractionator
In toluidene blue stained sections of the nerves, myelinated fibers appeared as dark blue circles around the space occupied by the axons and only such fibers were counted in this study (Figure 1 and 2). Measurement of unmyelinated fibers has not been attempted because in such sections these fibers cannot be differentiated from connective tissue elements.
Figure 1.
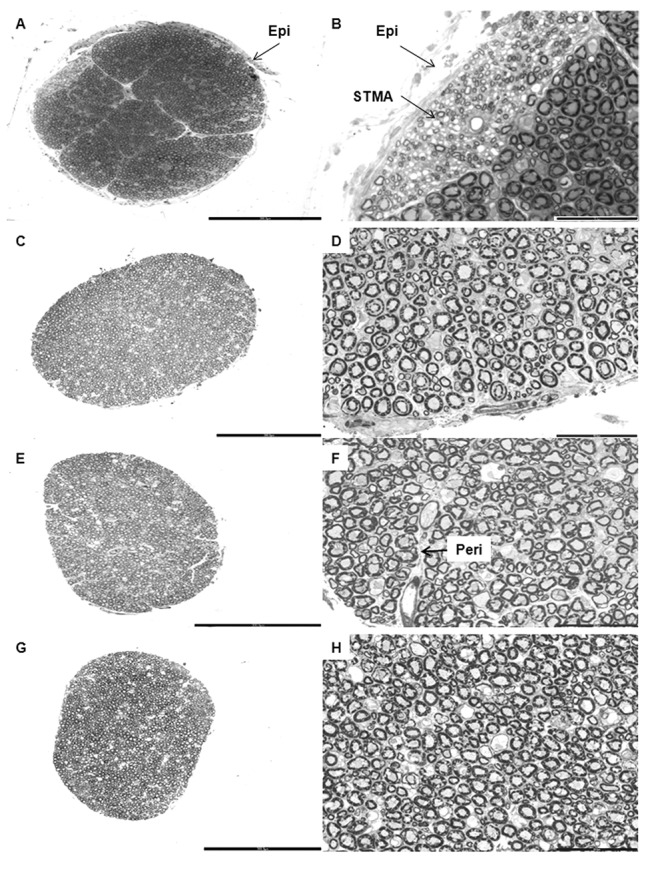
Cross-sections of the trochlear nerve in various age groups. Panel of low magnification (left column) and high magnification (right column) photomicrographs of toluidene blue stained semithin resin sections of trochlear nerves showing the Epineurium (Epi), Perineurium (Peri) and a bundle of Small Thinly Myelinated Axons (STMA). The darkly stained profiles seen in the micrographs are the myelin sheaths surrounding the axons of the trochlear nerve. A. and B. are of a 14 year old female; C. and D. are of a 38 year old female; E. and F. are of a 51 year old male and G. and H. are of a 71 year old male. Scale bar: A = C = E = G = 300 μm. B = D = F = H = 50 μm.
Figure 2.
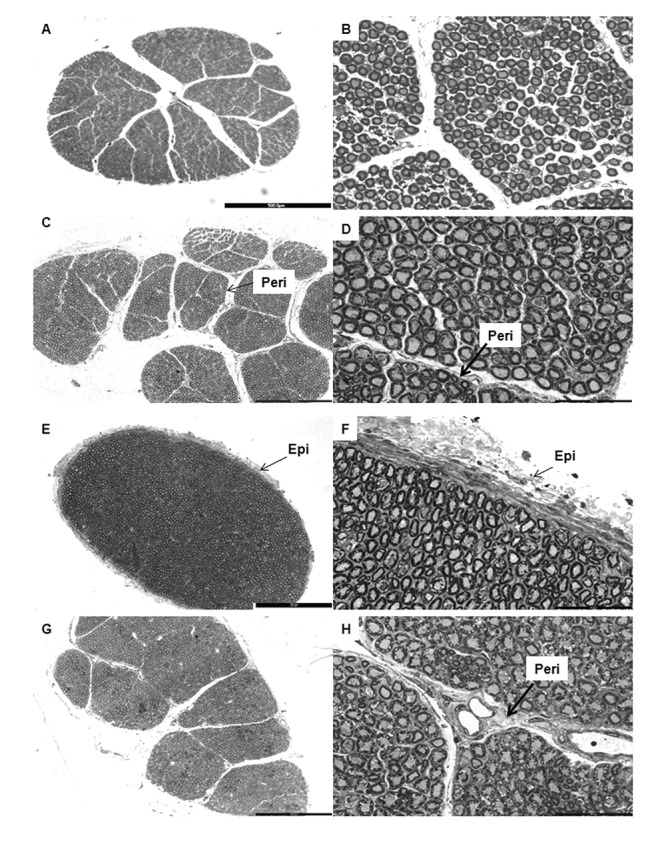
Cross-sections of the abducens nerve in various age groups. Panel of low magnification (left column) and high magnification (right column) photomicrographs of toluidene blue stained semithin resin sections of trochlear nerves showing the Epineurium (Epi) and Perineurium (Peri). The darkly stained profiles seen in the micrographs are the myelin sheaths surrounding the axons of the abducens nerve. A. and B. are of a 16 year old female; C. and D. are of a 24 year old female; E. and F. are of a 45 year old male and G. and H. are of a 61 year old man. Scale bar: A = 500 μm. C = E = G = 300 μm. B = D = F = H = 50 μm.
We determined the number of myelinated axons in TN and AN by using the fractionator probe of the SteroInvestigator software that uses systematic random sampling method for counting nerve fibers [21–22]. Initially, we undertook a pilot study in order to estimate the counting frame size, the grid size and the number of sections that we would have to analyze systematically in order to get a coefficient of error (CE) below 0.05 [19]. We estimated the CE using the formula CE (N) =1/√ΣQ (1-sf), where ‘Q’ is the number of profiles counted and ‘sf’ is the sampling fraction. We used a counting frame area ‘a’ of 625 µm2 (25 µm × 25 µm) and a sampling grid area (dx.dy) of 62,500 µm2 (250µm × 250µm) for all the nerve samples measured. When we multiply the number of axons counted with the unbiased counting frames ‘Q’, by the inverse sampling fraction, 1/sf (sf = a/dx.dy) we get an unbiased estimate of the total number of the myelinated axons (N=Q.1/sf) [19]. We counted and measured the myelinated axons at a final magnification of 600X under an oil-immersion objective lens. We used the ‘unbiased counting rule’ of Gundersen [23] and Sterio [18] that uses two exclusion edges (left and lower) and two inclusion edges (upper and right) on the images while counting [23] (Supplementary Figure 1).
Estimation of axonal area of myelinated fiber and myelin thickness
We estimated the area of the axons of the myelinated fibers by the 2D nucleator probe that uses randomly placed isotropic lines intersecting the axonal and myelin profiles (Supplementary Figure 1 inset). The area ‘a’ was taken as πl2, where ‘l’ is test line from the centre to the profile boundary [20, 24]. We measured the myelin thickness by subtracting the estimated diameter of the axon from that of the whole nerve fiber.
We divided the fibers of TN and AN into three groups according to their axonal area (small: < 10 µm2, medium: 10 – 20 µm2 and large: >20 µm2) [7].
Statistical Analysis
We used mean (SD) to represent the data and analyzed them by using the statistical software SPSS (version 15.0, Chicago, Illinois). We compared the data with respect to different age groups using one-way analysis of variance (ANOVA) and post hoc comparison by using Bonferroni multiple comparison tests. A ‘p’ value of less than 0.05 was taken as significant. Unfortunately, we were unable to undertake two-way ANOVA to check for the effect of gender difference on the various parameters because groups C and D contained exclusively male subjects.
RESULTS
General organization of the TN and AN
The cross-sections of the nerves revealed various shapes, the most common being oval for the TN and circular for the AN, although on many occasions they were irregular or even reniform due to their thin epineurium.
Organization of connective tissue coverings and myelinated nerve fibers
The TN and AN were covered by a thin layer of dense irregular connective tissue- the epineurium, which ensheathed the nerve fascicles and contained blood vessels that had smaller branches penetrating the perineurium. The endoneureal tube, made of delicate connective tissue, enclosed individual axons and contained numerous capillaries. Connective tissue septae from the epineurium divided many of the nerves into fascicles (Figure 1–2). Nerves with a thicker epineurium had fewer fascicles (Figure 2E). In the TN, only 30% of the nerves had well defined fascicles; whereas the AN had an average of eight fascicles (Figure 2). The myelinated fibers in the fascicles were more compactly arranged in earlier age groups than in later ones in both TN and AN.
Distribution of small thinly myelinated fibers
Although most of the fibers in TN and AN were intermingled with each other, a discrete group of small thinly myelinated fibers was found as a separate fascicle in the TN samples up to 40 years of age (Figure 1B). The loose connective tissue around these isolated fascicles appeared lighter stained. In the older age groups, this fascicle was no longer distinguishable as a separate entity.
In the AN, such a separate fascicle of small thinly myelinated fibers was not evident. However, the AN up to 40 years of age, had such fibers predominantly distributed towards the periphery of the nerve; whereas above 41 years similar fibers were found around the central region.
Trochlear nerve-quantitative analysis
Cross-sectional area
The mean cross-sectional area in groups A, B, C and D are presented in Table 1. There was no significant difference in the cross sectional area of the TN across the age groups (p=0.594).
Table 1:
Morphometric parameters of human trochlear nerve
| Age Groups (Years) | No. of samples | Mean cross sectional area of nerve (mm2)(SD) | Mean estimated myelinated fibers (SD) | Mean axonal area of myelinated fibers (μm2) (SD) | Axonal Diameter (μm) | Mean myelin thickness (μm)(SD) | Percentage distribution of fibers (%) | ||
|---|---|---|---|---|---|---|---|---|---|
| Small | Medium | Large | |||||||
| A (0–20) | 5 | 0.26 (0.05) | 2280 (683.37) | 22.69 (7.24) | 5.37 | 1.84 (0.88) | 25.61 | 30.49 | 43.9 |
| B (21–40) | 5 | 0.27 (0.08) | 1920 (294.96) | 23.27 (7.36) | 5.44 | 2.42 (0.71)# | 13.68 | 27.37 | 58.95 |
| C (41–60) | 5 | 0.28 (0.08) | 2400 (758.29) | 24.13 (3.38) | 5.54 | 2.46 (0.53)# | 12.19 | 26.83 | 60.98 |
| D (>60) | 5 | 0.23 (0.06) | 2140 (541.29) | 19.45 (2.64) | 4.98 | 2.48 (0.39)# | 17.95 | 35.9 | 46.15 |
For ease of understanding, the axonal diameter has been computed from the mean axonal area. One way ANOVA followed by post-hoc Bonferroni multiple comparison test (#p <0.0001)
Estimated myelinated fiber count
The number of myelinated nerve fibers in the TN ranged from 1100 to 3000. The estimated mean myelinated fiber count in groups A, B, C and D are given in Table 1. There was no significant difference in the estimated myelinated axonal counts between the various age groups (p=0.626).
Axonal area of myelinated fibers
The axonal area of myelinated fibers of the TN ranged from 16.09 μm2 to 34.60 μm2 (diameter 4.53 to 6.64 µm). The mean axonal area of myelinated fibers in groups A, B, C and D is specified in Table 1 and here too there was no significant difference observed between the various groups (p=0.693).
Overall, the TN had 18% small, 29.5% medium and 52.5% large myelinated fibers (Table 1). There was no significant difference in the percentage distribution of the various myelinated fiber types between the age groups (Pearson chi square = 7.9886) (p=0.239).
Myelin thickness
The myelin thickness of the TN ranged from 1.57 μm to 2.60 μm. The average myelin thickness in groups A, B, C and D are given in Table 1. The myelin thickness of group A (up to 20 years) was significantly different in comparison to the other groups (B, C and D) (p <0.0001) (Table 1).
Abducens nerve-quantitative analysis
The AN appeared larger in cross-section, with many more nerve fascicles than the TN. But the epineurium of the AN was in general thinner than that of the TN.
Cross-sectional area
The cross-sectional area of the AN varied from 0.36 mm2 to 1.32 mm2. The mean cross-sectional area in groups A, B, C and D are mentioned in Table 2. There was no significant difference in the cross sectional area among the various age groups (p=0.457).
Table 2:
Morphometric parameters of human abducens nerve
| Age Groups (Years) | No. of samples | Mean cross sectional area of nerve (mm2) (SD) | Mean estimated myelinated fibers | Mean axonal area of myelinated fibers (μm2) (SD) | Axonal Diameter (μm) | Mean myelin thickness (μm) (SD) | Percentage distribution of fibers(%) | ||
|---|---|---|---|---|---|---|---|---|---|
| Small | Medium | Large | |||||||
| A (0–20) | 5 | 0.86 (0.15) | 5380 (861.39) | 24.57 (5.91) | 5.59 | 2.78(0.51) | 8.45 | 31.69 | 59.86 |
| B (21–40) | 5 | 0.95 (0.36) | 5120 (1145.43) | 26.93 (5.53) | 5.85 | 2.79 (0.44) | 5.84 | 33.58 | 60.58 |
| C (41–60) | 5 | 0.67 (0.33) | 4600 (1662.83) | 24.22 (4.39) | 5.55 | 2.68 (0.52)* | 9.27 | 28.87 | 61.86 |
| D(>60) | 5 | 0.78 (0.32) | 4580 (1845.81) | 23.72 (6.01) | 5.49 | 2.90 (0.51)* | 8.83 | 30.39 | 60.78 |
For ease of understanding, the axonal diameter has been computed from the mean axonal area. One way ANOVA followed by post-hoc Bonferroni multiple comparison test (*p <0.05)
Estimated myelinated fiber count
The myelinated fiber count in the AN ranged from 1600 to 7000. The estimated mean myelinated fiber count in groups A, B, C and D are presented in Table 2 and did not show any significant difference among the age groups (p=0.768).
Axonal area of myelinated fibers
The axonal area of the myelinated fibers of the AN varied from 14.35 μm2 to 34.35 μm2 (diameter 4.27 to 6.61 µm). The mean axonal area of the myelinated fibers in groups A, B, C and D are listed in Table 2. There was no significant difference in the mean axonal area of the myelinated fibers among the various age groups (p=0.799).
On the whole, the AN had 8% small, 31% medium and 61% large myelinated fibers (Table 2). There was no significant difference in the percentage distribution of different myelinated fibers across different age groups (Pearson chi square = 1.6060) (p=0.952).
Myelin thickness
The myelin thickness of the individual nerve fibers of AN ranged from 2.40 μm to 3.36 μm. The mean myelin thickness in groups A, B, C and D are given in Table 2. Significant difference in myelin thickness was observed between groups C and D (p=0.013) (Table 2).
DISCUSSION
This study provides morphometric data on the age related changes in the human TN and AN using state of the art modern stereological techniques. To the best of our knowledge this is the first report of the count of myelinated fibers using unbiased stereological methods in the human TN in the young, adult and old individuals.
Methodology and Morphometry
Most of the techniques used in earlier studies for estimating the morphological parameters of the nerves are biased to a variable extent. To overcome these methodological problems, stereological techniques such as the fractionator [25] have been successfully used to compute the number of myelinated fibers (Suppl. Fig. 1). Mayhew [26] and Larsen [19] further extended this application to get a precise estimate of parameters such as area, perimeter and myelin thickness of the nerve. In our laboratory, the developing human fetal cochlear nerve and age changes in the human oculomotor nerve have been studied successfully using unbiased stereology [7, 27]. This unbiased method represents an important advancement in quantitative morphological assessment of tissues and organs [28]. In the present study, fractionator and 2D nucleator were used to count and measure the myelinated nerve fibers without relying on any assumptions about their size, shape and orientation.
Organization of connective tissue and nerve fascicles
The connective tissue organization of the TN and AN is of great clinical importance as it provides the primary structural framework, biomechanical protection and also acts as a vehicle for carrying blood vessels to the nerve. The ill-defined fascicles noted in the cisternal portion of these nerves in all age groups may explain why this portion of these nerves is more prone to compressive forces. These fibers derive their blood supply from pial blood vessels that predispose them to ischaemia during stretching and compression [29]. The early onset of the sixth cranial nerve palsy seen in cases of raised intracranial pressure [30] could be explained by the thin and fragile epineurium of the AN, as noted in the present study. The scanty connective tissue support, noted in the present study, in these nerves could predispose them to easier disruption of the blood nerve barrier [31–32].
Distribution of small thinly myelinated fibers
We found a characteristically identifiable bundle of small thinly myelinated fibers in the TN samples up to 40 years of age. Even though small thinly myelinated fibers were identifiable in the older age groups, however, they were integrated in the main nerve mass. A similar group of putative pupillomotor fibers was noted in the third cranial nerves [7, 33–34]. Similar group of fibers, of undetermined origin were observed in fetal trochlear nerves [35] and it was speculated that these fibers could be either the nervi tentori- a meningeal branch of the ophthalmic nerve, or sympathetic fibers from the internal carotid plexus. It may be argued that these could be artifacts of processing; however, the consistent appearance of these bundles in the younger age group proves that this is more than an artifact. In order to determine the nature of these distinct group of fibers, both in the ON and TN, further studies involving a greater number of specimens, and exhaustive sectioning and examination of the entire cisternal segment of these cranial nerves is needed. Immunohistochemical and lesion studies in animal models will confirm our observations.
In the AN, such a separate fascicle was not visible, but we did notice that there was a difference in the distribution of small thinly myelinated nerve fibers across the ages. In the younger age groups these fibers were located more peripherally, whereas in the older age groups they were located more centrally. As observed in the ON, it may be likely that there is a redistribution of small thinly myelinated fibers in the AN with age or anatomical location [34]. This requires confirmation by exhaustive serial sectioning and immunohistochemical study for different fiber types (cholinergic/catecholaminergic) in the entire cisternal segment of the AN.
Counts and measurements: Cross sectional area
There are very few morphometric studies available related to the adult human TN and AN [33, 35]. A recent radiologic study reported that the average diameter of the adult TN and AN ranged from 0.75 to 1 mm and 0.43 to 1.85 mm, respectively [13] which amounts to an area of 0.44 to 0.78 mm2 and 0.14 to 2.68 mm2 for the TN and AN. Radiologic studies are usually conducted on live persons and the plane of the images are parallel to a given reference plane. Therefore, if the nerve has a sinuous course, it is likely that the diameter of the nerve may be over-estimated due to sections being oblique to the longitudinal axis of the nerve whereas, in our study the cisternal portion of the TN and AN has been positioned in such a way that the cutting surface would be always perpendicular to the longitudinal axis of the nerve. The discrepancy between the available radiological data and histological data of the present study (Tables 1–2) may also be due to shrinkage of the tissue during histological processing, even though the tissue shrinkage is least with resin embedding [36–38].
Trochlear nerve
Myelinated fibers count
Ocular motor nerves contain efferent and afferent fibers that may be either myelinated or unmyelinated. Reports in literature indicate that myelinated fibers predominate in these nerves [7, 39]. Our findings (Table 1 &2) are not quite in agreement with previous studies [33, 35] that were on electron microscopic montages, and counting frames were chosen manually, therefore were inherently biased. The unbiased stereological fractionator probe used in the present study enabled us to count the myelinated fibers without relying on any assumptions about their size, shape or orientation [19, 40–41]; therefore, the results of the present study are more reliable.
Mean axonal area of myelinated fibers, fiber composition and myelin thickness of TN
In the present study, axonal area of myelinated fibers and myelin thickness was calculated using 2D nucleator probe, which showed no significant difference in the axonal area of myelinated fibers between the various age groups (Tables 1–2). Therefore, it can be concluded that there is very little change in the fiber morphology with aging. Ocular motor myelinated nerve fibers were classified according to their axonal area into small (<10 µm2), medium (10–20 µm2) and large fibers (>20 µm2) [7]. In our study, we found that the TN was predominantly made of large fibers as also seen by Sunderland and Hughes [33].
There was a significant difference in the myelin thickness between the younger and all other older age groups (Table 1). Myelin thickness of the human TN apparently increases with age, probably due to addition of newer lamellae [10]. However, in our light microscopic study we observed that in the older age groups (Groups B, C and D) there was no significant change in the myelin thickness with increasing age. This finding needs to be confirmed by morphometry on transmission electron microscopic pictures using the 2D nucleator probe. The only available data for comparison of myelin thickness in the human TN was in samples of a fetus (2.8 months before birth) where it was 1.00 µm and in a 17 year old, in which it was 2.00 µm. However, these were manually measured using an ocular micrometer [42].
Abducens Nerve
Myelinated fibers count
The present study is the first precise report on the count of myelinated fibers in the human AN covering a wide range of age groups (Table 2). The counts in the present study are higher than that reported by Sawabe et al. [39] in aged (63–88 years old) subjects, in which the counts ranged from 1473 to 2638. This discrepancy in the findings may be due to the methodological disparity in the two studies, the latter having been done using older morphometric methods using camera lucida drawings and customised programs [39].
Mean axonal area of myelinated fibers, myelin thickness and fiber composition of AN
In the present study there was no significant change in the axonal area of myelinated fibers with age in AN (Table 2), but there was a significant increase in the myelin thickness of AN between group C and group D (Table 2) (p< 0.05). But to come to a definite conclusion regarding an increased myelin thickness, further studies with a greater number of samples and electron microscopy needs to be undertaken [43].
Since the groups were not uniform in terms of male and female subjects, we cannot conclude that the significant differences observed in myelin thickness both in the TN and AN were due solely to differences in age.
CONCLUSION
In our study, the ocular motor nerves do not show evident microscopic changes due to aging except with respect to myelin thickness. Reason for this apparent robustness of the ocular nerves a propos aging may be due to the high level of motor activity in the muscles supplied by these nerves as suggested by Sturrock [44]. There are differing schools of thought about the relationship between gaze disorders and aging [45–50]; however, after the studies in our laboratory on all three ocular motor nerves (III, IV and VI), we believe that there may be other factors that affect the function of these nerves that eventually cause diplopia and different gaze disorders [7].
SUPPLEMENTARY
Print screen of Optical fractionator and Nucleators in StereoInvestigator Software. This figure illustrates the optical fractionator and the nucleator methods. The unbiased counting frame is used with the fractionator probe. Axonal profiles contained either within the frame or touching the green lines were counted; whereas those that touched the ‘forbidden’ red lines were excluded. For the nucleator, a uniform random point within the profile of the axon is used to generate isotropic rays (in yellow) and the distances from the sampled point to the boundaries of the axon profile are marked (as depicted diagramtically in the left inset).
Print Screen showing the morphometric program workflow in StereoInvestigator Software. This figure illustrates the nerve sectional profile contour (N) showing the unbiased counting frame (F) and the sampling grid (G). The contour was traced at a magnification of 100X using a BX61 motorized Olympus microscope. The ideal sampling grid size for this study was determined to be 250µm × 250µm and the unbiased counting frame was 25µm × 25µm. The axon profiles within the unbiased counting frame or touching its green lines were counted, whereas those that touched the ‘forbidden’ red lines were excluded.
Acknowledgments
We acknowledge the contribution of the technical staff of the department of Forensic Medicine, and Electron Microscopic Facility of the Department of Anatomy at All India Institute of Medical Sciences, New Delhi, India. The basic infrastructure of the department of Anatomy was used for this study.
Footnotes
Footnote
Abbreviations used: AN- abducens nerve, ON-oculomotor nerve, TN- trochlear nerve
REFERENCES
- [1].Glimcher PW. Eye movements. In: Squire LR, Bloom FE, McConnel SK, Roberts JL, Spitzer NC, Zigmond MJ, editors. Fundamental Neuroscience. 2nd Edn. New York: Academic Press; 2003. pp. 873–892. [Google Scholar]
- [2].Calisaneller T, Ozdemir O, Altinors N. Posttraumatic acute bilateral abducens nerve palsy in a child. Childs Nerv Syst. 2006;22:726–728. doi: 10.1007/s00381-005-0036-9. [DOI] [PubMed] [Google Scholar]
- [3].Dwarakanath S, Gopal S, Venkataramana NK. Post-traumatic bilateral abducens nerve palsy. Neurol India. 2006;54:221–222. [PubMed] [Google Scholar]
- [4].Kurbanyan K, Lessell S. Intracranial hypotension and abducens palsy following upper spinal manipulation. Br J Ophthalmol. 2008;92:153–155. doi: 10.1136/bjo.2007.119313. [DOI] [PubMed] [Google Scholar]
- [5].Hanu-Cernat LM, Hall T. Late onset of abducens palsy after Le Fort I maxillary osteotomy. Br J Oral Maxillofac Surg. 2009;47:414–416. doi: 10.1016/j.bjoms.2008.10.005. [DOI] [PubMed] [Google Scholar]
- [6].Brazis PW. Palsies of the trochlear nerve: diagnosis and localization- recent concepts. Mayo Clin Proc. 1993;68:501–509. doi: 10.1016/s0025-6196(12)60201-8. [DOI] [PubMed] [Google Scholar]
- [7].Sharma S, Ray B, Bhardwaj D, Dwivedi AK, Roy TS. Age changes in the human oculomotor nerve. A stereological study. Ann Anat. 2009;191:260–266. doi: 10.1016/j.aanat.2009.02.008. [DOI] [PubMed] [Google Scholar]
- [8].Jacobson DM, Moster ML, Eggenberger ER, Galetta SL, Liu GT. Isolated trochlear nerve palsy in patients with multiple sclerosis. Neurology. 1999;53:877–879. doi: 10.1212/wnl.53.4.877. [DOI] [PubMed] [Google Scholar]
- [9].Barr D, Kupersmith MJ, Turbin R, Bose S, Roth R. Isolated sixth nerve palsy: an uncommon presenting sign of multiple sclerosis. J Neurol. 2000;247:701–704. doi: 10.1007/s004150070114. [DOI] [PubMed] [Google Scholar]
- [10].Peters GB, 3rd, Bakri SJ, Krohel GB. Cause and Prognosis of nontraumatic sixth nerve palsies in young adults. Ophthalmology. 2002;109:1925–1928. doi: 10.1016/s0161-6420(02)01226-5. [DOI] [PubMed] [Google Scholar]
- [11].Keane JR. Fourth nerve palsy: historical review and study of 215 inpatients. Neurology. 1993;43:2439–2443. doi: 10.1212/wnl.43.12.2439. [DOI] [PubMed] [Google Scholar]
- [12].Anwar S, Nalla S, Fernando DJ. Abducens nerve palsy as a complication of lumbar puncture. Eur J Intern Med. 2008;19:636–637. doi: 10.1016/j.ejim.2008.03.007. [DOI] [PubMed] [Google Scholar]
- [13].Adams ME, Linn J, Yousry I. Pathology of the Ocular Motor Nerves III, IV, and VI. Neuroimag Clin N Am. 2008;18:261–282. doi: 10.1016/j.nic.2007.11.001. [DOI] [PubMed] [Google Scholar]
- [14].Jefferson G. Isolated oculomotor palsy caused by intracranial aneurysm. Proc R Soc Med. 1947;40:419–432. doi: 10.1177/003591574704000801. [DOI] [PMC free article] [PubMed] [Google Scholar]
- [15].Rucker CW. The causes of paralysis of the third, fourth and sixth cranial nerves. Am J Ophthalmol. 1966;61:1293–1298. doi: 10.1016/0002-9394(66)90258-3. [DOI] [PubMed] [Google Scholar]
- [16].Burger LJ, Kalvin NH, Smith JL. Acquired lesions of the fourth cranial nerve. Brain. 1970;93:567–574. doi: 10.1093/brain/93.3.567. [DOI] [PubMed] [Google Scholar]
- [17].Ferreira T, Verbist B, van Buchem M, van Osch T, Webb A. Imaging the ocular motor nerves. Euro J Radiol. 2010;74:314–322. doi: 10.1016/j.ejrad.2009.05.066. [DOI] [PubMed] [Google Scholar]
- [18].Sterio DC. The unbiased estimation of number and sizes of arbitrary particles using the disector. J Microsc. 1984;134:127–136. doi: 10.1111/j.1365-2818.1984.tb02501.x. [DOI] [PubMed] [Google Scholar]
- [19].Larsen JO. Stereology of nerve cross sections. J Neurosci Meth. 1998;85:107–118. doi: 10.1016/s0165-0270(98)00129-0. [DOI] [PubMed] [Google Scholar]
- [20].Howard CV, Reed MG. Unbiased stereology- three dimensional measurement microscopy. Springer-Verlag; New York, NY: 1998. Random sampling and random geometry; pp. 19–33. [Google Scholar]
- [21].Mayhew TM, Sharma AK. Sampling schemes for estimating nerve fiber size. I. Methods for nerve trunks of mixed fascicularity. J Anat. 1984;139:45–58. [PMC free article] [PubMed] [Google Scholar]
- [22].Mayhew TM, Sharma AK. Sampling schemes for estimating nerve fiber size. II. Methods for unifascicular nerve trunks. J Anat. 1984;139:59–66. [PMC free article] [PubMed] [Google Scholar]
- [23].Gundersen HJG. Notes on estimation of numerical density of arbitrary profiles: the edge effect. J Microsc. 1977;111:219–223. [Google Scholar]
- [24].Gundersen HJG. The nucleator. J Microsc. 1988;15:3–21. doi: 10.1111/j.1365-2818.1988.tb04609.x. [DOI] [PubMed] [Google Scholar]
- [25].Gundersen HJG. Stereology of arbitrary particles. A review of unbiased number and size estimators and the presentation of some new ones, in memory of William R Thompson. J Microsc. 1986;143:3–45. [PubMed] [Google Scholar]
- [26].Mayhew TM. An efficient sampling scheme for estimating fiber number from nerve cross sections: The fractionators. J Anat. 1988;157:127–134. [PMC free article] [PubMed] [Google Scholar]
- [27].Ray B, Roy TS, Wadhwa S, Roy KK. Development of the human fetal cochlear nerve: a morphometric study. Hear Res. 2005;202:74–86. doi: 10.1016/j.heares.2004.09.013. [DOI] [PubMed] [Google Scholar]
- [28].Schmitz C, Hof PR. Design-based stereology in neuroscience. Neuroscience. 2005;130:813–831. doi: 10.1016/j.neuroscience.2004.08.050. [DOI] [PubMed] [Google Scholar]
- [29].Miller NR. Walsh and Hoyts Clinical Neuro-Ophthalmology. Vol. 1. Williams & Wilkins; Baltimore, MD: 2005. pp. 969–1040. [Google Scholar]
- [30].Caramel JP, Bonnel F, Rabischong P. The oculomotor nerves: biometry and endoneural fascicular systematization. Anat Clin. 1983;5:159–168. doi: 10.1007/BF01799001. [DOI] [PubMed] [Google Scholar]
- [31].Thomas PK. The connective tissue of peripheral nerve: an electron microscope study. J Anat. 1963;97:35–44. [PMC free article] [PubMed] [Google Scholar]
- [32].Allt G, Lawrenson JG. The blood-nerve barrier: enzymes, transporters and receptors--a comparison with the blood-brain barrier. Brain Res Bull. 2000;52:1–12. doi: 10.1016/s0361-9230(00)00230-6. [DOI] [PubMed] [Google Scholar]
- [33].Sunderland S, Hughs ESR. The pupilloconstrictor pathway and the nerves to the ocular muscles in man. Brain. 1946;69:301–309. doi: 10.1093/brain/69.4.301. [DOI] [PubMed] [Google Scholar]
- [34].Kerr FWL, Hollowell OW. Location of pupillomotor and accommodation fibers in the oculomotor nerves: experimental observations of paralytic mydriasis. J Neurol Neurosurg Psychiatry. 1964;27:473–481. doi: 10.1136/jnnp.27.5.473. [DOI] [PMC free article] [PubMed] [Google Scholar]
- [35].Mustafa GY, Gamble HJ. Changes in axonal numbers in developing human trochlear nerve. J Anat. 1979;128:323–330. [PMC free article] [PubMed] [Google Scholar]
- [36].Schuz A, Palm G. Density of neurons and synapses in the cerebral cortex of the mouse. J Comp Neurol. 1989;286:442–445. doi: 10.1002/cne.902860404. [DOI] [PubMed] [Google Scholar]
- [37].Miettinen RA, Kalesnykas G, Koivisto EH. Estimation of the total number of cholinergic neurons containing estrogen receptor- in the rat basal forebrain. J Histochem Cytochem. 2002;50:891–902. doi: 10.1177/002215540205000703. [DOI] [PubMed] [Google Scholar]
- [38].Edwards K, Griffiths D, Morgan J, Pitman R, von Ruhland C. Can the choice of intermediate solvent or resin affect glomerular basement membrane thickness? Nephrol Dial Transplant. 2009;24:400–403. doi: 10.1093/ndt/gfn504. [DOI] [PubMed] [Google Scholar]
- [39].Sawabe Y, Matsumoto K, Goto N, Otsuka N, Kobayashi N. Morphometric nerve fiber analysis and aging process of the human abducent nerve. Okajimas Folia Anat Jpn. 1998;74:337–343. doi: 10.2535/ofaj1936.74.6_337. [DOI] [PubMed] [Google Scholar]
- [40].Geuna S. Appreciating the difference between design-based and model-based sampling strategies in quantitative morphology of the nervous system. J Comp Neurol. 2000;427:333–339. [PubMed] [Google Scholar]
- [41].Kaplan S, Geuna S, Ronchi G, Ulkay MB, von Bartheld CS. Calibration of the stereological estimation of the number of myelinated axons in the rat sciatic nerve: A multicenter study. J Neurosci Methods. 2010;187:90–99. doi: 10.1016/j.jneumeth.2010.01.001. [DOI] [PMC free article] [PubMed] [Google Scholar]
- [42].Schroder JM, Bohl J, Von Bardeleben U. Changes of the ratio between myelin thickness and axon diameter in human developing sural, femoral, ulnar, facial and trochlear nerves. Acta Neuropathol. 1988;76:471–483. doi: 10.1007/BF00686386. [DOI] [PubMed] [Google Scholar]
- [43].Peters A. The effects of normal aging on myelin and nerve fibers: a review. J Neurocytol. 2002;31:581–593. doi: 10.1023/a:1025731309829. [DOI] [PubMed] [Google Scholar]
- [44].Sturrock RR. Stability of neuron and glial number in the abducens nerve nucleus of the ageing mouse brain. J Anat. 1989;166:97–101. [PMC free article] [PubMed] [Google Scholar]
- [45].Huaman AG, Sharpe JA. Vertical saccades in senescence. Invest Ophthalmol Vis Sci. 1993;34:2588–2595. [PubMed] [Google Scholar]
- [46].Moschner C, Baloh RW. Age-related changes in visual tracking. J Gerontol. 1994;49:M235–238. doi: 10.1093/geronj/49.5.m235. [DOI] [PubMed] [Google Scholar]
- [47].Oguro H, Okada K, Suyama N, Yamashita K, Yamaguch S, Kobayashi S. Decline of vertical gaze and convergence with aging. Gerontology. 2004;50:177–178. doi: 10.1159/000076777. [DOI] [PubMed] [Google Scholar]
- [48].Qing Y, Kapoula Z. Saccade-vergence dynamics and interaction in children and adults. Exp Brain Res. 2004;156:212–223. doi: 10.1007/s00221-003-1773-1. [DOI] [PubMed] [Google Scholar]
- [49].Rambold H, Neuman G, Sander T, Helmchen C. Age-related changes of vergence under natural viewing conditions. Neurobiol Aging. 2005;27:163–172. doi: 10.1016/j.neurobiolaging.2005.01.002. [DOI] [PubMed] [Google Scholar]
- [50].Yang Q, Kapoula Z. Aging does not affect the accuracy of vertical saccades nor the quality of their binocular coordination: a study of a special elderly group. Neurobiol Aging. 2008;29:622–638. doi: 10.1016/j.neurobiolaging.2006.11.007. [DOI] [PubMed] [Google Scholar]
Associated Data
This section collects any data citations, data availability statements, or supplementary materials included in this article.
Supplementary Materials
Print screen of Optical fractionator and Nucleators in StereoInvestigator Software. This figure illustrates the optical fractionator and the nucleator methods. The unbiased counting frame is used with the fractionator probe. Axonal profiles contained either within the frame or touching the green lines were counted; whereas those that touched the ‘forbidden’ red lines were excluded. For the nucleator, a uniform random point within the profile of the axon is used to generate isotropic rays (in yellow) and the distances from the sampled point to the boundaries of the axon profile are marked (as depicted diagramtically in the left inset).
Print Screen showing the morphometric program workflow in StereoInvestigator Software. This figure illustrates the nerve sectional profile contour (N) showing the unbiased counting frame (F) and the sampling grid (G). The contour was traced at a magnification of 100X using a BX61 motorized Olympus microscope. The ideal sampling grid size for this study was determined to be 250µm × 250µm and the unbiased counting frame was 25µm × 25µm. The axon profiles within the unbiased counting frame or touching its green lines were counted, whereas those that touched the ‘forbidden’ red lines were excluded.