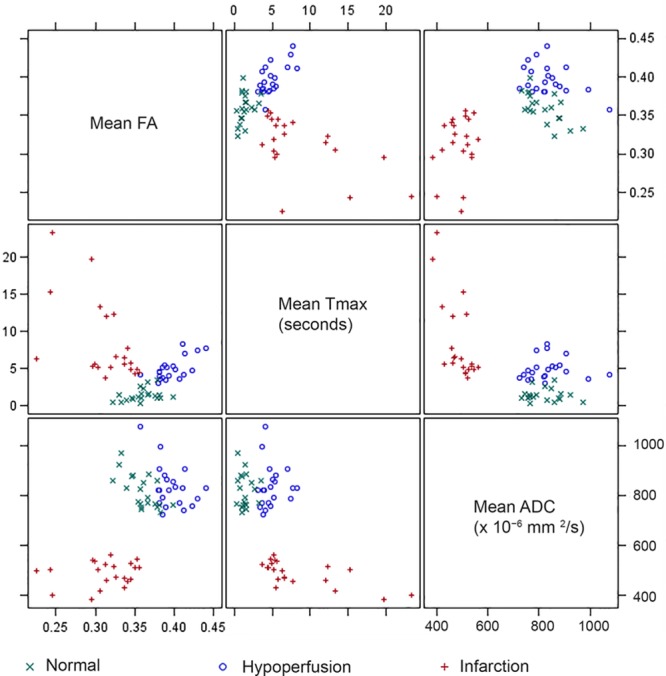
Figure 2.

Scatter plots for fractional anisotropy (FA), Tmax, and apparent diffusion coefficient (ADC) mean values by region. The correlation pattern is different depending on the region. In the normal white matter (WM), FA, and ADC have a moderate negative correlation (rs=−0.590; P=0.005). In the hypoperfused WM, Tmax and FA have moderate positive correlation (rs=0.561; P=0.008). In the infarcted WM, there are moderate negative correlations between Tmax and FA (rs=−0.539; P=0.012) and Tmax and ADC (rs=−0.681; P<0.001).
