
Figure 2.
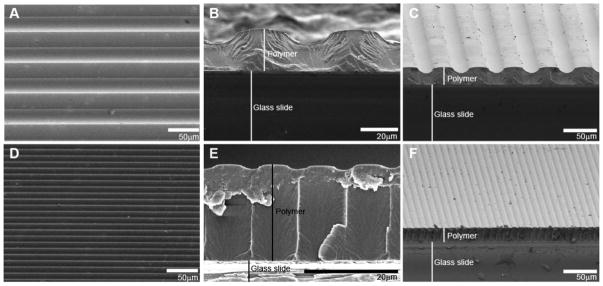
Representative SEM images of micropatterned HMA-co-HDDMA polymers. A–C) SEM images of a pattern with 50 μm periodicity and channel amplitude of 8 μm. D–F) SEM images of a pattern with 10 μm periodicity and channel amplitude of 1 μm. Shown are: top down views (A),(D); cross-sectional views (B),(E); and angled cross-sectional views (C),(F). Gradual transitions between ridges and grooves are evident in photopolymerized micropatterns.