Abstract
We present an analysis framework for large studies of multimodal clinical quality brain image collections. Processing and analysis of such datasets is challenging due to low resolution, poor contrast, mis-aligned images, and restricted field of view. We adapt existing registration and segmentation methods and build a computational pipeline for spatial normalization and feature extraction. The resulting aligned dataset enables clinically meaningful analysis of spatial distributions of relevant anatomical features and of their evolution with age and disease progression. We demonstrate the approach on a neuroimaging study of stroke with more than 800 patients. We show that by combining data from several modalities, we can automatically segment important biomarkers such as white matter hyperintensity and characterize pathology evolution in this heterogeneous cohort. Specifically, we examine two sub-populations with different dynamics of white matter hyperintensity changes as a function of patients’ age. Pipeline and analysis code is available at http://groups.csail.mit.edu/vision/medical-vision/stroke/.
1 Introduction
We present a framework to summarize and quantify large multimodal collections of clinical images in population studies of neurological disease. We use registration and segmentation algorithms to build robust computational pipelines that handle variable image quality and large image set sizes. Large population studies with clinical quality multimodal images present many challenges, including poor resolution, varying slice acquisition directions and orientations across modalities, poor contrast, limited field of view, and misalignment of scans of different modalities. In this work, we develop insights for adapting existing algorithms to clinical images, and use these insights to build a robust and scalable framework. We demonstrate the application of the methods on a preliminary study of over 800 patients with the goal of expanding the study by an order of magnitude in the near future by including images from multiple sites.
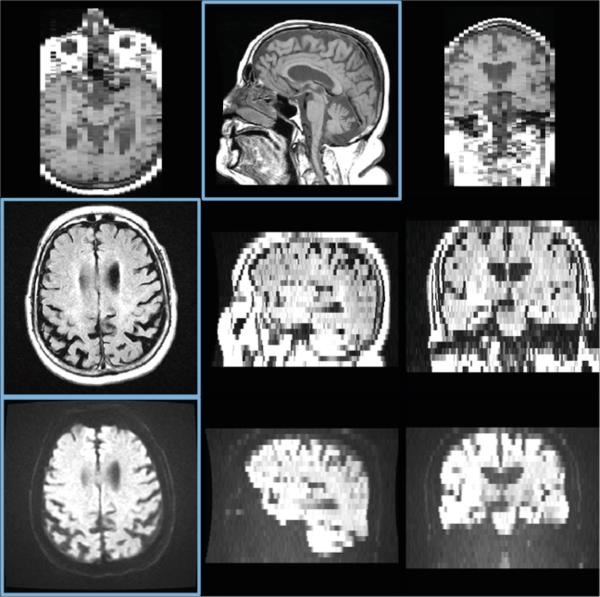
Our work is motivated by a large scale imaging study of stroke. The brain scans are acquired within a few hours of stroke onset, which limits scanning time and requires fast imaging protocols. Due to the acquisition constraints, scans of different modalities are not only low resolution (with greater than 5mm slice thickness), but are also anisotropic in different directions as illustrated in Figure 1. Distinguishing between white and gray matter is challenging in the resulting T1 images, even for an expert, due to poor tissue contrast. To assess susceptibility to cerebral ischemia (insufficient blood flow to the brain) and predict stroke severity, image features such as white matter hyperintensity (WMH) [17] and stroke lesions were labeled manually in T2-FLAIR and DWI scans respectively. WMH burden is found to be higher in patients who develop a cerebral infarct compared to those with less damaging transient ischemic attacks, and is also associated with small vessel stroke subtypes [18]. The segmentation and analysis of WMH is therefore important for understanding mechanisms underlying stroke. Manual segmentation by an expert takes 10 to 30 minutes per patient. Segmentation of 1089 patients in the study took over three years. With the project poised to receive thousands more scans from other participating sites in the near future, the need for automatic segmentation and analysis tools is clear.
Fig. 1.
T1 (top), T2-FLAIR (middle), and DWI (bottom) images from a patient in the stroke study. Three orthogonal slices are shown for each modality; in plane slices are highlighted in blue. Note the cropped field of view and large slice thickness.
Enabled by increasingly more affordable imaging technology and collaborative acquisition efforts [7,16], the trend of large scale multimodal multi-site clinical studies with lower quality images is bound to continue. Population genetics studies that typically require large patient cohorts are starting to include imaging data, creating large scale imaging datasets. In contrast to high quality research scans in studies that commonly motivate method development, such as ADNI [29] and Predict-HD [14], we focus on lower quality clinical images. As our results demonstrate, existing algorithms can be adapted to handle clinical quality scans by carefully investigating the properties of the input images and using the insights to optimize the application of the methods.
Our framework consists of three main components: registration, segmentation, and analysis. Our ultimate goal is in-depth analysis of disease progression in large clinical datasets, which will deliver insights into the structural and functional changes associated with a disorder from noisy, low quality images. Accurate registration is a critical prerequisite for such analysis, as it brings all imaging modalities into a common coordinate frame and enables data fusion across subjects and modalities [19]. Quantifying regions of interest requires accurate segmentation. Manual segmentation is infeasible for larger datasets with thousands of images, motivating the development of automatic methods. Population analysis of heterogeneous data requires improved models to capture trends, variability, and statistics. In this paper, we present steps and insights toward the goal of large scale analysis for clinical studies.
Prior work in registration, segmentation, and population analysis has often focused on high quality images. Registration of clinical images is often constrained to rigid or affine alignment to atlas reference frames such as Talairach coordinates [23]. However, accurate alignment of relevant brain structures requires nonlinear deformations [2,26]. For example, atrophy of the cortex and growth of the ventricles are of interest in many neuroimaging studies. In stroke imaging, white matter hyperintensity is typically found close to the ventricles. Therefore, an accurate deformable registration of the white matter near the ventricles is important for spatial analysis of white matter hyperintensity distribution in the population. Although recent registration algorithms have enjoyed success in many medical imaging applications, a better understanding of the interactions between the algorithms and relevant properties of images is essential for such algorithms to function properly on large, challenging clinical datasets. We build on the work of Klein et al. [12], which evaluates a variety of different registration algorithms on high resolution scans of slice thicknesses below 1.5mm with no visible pathologies. Methods for segmentation and analysis of medical images have been researched in depth [1,20], but their utility for large scale clinical studies of pathology is yet to be fully characterized. Previous work in population analysis has often focused on higher quality datasets [6,20], while analysis of larger datasets has been naïve [21]. In this paper, we address the key challenges of building a robust computational pipeline for registration and segmentation in a common reference frame, enabling analysis and summary of a pilot study of over 800 patients. We employ regression mixture modeling [8,15] and kernel regression for imaging [4,13,28] to identify and characterize different modes of white matter hyperintensity evolution as a function of age. Fig. 2 presents a flowchart of the proposed computational framework.
Fig. 2.
A flowchart of our computational pipeline. Registration of all modalities for all patients into a common space and segmentation of clinical features enable large scale population analysis.
The remainder of this paper is organized as follows. In Section 2, we introduce our approach to registration of images within each patient in a study and to spatial alignment of all patients into a common coordinate frame. In Section 3, we discuss the challenges of automatic segmentation and outline our solutions. In Section 4, we describe the population analysis methods in further detail. Section 5 illustrates our approach on a cohort of stroke patients. We conclude with a discussion of directions for future research suggested by our experience and results.
2 Registration
Given a multimodal set of scans for a patient, we aim to align all patient images into the common anatomical space of an atlas. In this section, we briefly review image registration, and motivate the necessity of proper initialization, brain masking, and intensity correction for successful registration of clinical images. We perform spatial normalization into the atlas space using T1 images, followed by alignment of all other modalities (T2-FLAIR, DWI, etc.) via intra-patient multimodal registration. However, the methods we describe can be used with any atlas modality that enables accurate anatomical alignment.
Image registration techniques have been widely studied, and generally include a distance or similarity metric, a transformation model, and an optimization procedure [5,19,27]. Three of the most popular metrics used in registration are sum of squared differences (SSD), cross correlation (CC), and mutual information (MI). SSD and CC are used when the intensity distributions are directly comparable between the two images. MI is typically used for multimodal registration when the intensity profiles differ between scans (e.g., when registering a T1-weighted image to a T2-weighted image) [27]. Optimizing over nonrigid transformations is usually only effective after an accurate initialization based on simpler rigid or affine alignment. Registration between clinical images of patients and an atlas image is difficult in large, potentially multi-site studies for two main reasons. First, the patient images contain many irrelevant structures: our goal is brain analysis, but the images include the skull and large portions of the neck, and may even crop structures of interest, as illustrated in Fig. 1. The optimization procedure treats all regions uniformly, and aligning these bright, highly variable structures may drive the registration and result in an inaccurate transformation of the brain. Second, since images in large clinical studies are often acquired at multiple sites with different scanners and different acquisition parameters, the range of values and the intensity distributions across tissue classes varies greatly across images of the same modality. We address these challenges by proposing general strategies for each registration step. Algorithm 1 summarizes the steps of our registration pipeline. All registration steps are performed using the ANTS [2] software package.
Algorithm 1.
Registration pipeline of Section 2
| 1: Initial rigid registration: Rigidly register the atlas T1 image to the patient T1 image, using MI as a metric to handle intensity profile differences. |
| 2: Approximate brain mask propagation: Use the estimated rigid transformation from Step 1 to transfer the brain mask from the atlas space to the patient T1 space to use for intensity correction and to guide nonrigid registration. |
| 3: Patient T1 intensity correction: Use the approximate brain mask from Step 2 to estimate the white matter intensity mode in the patient T1 image. Scale patient T1 intensities so that the mode of white matter intensity matches that of the atlas, enabling the use of intensity-based metrics in registration. |
| 4: Nonrigid T1 registration: Nonrigidly register the atlas T1 image to the intensity-corrected patient T1 image from Step 3 using CC as a metric, with the transformation from Step 1 for initialization and the approximate brain mask from Step 2 to restrict the region where the metric is computed. |
| 5: Brain mask propagation: Use the estimated nonrigid transformation from Step 4 to obtain a more accurate brain mask in the patient T1 space. |
| 6: Multimodal registration: Rigidly register the patient T2-FLAIR/DWI images to the T1 image of the same patient using MI as a metric, with the final brain mask from Step 5 to restrict the region where the metric is computed. |
Intra-modal initialization with MI
When registering images of the same modality, the standard practice of first computing an initial rigid registration (i.e., rotation and translation only) is relatively insensitive to the problem of extraneous structures. Inconsistent intensity distributions in images of the same modality in clinical datasets render the usual intra-modality metrics such as CC and SSD ineffective for alignment since the assumption of direct intensity matching for the same tissue type across different images is violated. Standard methods for matching intensity profiles, such as histogram equalization, cannot be used either, since they would be dominated by non-brain regions such as the neck. We employ MI in performing this rigid registration since the difference of tissue intensities between these images is more similar to the difference of tissue intensities between images of different modalities. We build on this initial registration to solve the problems of inconsistent field of view and intensity profiles described above.
Skull stripping and brain masking
Since we are typically only interested in the brain in neuroimaging studies, we seek an accurate transformation in the brain, and restrict the region where the registration metric is evaluated accordingly. In research-quality images, skull stripping or brain mask extraction is achieved via watershed methods that assume that the brain consists of a single connected component separated from the skull and dura by CSF [22]. Unfortunately, such techniques are highly dependent on image quality, and require high resolution and reliable contrast. As a result, they often fail when applied to clinical images. Instead, we propagate a brain mask from the atlas via the estimated rigid transformation. While not a perfect brain mask, it enables intensity correction and constrains the final nonrigid registration to a region that reasonably approximates the brain.
Intensity correction
In our experiments with clinical images of stroke patients, MI failed when used in nonrigid registration, resulting in inconsistent deformations that did not match the images. Differences in intensity profiles of patient images prevent us from using intensity-based measures such as CC and SSD directly. Using the approximate brain mask, we adjust the intensity separately for each image to solve this problem. Histogram equalization still cannot be used due to the approximate nature of the brain mask and variable intensity profiles (see Fig. 3). We choose to restrict our intensity correction to global scaling. Specifically, we match the intensity of the white matter while not altering the shape of the intensity profiles. As one of the largest structures in the brain, the white matter is important to match well between the two images in registration. We estimate the mode of white matter intensity for each patient as the mode of the component with higher intensity in a two-component mixture model for intensity values within the brain mask.
Fig. 3.
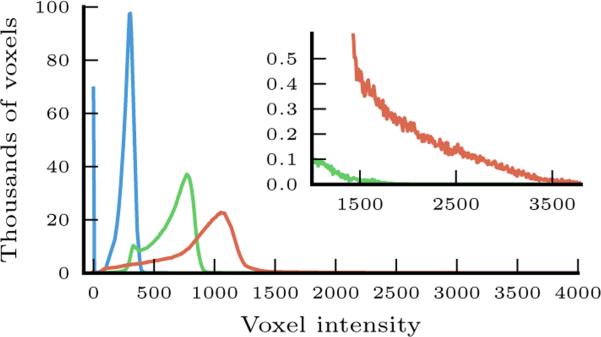
Voxel intensity histograms from three different patients (shown in three different colors), illustrating typical differences in intensity distributions within the approximate brain mask obtained via rigid registration from the atlas. The inset highlights the difference at the high end of intensity values.
Final non-rigid registration
Once the image intensity distribution of the patient image has been matched to that of the atlas image, non-rigid registration can then be performed with CC as a metric. In order to prevent non-brain structures from dominating the optimization, we continue to use the approximate brain mask in computing this registration. Once the registration is concluded, we propagate a more accurate mask of the brain to be used for multimodal registration within each patient.
Intra-patient multimodal registration
In order to align other modalities (such as T2-FLAIR and DWI in the stroke study) into the atlas coordinate system, we first estimate the rigid transformation to the atlas-modality image (in our case, this is T1) using MI, and compose it with the final nonrigid transformation between the patient and the atlas.
Evaluating registration quality
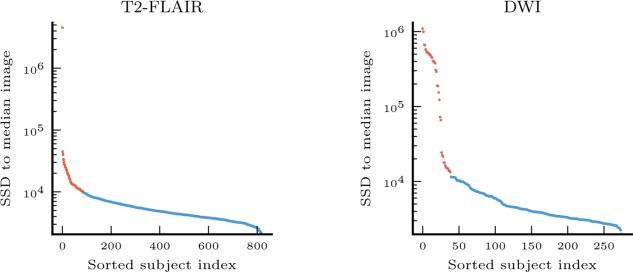
Since visual inspection is not feasible for thousands of patients, we employ automatically computed measures of registration quality to detect when registration failed. We construct a (voxelwise) median image of registered patients for each modality in the atlas space, compute SSD of each intensity-corrected patient image from this median image within the brain mask, and isolate patients whose measures are substantially higher than the rest using the Tukey fence (more than 1.5 times the interquartile range above the third quartile) [24].
3 White Matter Hyperintensity (WMH) Segmentation
WMH is characterized by high intensity in T2-FLAIR MRI, but so are other brain structures such as the ventricle lining (ependyma) and the skull. Stroke lesions, both acute and chronic, can sometimes appear bright in T2-FLAIR as well. As a result, manual segmentation of WMH is typically performed via thresholding followed by expert editing to restrict the segmentation to the relevant regions of white matter and exclude areas with stroke lesions.
We create an expert-defined region of interest for WMH in the atlas space and take advantage of the registration pipeline to propagate this region to the patient's T2-FLAIR image. We employ MAP classification to label WMH voxels within the region of interest. Given intensity I(x) at voxel x, we choose label L(x) ∈ {H, H̄} (where H represents WMH and H̄ represents healthy tissue) to maximize the posterior probability of the label p(L(x|I(x)):
| (1) |
We use 10 patient images to construct the likelihood models p(I|L = H) and p(I|L = H̄) as histograms of intensity. These training images were visually inspected to have accurate manual segmentations. As T2-FLAIR scans also suffer from inconsistent intensity profiles, we match the T2-FLAIR white matter intensities for all patients via linear global scaling before segmentation, similar to the intensity correction step described in the previous section. We exclude acute stroke lesion voxels by using manual stroke segmentations derived from DWI scans, which are aligned to T2-FLAIR scans as part of the registration pipeline. To estimate the prior p(L), we use the proportion of voxels in the 10 training images with the corresponding label within the region of interest specified in the atlas space.
As with training data, we use DWI stroke lesion segmentations to exclude acute stroke voxels when performing WMH labeling in new patients. Future directions of research include developing automatic methods for stroke lesion segmentation.
4 Progression of WMH Spatial Distribution
WMH burden and its evolution with respect to clinical variables, such as age, is important for understanding cerebrovascular mechanisms related to stroke [17,18]. While the overall WMH volume of each patient can be compared and analyzed from just the manual segmentations for each patient, we use the registration framework to evaluate and visually inspect the spatial distribution of WMH and to understand its evolution across the brain as a function of age. Since WMH volume varies dramatically across different patients, we choose to first cluster the patients into more homogeneous sub-populations and then investigate the change of WMH distribution with age separately in each sub-population.
We use a two-component regression mixture model to capture variability in WMH volume growth [8,15]. Each component is characterized by a different dependency of WMH burden on age. To determine the assignment of patients to sub-populations associated with components, we alternate between assigning the cluster membership of each patient and estimating the regression coefficients for WMH volume as a function of age in each cluster, until convergence.
Formally, let vi and zi be the scalar total WMH volume and cluster assignment of patient i (i ∈ {1, . . . , N ) respectively. We let Xi be a p-dimensional feature vector associated with patient i. Specifically, we use age and a constant to account for the intercept (i.e., p = 2). Let v be the vector of all volume values and X be the N × p matrix of features. We assume i.i.d. multinomial priors for cluster membership. Given p-dimensional regression coefficient vectors βc for each cluster c and fixed variance σ2, we assume that WMH volume vi in patient i is normally distributed with mean Xiβc and fixed variance σ2:
In order to estimate the parameters β, we use a hard-assignment EM variant, alternating until convergence between the E-step that computes the cluster assignments:
| (2) |
and the M-step that solves for each βc using standard least-squares linear regression:
| (3) |
where Zc is a diagonal binary matrix; Zc(i, i) = 1 if zi = c. The resulting algorithm is similar to k-means clustering.
Within each cluster, we use Nadaraya-Watson kernel regression [4,13,28] on the WMH label maps to visualize representative images Ic(t) for each cluster c:
| (4) |
where t is the age of interest, N is the number of patients, Ii is the WMH label map of patient i warped into atlas space, and Kh(·) is a Gaussian kernel function with standard deviation h and mean 0. Intuitively, a representative WMH image is a weighted average of all WMH label maps, with patients close to age t contributing more to the average. Visualizing representative images helps understand the progression of the disease with age.
5 Results
We illustrate our framework in the context of a stroke dataset which currently includes 1089 patients, with T1 (1 × 1mm in-plane, slice thickness 5-7mm), T2-FLAIR (1 × 1mm in-plane, slice thickness 5-7mm, PROPELLER sequence some times used if the patient moved), and DWI (at least 6 directions, b-value 1000 s/mm2, 1mm × 1mm in-plane, slice thickness 5-7mm). Acquisition TR and TE varied depending on image protocol. T1 images were bias-field corrected [25] prior to analysis. In 819 patients, both T1 and manually segmented T2-FLAIR images were available. In 515 of these, DWI was also available, and in 276 of these, manual stroke lesion segmentations were available.
Registration
For atlas-to-patient registration, we use the atlas constructed from 39 T1-weighted brain MRI scans and corresponding manual delineations that are part of the Freesurfer brain atlas [3,9,11]. The 39 subjects span a wide age range, reflect significant anatomical variation, and include some Alzheimer's patients.
After using our registration pipeline, the quality evaluation procedure identified 86 of 819 T2-FLAIR scans and 39 of 275 segmented DWI scans as outliers, leading us to exclude them from subsequent analysis (Fig. 4). Most outliers contain severe artifacts. We also verified that images that were close to the threshold but were included in the analysis were accurately registered by the method.
Fig. 4.
Distances from patient images to median image for T2-FLAIR and DWI modalities, ranked in descending order. Outliers are shown in red, and are removed from subsequent analysis.
WMH Segmentation
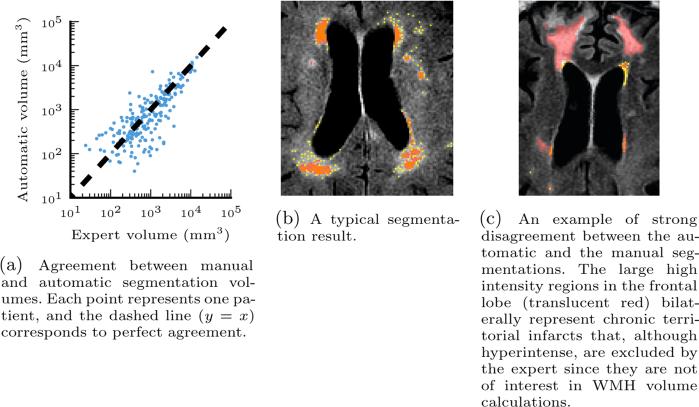
Fig. 5 illustrates the volume agreement between the automatic and manual WMH segmentation. We observe that in most patients the automatic segmentation is close to the manual one (Pearson correlation coefficient r = 0.895). In some cases, our algorithm oversegments relative to the manual segmentation. Investigating these patients reveals cases like the one shown in Fig. 5c, where during manual segmentation experts excluded large regions determined to be attributable to chronic ischemic lesions. Similar to acute stroke lesions, chronic lesions are hyperintense in FLAIR but should not be included in WMH volume calculations. Unfortunately, they do not have a signature in DWI. The insights from this experiment will guide our future work to improve segmentation by detecting such lesions simultaneously with WMH voxels.
Fig. 5.
Left: comparison of automatic and manual WMH segmentation volumes. Right: example segmentations. Manual segmentation (translucent red), automatic segmentation (yellow), and overlap (orange) are overlaid on axial slices.
WMH Progression with Age
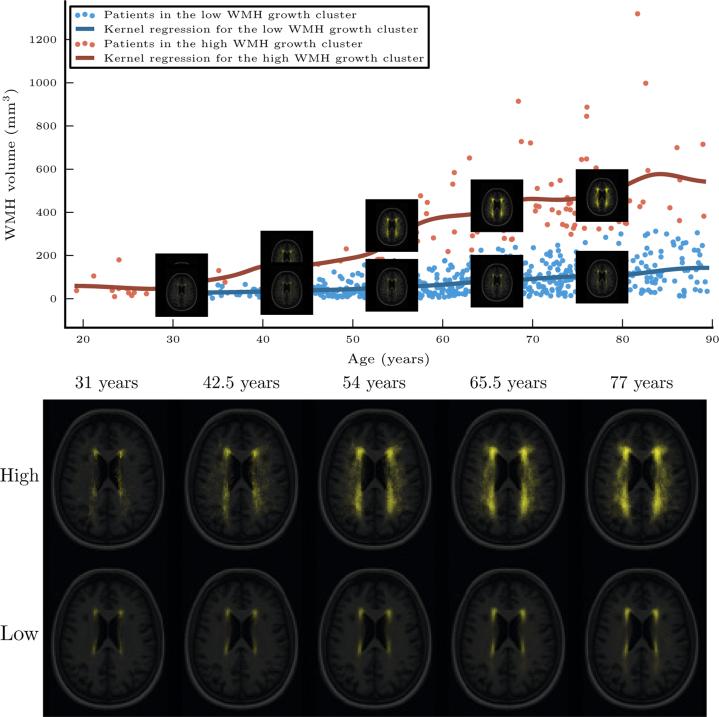
Fig. 6 visualizes the progression of the WMH distributions with age based on the two-component regression mixture model. The method identified a cluster of patients for whom age has little to no effect on WMH volume (β1 = 2.27mm3/year), as well as another set of patients for whom it grows substantially with age (β2 = 8.84mm3/year). For each cluster, we use the data-driven kernel regression on both the scalar WMH volume values and the WMH label map separately as a function of age. For the fast-growing WMH burden cluster, WMH tends to spread throughout the white matter, and most strongly in the posterior regions of the white matter. In the other, slow-growing WMH burden cluster, the white matter remains confined near the ventricles, as expected.
Fig. 6.
Top: the two-component regression mixture model clusters the patients into those with high WMH growth as a function of age (red) and those with low WMH growth as a function of age (blue). The lines show a kernel regression of WMH volume as a function of age in each cluster. The representative images shown are obtained via kernel regression of the WMH label maps as a function of age. Bottom: the two sets of representative images in more detail.
We provide code that implements all steps of our framework at http://groups.csail.mit.edu/vision/medical-vision/stroke/.
6 Conclusion
We presented a framework for analysis of large-scale studies with highly variable clinical images. We discussed necessary decisions in adapting registration and building segmentation algorithms for such difficult data, and demonstrated their application to a population of 819 stroke patients. We further introduced analysis to characterize WMH progression as a function of age, enabled by the multimodal registration and segmentation framework. In registration of clinical images, initialization, choice of cost function, automatic data-driven brain masking, intensity correction, and automatic evaluation are critical steps which we discussed in detail.
In the future, we will extend our segmentation methodology to include automatic segmentation of acute stroke lesions from DWI [10], and chronic stroke lesions from T2-FLAIR. This will enable completely automatic segmentation of white matter hyperintensity and provide more features for the clinical analysis. Additionally, richer analyses using more sophisticated models and additional clinical features such as stroke severity promise to lead to interesting clinical findings.
As large, multimodal, multicenter datasets of highly variable quality come online, fully automatic data-driven methods become a crucial part of the analysis. We have demonstrated a robust, scalable framework that enables such analysis for stroke studies.
Acknowledgments
We acknowledge the following funding sources: NSF GRFP, NSERC CGS-D, Barbara J. Weedon Fellowship, NIH NCRR NAC P41-RR13218 and NIH NIBIB NAC P41-EB-015902, NIH NIBIB NAMIC U54-EB005149, NIH-NINDS K23 NS064052, NINDS U01NS069208, and the American Stroke Association-Bugher Foundation Centers for Stroke Prevention Research.
References
- 1.Admiraal-Behloul F, et al. Fully automatic segmentation of white matter hyper-intensities in MR images of the elderly. Neuroimage. 2005;28(3):607–617. doi: 10.1016/j.neuroimage.2005.06.061. [DOI] [PubMed] [Google Scholar]
- 2.Avants BB, Tustison NJ, Song G, Cook PA, Klein A, Gee JC. A reproducible evaluation of ANTs similarity metric performance in brain image registration. Neuroimage. 2011;54(3):2033–2044. doi: 10.1016/j.neuroimage.2010.09.025. [DOI] [PMC free article] [PubMed] [Google Scholar]
- 3.Daly E, et al. Predicting conversion to Alzheimer disease using standardized clinical information. Archives of Neurology. 2000;57(5):675. doi: 10.1001/archneur.57.5.675. [DOI] [PubMed] [Google Scholar]
- 4.Davis BC, Fletcher PT, Bullitt E, Joshi S. IEEE International Conference on Computer Vision. IEEE; 2007. Population shape regression from random design data. 7 pp. [Google Scholar]
- 5.Hartkens T, Rohr K, Stiehl HS. Evaluation of 3D operators for the detection of anatomical point landmarks in MR and CT images. Computer Vision and Image Understanding. 2002;86(2):118–136. [Google Scholar]
- 6.Hinrichs C, Singh V, Xu G, Johnson SC. Predictive markers for AD in a multi-modality framework: an analysis of MCI progression in the ADNI population. Neuroimage. 2011;55(2):574–589. doi: 10.1016/j.neuroimage.2010.10.081. [DOI] [PMC free article] [PubMed] [Google Scholar]
- 7.Hubert HB, Feinleib M, McNamara PM, Castelli WP. Obesity as an independent risk factor for cardiovascular disease: a 26-year follow-up of participants in the Framingham Heart Study. Circulation. 1983;67(5):968–977. doi: 10.1161/01.cir.67.5.968. [DOI] [PubMed] [Google Scholar]
- 8.Jacobs RA, Jordan MI, Nowlan SJ, Hinton GE. Adaptive mixtures of local experts. Neural Computation. 1991;3(1):79–87. doi: 10.1162/neco.1991.3.1.79. [DOI] [PubMed] [Google Scholar]
- 9.Johnson KA, et al. Preclinical prediction of Alzheimer's disease using SPECT. Neurology. 1998;50(6):1563–1571. doi: 10.1212/wnl.50.6.1563. [DOI] [PubMed] [Google Scholar]
- 10.Kabir Y, Dojat M, Scherrer B, Garbay C, Forbes F. International Conference of the IEEE Engineering in Medicine and Biology Society (EMBC) IEEE; 2007. Multimodal MRI segmentation of ischemic stroke lesions. pp. 1595–1598. [DOI] [PMC free article] [PubMed] [Google Scholar]
- 11.Killiany RJ, et al. Use of structural magnetic resonance imaging to predict who will get Alzheimer's disease. Annals of Neurology. 2000;47(4):430–439. [PubMed] [Google Scholar]
- 12.Klein A, et al. Evaluation of 14 nonlinear deformation algorithms applied to human brain MRI registration. Neuroimage. 2009;46(3):786. doi: 10.1016/j.neuroimage.2008.12.037. [DOI] [PMC free article] [PubMed] [Google Scholar]
- 13.Nadaraya EA. On estimating regression. Theory of Probability & Its Applications. 1964;9(1):141–142. [Google Scholar]
- 14.Paulsen JS, et al. Detection of Huntingtons disease decades before diagnosis: the Predict-HD study. Journal of Neurology, Neurosurgery & Psychiatry. 2008;79(8):874–880. doi: 10.1136/jnnp.2007.128728. [DOI] [PMC free article] [PubMed] [Google Scholar]
- 15.Quandt RE, Ramsey JB. Estimating mixtures of normal distributions and switching regressions. Journal of the American Statistical Association. 1978;73(364):730–738. [Google Scholar]
- 16.Regan EA, et al. Genetic epidemiology of COPD (COPDGene) study design. COPD: Journal of Chronic Obstructive Pulmonary Disease. 2011;7(1):32–43. doi: 10.3109/15412550903499522. [DOI] [PMC free article] [PubMed] [Google Scholar]
- 17.Rost NS, et al. White matter hyperintensity burden and susceptibility to cerebral ischemia. Stroke. 2010;41(12):2807–2811. doi: 10.1161/STROKEAHA.110.595355. [DOI] [PMC free article] [PubMed] [Google Scholar]
- 18.Rost NS, et al. White matter hyperintensity volume is increased in small vessel stroke subtypes. Neurology. 2010;75(19):1670–1677. doi: 10.1212/WNL.0b013e3181fc279a. [DOI] [PMC free article] [PubMed] [Google Scholar]
- 19.Rueckert D, Schnabel JA. Medical image registration. Biomedical Image Processing. 2011:131–154. [Google Scholar]
- 20.Sabuncu MR, Balci SK, Shenton ME, Golland P. Image-driven population analysis through mixture modeling. IEEE Transactions on Medical Imaging (TMI) 2009;28(9):1473–1487. doi: 10.1109/TMI.2009.2017942. [DOI] [PMC free article] [PubMed] [Google Scholar]
- 21.Salton CJ, et al. Gender differences and normal left ventricular anatomy in an adult population free of hypertension. A cardiovascular magnetic resonance study of the Framingham Heart Study Offspring cohort. Journal of the American College of Cardiology. 2002;39(6):1055–1060. doi: 10.1016/s0735-1097(02)01712-6. [DOI] [PubMed] [Google Scholar]
- 22.Segonne F, et al. A hybrid approach to the skull stripping problem in MRI. Neuroimage. 2004;22(3):1060–1075. doi: 10.1016/j.neuroimage.2004.03.032. [DOI] [PubMed] [Google Scholar]
- 23.Talairach J, Tournoux P. Co-planar stereotaxic atlas of the human brain. 3-Dimensional proportional system: an approach to cerebral imaging. 1988 [Google Scholar]
- 24.Tukey JW. Exploratory data analysis. Pearson; 1977. [Google Scholar]
- 25.Tustison NJ, Gee JC. N4ITK: Nicks N3 ITK implementation for MRI bias field correction. Insight Journal. 2009 [Google Scholar]
- 26.Vercauteren T, Pennec X, Perchant A, Ayache N, et al. Diffeomorphic demons: Efficient non-parametric image registration. NeuroImage. 2008;45(1) doi: 10.1016/j.neuroimage.2008.10.040. [DOI] [PubMed] [Google Scholar]
- 27.Viola P, Wells WM., III Alignment by maximization of mutual information. International Journal of Computer Vision. 1997;24(2):137–154. [Google Scholar]
- 28.Watson GS. Smooth regression analysis. Sankhyā: The Indian Journal of Statistics, Series A. 1964:359–372. [Google Scholar]
- 29.Weiner MW, et al. The Alzheimers Disease Neuroimaging Initiative: a review of papers published since its inception. 1. Vol. 8. Alzheimer's & Dementia; 2012. pp. S1–S68. [DOI] [PMC free article] [PubMed] [Google Scholar]


