Abstract
Purpose
Quantitative fundus autofluorescence (qAF) and spectral domain optical coherence tomography (SD-OCT) were performed in patients with Bull's-Eye maculopathy (BEM) to identify phenotypic markers that can aid in the differentiation of ABCA4-associated and non-ABCA4-associated disease.
Design
Prospective cross-sectional study at an academic referral center.
Subjects
Thirty-seven BEM patients (age range: 8-60 years) were studied. All patients exhibited a localized macular lesion exhibiting a smooth contour and qualitatively normal appearing surrounding retina without flecks. Control values consisted of previously published data from 277 healthy subjects (374 eyes; age range: 5-60 years) without a family history of retinal dystrophy.
Methods
AF images (30°, 488 nm excitation) were acquired wi th a confocal scanning laser ophthalmoscope equipped with an internal fluorescent reference to account for variable laser power and detector sensitivity. The grey levels (GLs) from 8 circularly arranged segments positioned at an eccentricity of ~7°- 9° in each image were calibrated to the reference, zero GL, magnification, and normative optical media density, to yield qAF. In addition, horizontal SD-OCT images through the fovea were obtained. All patients were screened for ABCA4 mutations with the ABCR600 microarray and/or by next generation sequencing.
Main Outcome Measures
Quantitative AF, correlations between AF and SD-OCT and genotyping for ABCA4 variants.
Results
ABCA4 mutations were identified in 22 patients, who tended to be younger (mean age: 21.9 ±8.3 years) than patients without ABCA4 mutations (mean age: 42.1 ±14.9 years). Whereas phenotypic differences were not obvious on the basis of qualitative fundus AF and SD-OCT imaging, with qAF the 2 groups of patients were clearly distinguishable. In the ABCA4-positive group, 37/41 eyes (19/22 patients) had qAF8 above the 95% CI for age. Conversely, in the ABCA4-negative group, 22/26 eyes (13/15 patients) had qAF8 within the normal range.
Conclusion
The qAF method can differentiate between ABCA4-associated and non-ABCA4-associated BEM and may guide clinical diagnosis and genetic testing.
Keywords: ABCA4, bull's-eye maculopathy, lipofuscin, optical coherence tomography, quantitative fundus autofluorescence, recessive Stargardt disease, retinal pigment epithelium, scanning laser ophthalmoscope
INTRODUCTION
Varying definitions of Bull's-Eye maculopathy (BEM) have been reported1-4 since the term was first introduced in 1966 to describe the fundus appearance of chloroquine retinopathy.5 The classical BEM phenotype presents as concentric parafoveal rings of increased and decreased fundus autofluorescence (AF).6-8 However the rings in BEM can be less obvious due to mottling, bright or reduced foveal AF and/or hyperautofluorescence that is diffuse and the lesion can be round or elliptical.6,8,9 The BEM phenotype can also progress to extensive macular atrophy.6 Some patients who are homozygous for disease-causing mutations in the ABCA4 gene can present with the BEM phenotype.2,4 However, BEM is not specific to ABCA4 and can also be caused by mutations in phototransduction-related genes (e.g. GUCA1A, RPGR);10,11 mutations in a gene (PROM1)6 that encodes a protein involved in outer segment morphogenesis; and mutations in a gene (RIM1)7 that encodes a photoreceptor synaptic protein. Thus pinpointing the underlying cause of BEM in an individual patient can be challenging.
Advances in non-invasive imaging have facilitated the diagnosis and differentiation of retinal dystrophies. Two imaging modalities that have proven especially valuable in this regard are spectral domain optical coherence tomography (SD-OCT) and fundus autofluorescence (AF). By SD-OCT, structural changes of the retina can be studied almost at a cellular level. Fundus autofluorescence (AF) emerges from RPE lipofuscin,12 a mixture of fluorophores with spectral emission features that reflect the bisretinoid constituents that have been characterized.13 RPE lipofuscin accumulates with age in healthy eyes14,15 and its formation is accentuated in recessive Stargardt disease (STGD1).16-19 Disease-related processes can also alter the distribution of the AF signal. Through image registration, SD-OCT and AF can be correlated.
Using quantitative fundus AF (qAF), an approach we have developed to measure fundus AF intensities, we recently reported increased qAF levels in STGD1 patients with confirmed ABCA4 mutations.20 In these patients, qAF was elevated even at young ages and in qualitatively unaffected appearing fundus areas. Whether qAF levels are also increased in retinal dystrophies related to mutations other than ABCA4 and to what extent lipofuscin is involved in the pathogenesis of these conditions, remains to be determined.
The objective of this study was to investigate whether qAF, a non-invasive approach to measuring RPE lipofuscin in vivo, could aid in distinguishing ABCA4-associated from non-ABCA4-associated disease in BEM, a phenotype that is common to some retinal dystrophies. In addition, we were interested as to whether based on qualitative assessment of AF and SD-OCT images a distinction of ABCA4-positive and ABCA4-negative patients is feasible.
METHODS
Patients and Genetic Testing
Thirty-seven BEM patients (age range: 8-60 years) from 35 families were prospectively recruited at the Department of Ophthalmology, Columbia University. All subjects were examined by a retinal specialist (SHT) and had clear media except for some floaters. Patients exhibiting BEM phenotype were selected on the basis of fundus AF images. All patients exhibited a localized macular lesion exhibiting a smooth contour; outside the macula, retina was qualitatively normal and without flecks. Of the ABCA4-positive patients that have undergone qAF imaging at our institute, approximately 35% exhibited a BEM phenotype without flecks. The criteria of BEM without flecks included patients that may have developed flecks at a later stage. Demographic, clinical and genetic information on the study cohort are presented in the Table.
Table.
Summary of Demographic, Clinical and Genetic Data
| Patient | Gender | Age | Race/Ethnicity | BCVA (logMAR) | Genetic data | qAF8 | |||
|---|---|---|---|---|---|---|---|---|---|
| OD | OS | OD | OS | ||||||
| ABCA4 mutations | |||||||||
| Allele 1 | Allele 2 | ||||||||
| 1 | M | 36 | White | 0.70 | 0.70 | p.G1961E | p.G1961E | 282 | 279 |
| 2 | F | 46 | White | 0.40 | 0.40† | p.G1961E | p.R1129C | 391 | |
| 3 | M | 17 | Asian Indian | 0.70 | 0.88 | p.G1961E | c.6729+4_+18del | 340 | 363 |
| 4 | M | 17 | White | 0.88 | 0.88 | p.G1961E | p.A1773V | 340 | 366 |
| 5 | M | 21 | White | 0.88 | 0.88 | p.G1961E | p.W15* | 341 | 325 |
| 6 | F | 22 | White | 0.70 | 0.48 | p.G1961E | p.G863A | 361 | 351 |
| 7 | F | 20 | White | 0.70‡ | 0.88‡ | p.G1961E | p.L541P | 317 | |
| 8 | M | 12 | White | 0.80 | 0.70 | p.G1961E | p.P1380L | 251 | 242 |
| 9 | F | 21 | White | 0.88 | 0.88 | p.G1961E | p.R212C | 407 | 439 |
| 10 | F | 26 | White | 0.40‡ | 0.70‡ | p.G1961E | c.5196+1056A>G | 379 | 344 |
| 11 | F | 24 | White | 0.88‡ | 0.88‡ | p.G1961E | p.C2150R | 405 | 396 |
| 12 | F | 24 | White | 0.30‡ | 0.18‡ | p.G1961E | p.N96D | 513 | 549 |
| 13 | F | 20 | White | 0.30 | 0.40 | p.G1961E | p.N96D | 397 | 355 |
| 14 | M | 25 | White | 0.00† | 0.30 | p.G1961E | p.Q1003* | 322 | 328 |
| 15 | M | 8.2 | White | 0.88 | 0.88 | p.[L541P;A1038V] | 438 | 432 | |
| 16 | M | 25 | White | 0.60 | 0.60 | p.S84fs | p.R2107H | 294 | |
| 17 | F | 24 | Black | 0.70 | 0.88 | p.G991R | p.L1138P | 321 | 326 |
| 18 | M | 26 | White | 0.00† | 0.00† | p.R1300* | p.R2106C | 419 | 412 |
| 19 | M | 11 | White | 0.40‡ | 0.40‡ | p.W821R | p.C2150Y | 304 | 296 |
| 20 | F | 16 | White | 0.70 | 0.40 | p.K1547* | p.R2030Q | 481 | 513 |
| 21 | F | 13 | White | 1.30 | 1.00 | pR1108C | p.Q1412* | 511 | 528 |
| 22 | F | 18 | White | 0.00 | 0.00 | p.G863A | c.5898+1G>A | 465 | 431 |
| Mutations in other genes | |||||||||
| 23 | F | 16 | White | 0.40 | 0.48 | GUCY2D - p.R838H | 152 | 165 | |
| 24 | M | 53 | Black | 0.88 | 0.88 | CNGA3 - p.[R223W; R223Q] | 259 | ||
| 25 | M | 28 | Hispanic | 0.30† | 0.30† | CRX - p.S150* | 346 | 349 | |
| 26 | F | 51 | Hispanic | 0.88 | 1.30 | CRX - p.S150* | 277 | 284 | |
| 27 | F | 35 | White | 0.88 | 0.88 | ND | 443 | ||
| 28 | M | 48 | Black | 0.40† | 0.18 | RPGR - p.N1132fs | 293 | 283 | |
| 29 | M | 51 | Hispanic | 1.00 | 1.00 | ND | 359 | ||
| 30 | M | 57 | White | 0.48 | 0.48† | WES, ND | 320 | 364 | |
| 31 | M | 38 | White | 0.48 | 0.48 | WES, ND | 226 | 237 | |
| 32 | M | 33 | Black | 0.70 | 0.70 | ND | 285 | 303 | |
| 33 | F | 22 | White | 0.60 | 0.48 | WES, ND | 239 | 279 | |
| 34 | F | 60 | White | 0.30 | 1.70 | ND | 486 | 536 | |
| 35 | M | 54 | White | 0.70 | 0.88 | ND | 349 | 436 | |
| 36 | M | 21 | White | 0.60 | 0.88 | WES, ND | 239 | ||
| 37 | M | 57 | White | 0.10† | 1.18 | ND | 447 | 414 | |
BCVA, best corrected visual acuity; logMAR, logarithm of the minimum angle of resolution; OD, right eye; OS, left eye qAF8, average quantitative autofluorescence of the 8 measurement sites from all available images per eye
= foveal sparing
= optical empty lesion; WES = whole exome sequencing; ND = not determined
The ABCA4 microarray was used for initial screening of most study subjects followed by direct Sanger sequencing to confirm identified changes, as previously described.21 Since the array screening had been performed over many years, different versions of the ABCA4 chip had been used, from the least representative (~300 mutations) to the recent version of the array (>600 variants). More recently recruited patients and cases where the array screening identified only one mutated ABCA4 allele or no ABCA4 mutations at all were subjected to next-generation sequencing.
All 50 exons and exon-intron boundaries of the ABCA4 gene were amplified using Illumina TruSeq Custom Amplicon protocol (Illumina, San Diego, CA), followed by sequencing on Illumina MiSeq platform. The next-generation sequencing reads were analyzed and compared to the reference genome GRCh37/hg19, using the variant discovery software NextGENe (SoftGenetics LLC, State College, PA). All detected possibly disease-associated variants were confirmed by Sanger sequencing and analyzed with Alamut software (http://www.interactive-biosoftware.com). Segregation of the new variants with the disease was analyzed in families if family members were available.
All procedures adhered to the tenets of the Declaration of Helsinki and written informed consent was obtained from all subjects after a full explanation of the study procedures was provided. The study was approved by the Institutional Review Board of Columbia University and complied with the Health Insurance Portability and Accountability Act of 1996.
Image acquisition
Protocols for the acquisition of AF images that meet the quality standards necessary for quantification have been described previously.14,20,22,23. AF images (30°; 488 nm excitation) were acquired using a confocal scanning laser ophthalmoscope (cSLO; Spectralis HRA+OCT; Heidelberg Engineering, Heidelberg, Germany) modified by the insertion of an internal fluorescent reference to account for variations in laser power and detector gain.22 The barrier filter in the device transmitted light from 500 to 680 nm. Before image acquisition, pupils were dilated to at least 7 mm with topical 1% tropicamide and 2.5% phenylephrine. With room lights turned-off, a near-infrared-reflectance image was recorded first. After switching to AF mode (488 nm excitation; beam power < 260μW) the camera was slowly moved towards the patient to allow the patient to adapt to the blue light. Patients were asked to focus on the central fixation light of the device. The fundus was exposed for 20-30 seconds to bleach rhodopsin,22 while focus and alignment were refined to produce maximum and uniform signal over the whole field. The detector sensitivity was adjusted so that the grey levels (GLs) did not exceed the linear range of the detector (GL < 175).22 Two or more images were then recorded (each of 9 frames, in video format) in the high-speed mode (8.9 frames/s) within a 30x30° field (768x768 pixels). To assess t he repeatability of qAF measurements, a second session of AF images was recorded after repositioning patient and camera. After imaging, all videos were inspected for image quality and consistency in GLs. For an imaging session, 2 videos were selected to generate the AF images for analysis. At least 4 out of 9 frames without localized or generalized decreased AF signal (due to eyelid interference or iris obstruction) and no large misalignment of frames (causing double images after alignment) were considered for each image. The frames were then aligned and averaged with the system software and saved in ‘non-normalized’ mode (no histogram stretching). In total, AF imaging was performed on 73 eyes and for 52 of these eyes a second AF imaging session was completed. After reviewing the frames of all AF videos, 18 imaging sessions were excluded because image quality was not considered sufficient enough for quantification. Hence, qAF images of 67 eyes and 40 second imaging sessions were included in this study. Quantitative AF images from all eyes included in this study are presented in a supplemental file (available at http://aaojournal.org).
In addition, a horizontal 9 mm SD-OCT image through the fovea registered to a simultaneously acquired AF or near-infrared reflectance (NIR-R) image was recorded in high-resolution mode as an average of 100 individual images for each eye. The optical depth resolution in the Spectralis is currently ~ 7 microns. In cases where the SD-OCT image had been registered to an NIR-R image i2kRetina software (DualAlign LLC, Clifton Park, NY) was used for alignment of the AF image of the same field.
Image Analysis
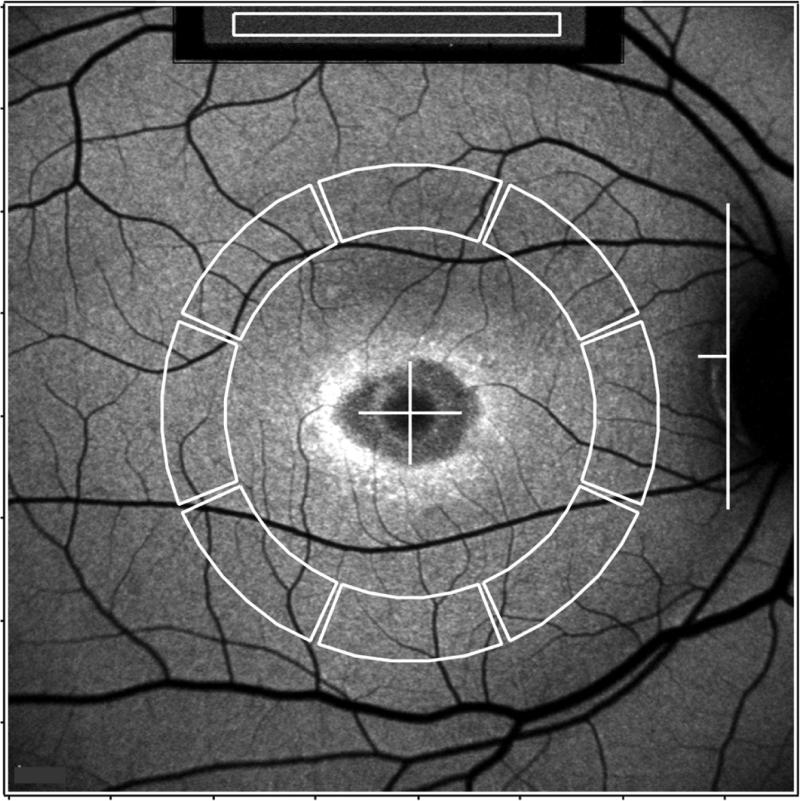
AF images were analyzed under the control of an experienced operator with dedicated image analysis software written in IGOR (WaveMetrics, Lake Oswego, OR) to determine qAF.22 The software recorded the mean GLs of the internal reference and of 8 circularly arranged segments positioned at an eccentricity of about 7°- 9° (Fig. 1). Segments were scaled to the horizontal distance between the fovea and the temporal edge of the optic disc. If the fovea could not be identified, then its position was estimated based on a SD-OCT scan that was registered to an AF or NIR-R image. When a myopic crescent obscured the true edge of the optic disc on AF, a NIR-R image aided in identifying the disc edge (crescent has high reflectance). The software accounted for the presence of vessels and marked atrophy in the segments and automatically excluded segments that were positioned, even partially, at a distance further than 15° from the center of the image. The mean GLs of each segment were then measured and qAF for that segment was calculated taking into account the Reference Calibration Factor, the internal reference GL, zero GL, magnification, and optical media density from normative data on lens transmission spectra24.22 For each eye, the average qAF from the 8 segments (qAF8) from all available images per eye (2 or 4, depending on whether a second imaging session was performed) was generated for comparison to other patients.
Figure 1. Fundus AF image analysis (P14).
Mean grey levels (GLs) are recorded from the internal reference (white rectangle, top of the image) and from 8 circularly arranged segments (outlined in white). The horizontal distance, FD, between the temporal edge of the optic disc (white vertical line) and the center of the fovea (white cross) was used to define inner and outer radii of the ring of segments (0.58xFD and 0.78xFD, respectively). The average of qAF values of the 8 segments is defined as qAF8.
Control values used in this study consisted of previously published data from 277 healthy subjects (374 eyes; age range: 5-60 years) without a family history of retinal dystrophy.14
During the course of the study, the detection aperture of the Spectralis was changed from 6mm to 5mm in diameter to minimize pupil interference. This modification had no effect on qAF measurements since the AF signal of both fundus and reference were affected by the smaller aperture size similarly. The measurements were done with different Spectralis devices and internal references; in each case the Reference Calibration Factor22 was determined using a Master Fluorescent Reference. Correlations between AF and SD-OCT images were made by two of the authors (TD, JRS) who reviewed and discussed the images.
Statistical analyses
Analyses were performed using Prism 5 (GraphPad Software, La Jolla, CA). The qAF8 values were compared to the 95% confidence intervals (CI) of healthy subjects of the same age and race/ethnicity.14 To evaluate the repeatability of the measurements between sessions we used the method of Bland and Altman25 to compute the coefficient of repeatability (CR’, 95% confidence interval) for the differences {log(qAFB)-log(qAFA)}7 where qAFA and qAFB were the qAF8 in the two sessions. The CR expressed in % of the mean qAF8 was calculated as CR=100x(10CR’−1). The coefficient of agreement (CA) between the qAF8 of right and left eyes was computed similarly. Sensitivity and specificity of qAF as a test to differentiate between ABCA4-associated and non-ABCA4-associated BEM were calculated using MedCalc (http://www.medcalc.org/calc/diagnostic_test.php).
RESULTS
ABCA4 mutations were identified in 22 patients including 21 cases (95%) with both disease-causing ABCA4 variants (Table). One patient (P1) was homozygous and 13 patients were compound heterozygous for the p.G1961E variant. ABCA4 was excluded as the causal gene in 15 patients since no mutations were detected after complete sequencing of the ABCA4 exons and adjacent intronic sequences. ABCA4-positive patients tended to be younger (mean age: 21.9 ±8.3 years) than ABCA4-negative patients (mean age: 42.1 ±14.9 years) (unpaired t-test; p<0.0001). There was no difference in visual acuities between the two groups (unpaired t-test; right eyes: p=0.88, left eyes: p=0.13). International Society for Clinical Electrophysiology of Vision (ISCEV) standardized full-field electroretinography (ERG) was performed in 16/22 ABCA4-positive patients. All of these patients were classified as isolated maculopathy (normal full-field ERG).3,26 Of the 15 ABCA4-negative patients, 10 manifested generalized cone dysfunction; 3 had normal ERGs and 2 did not participate in ERG testing.
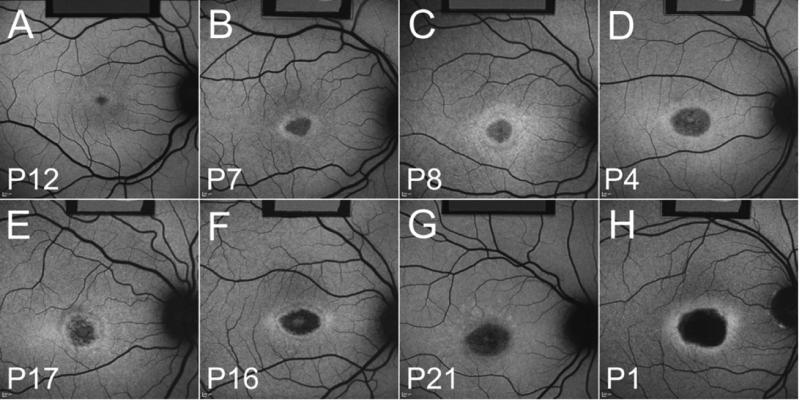
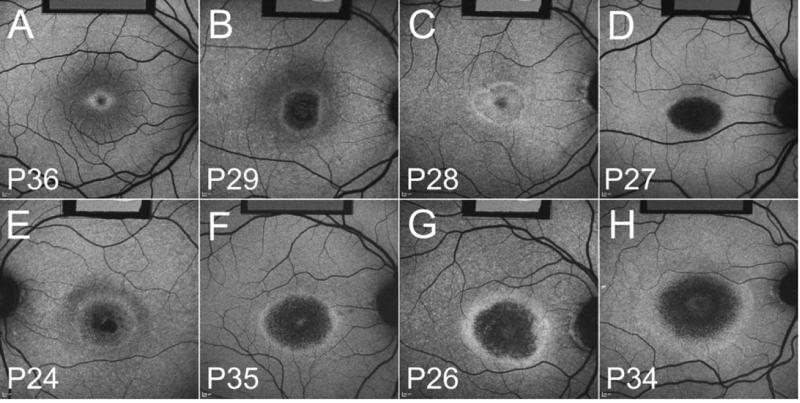
ABCA4-positive and –negative patients shared similar AF features (Figs. 2 and 3; AF images of all patients available at http://aaojournal.org). For instance we found that in both groups of patients the BEM lesion could be distinctly circular (e.g. ABCA4+ve patients 8, 9; ABCA4-ve patients 26, 30, 31, 33, 37) or elliptical (e.g. ABCA4+ve patients 3, 7, 16; ABCA4-ve patients 27, 32). The parafovea could be mottled (e.g. ABCA4+ve patients 3, 4, 9, 15, 17; ABCA4-ve patients 25, 26, 30, 33) and the hyperautofluorescent ring can be bright with well-defined borders (e.g. ABCA4+ve patients 5, 7; ABCA4-ve patients 25, 26, 28), relatively faint (e.g. ABCA4+ve patients 11,13, 19, 21; ABCA4-ve patients 27, 29, 30, 31, 37) or it could be diffuse (e.g. ABCA4+ve patients 18, 22; ABCA4-ve patients 23, 34). The fovea could also appear bright (e.g. ABCA4+ve patient 2, 6, 9, 16; ABCA4-ve patient 30, 32, 33, 35) or dark (e.g. ABCA4+ve patients 14, 18; ABCA4-ve patients 25, 27, 28). Lesion size also varied amongst the patients while there was a remarkable similarity between fellow eyes with respect to lesion size, shape and AF pattern.
Figure 2. Fundus AF images of ABCA4-positve patients.
P12 (A), P7 (B), P8 (C), P4 (D), P17 (E), P16 (F), P21 (G) and P1 (H). The internal AF reference is visible in the top of the image.
Figure 3. Fundus AF images of ABCA4-negative patients.
P36 (A), P29 (B), P28 (C), P27 (D), P24 (E), P35 (F), P26 (G) and P34 (H). The internal AF reference is visible in the top of the image.
Quantitative fundus autofluorescence
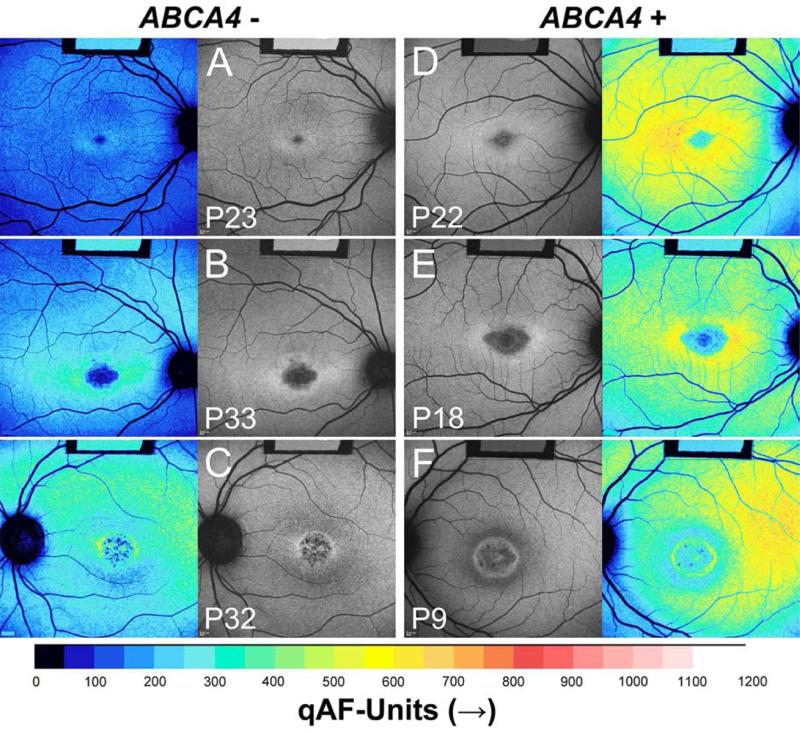
The difficulties inherent in distinguishing patients with and without ABCA4 mutations based on conventional fundus AF images are further illustrated in Fig. 4, where age-similar ABCA4-negative (left) and ABCA4-positve patients (right) are presented side by side. When comparing the corresponding color-coded qAF maps of these patients, however, it becomes immediately noticeable that ABCA4-positive BEM eyes exhibit higher qAF levels than ABCA4-negative BEM eyes.
Figure 4. Quantitative fundus autofluorescence.
Color-coded qAF images are shown together with the corresponding AF images. Lower qAF levels are coded in blue and higher qAF levels as orange (see color-code scale). ABCA4-negative patients (A, P23, 16 years; B, P33, 22 years; C, P32, 33 years) have lower qAF values than age-similar ABCA4-positive patients (D, P22, 18 years; E, P18, 26 years; F, P9, 21 years). Note that the fundus has similar grey levels in each AF image but the internal AF reference (top of image) is darker in ABCA4-positive patients, reflecting the higher fundus AF levels.
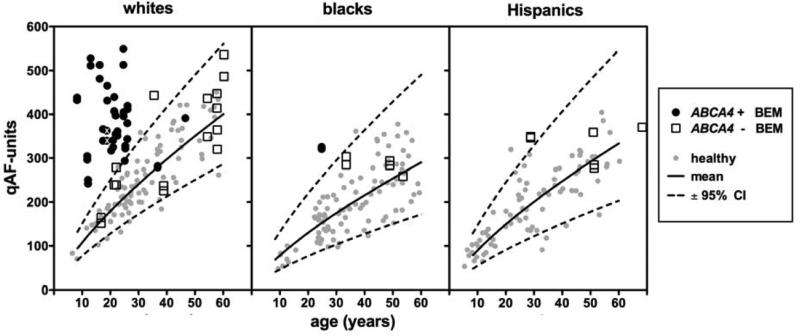
This difference in qAF levels is also shown in Fig. 5, where qAF8 of each eye are plotted versus age and compared to the 95% confidence intervals (CI) of healthy subjects.14 ABCA4-positive patients tend to cluster at young ages whereas ABCA4-negative patients are represented at all ages with a tendency to cluster at older ages. In the ABCA4-positive group, 37/41 eyes (19/22 patients) had qAF8 above the 95% CI for age. Conversely, in the ABCA4-negative group, 22/26 eyes (13/15 patients) had qAF8 within the normal range. This difference between the ABCA4-positive and ABCA4-negative groups was significant, Chi-square (2, N=67) = 37.5, p <0.0001. Of the two ABCA4-positive patients that had qAF8 within the normal range for age, one was homozygous and the other one heterozygous for p.G1916E. Considering only white ABCA4-positive patients under 30 years of age, we found that mean qAF8 was 366±72 qAF-units for patients carrying the p.G1961E mutation and 416±89 for patients carrying variants other than p.G1961E but the difference was not significant. (p=0.2, two-tailed t test). There was no difference in age between ABCA4-positive patients that carried the p.G1961E variant and those that did not (unpaired t-test, p=0.1).
Figure 5. Quantitative fundus autofluorescence.
qAF8 from each eye of BEM patients, plotted as a function of age. ABCA4-positive BEM patients are shown as black circles. ABCA4-negative BEM patients are shown as non-filled squares. For comparison, qAF8 from healthy subjects14 (grey circles) are plotted together with mean (solid line) and 95% confidence intervals (CI) (dashed lines). Since qAF8 varies with race/ethnicity, white, black and Hispanic patients/subjects are shown in separate plots. The eyes of an Indian patient (P3; marked with white ‘X’) are included in the plot of white subjects since upper 95% CI of whites and Indians is similar.14
The sensitivity of qAF measurements in this study was calculated as the percent of ABCA4-positive BEM patients with a qAF value above the 95% CI for age divided by the total number of BEM patients; sensitivity was 86.4 % (95% CI: 65.1 to 96.94 %). The specificity was 86.67 (95% CI: 59.5 % to 97.9%; calculated as the probability that a qAF value will be within the 95% CI for age when the patient is ABCA4-negative).
For qAF8 of right and left eyes (n=30), the Bland Altman coefficient of agreement was 15.6%. The between-session Bland-Altman coefficient of repeatability was ±8.8% (40 eyes of 24 patients). The study cohort had a coefficient of agreement between eyes and a between-session coefficient of repeatability that were similar to healthy subjects (±15.3% and ±9.4% respectively),14 STGD1 (±13% and ±10.3% respectively)20 and Best vitelliform macular dystrophy (±19.2% and ±7.0% respectively).23
Spectral-domain optical coherence tomography
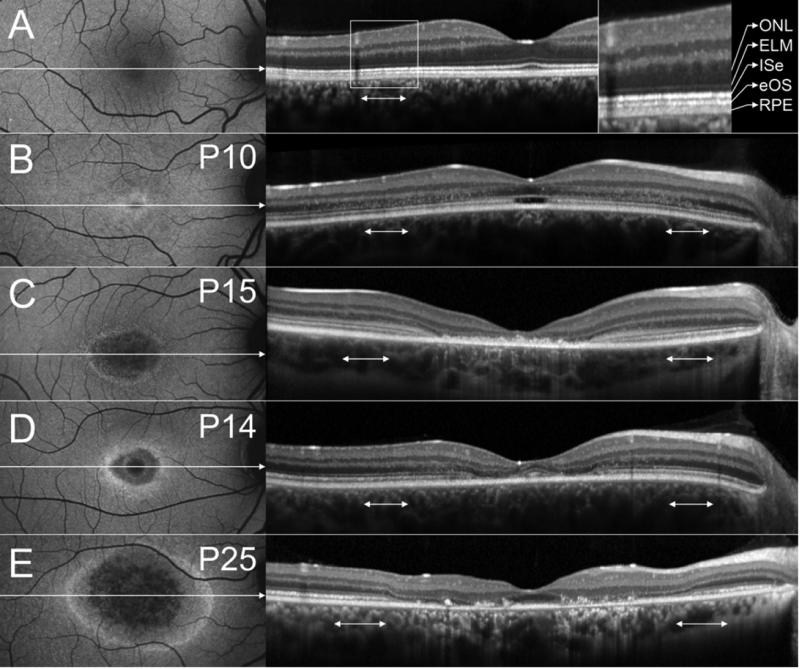
Correlations between AF and SD-OCT images were made for 73 eyes. Severe nystagmus did not permit acquisition of an AF image for the right eye of P25. Fellow eyes of each patient generally had very similar SD-OCT findings. In Fig. 6, representative SD-OCT images of a healthy subject (A), P10 (B), P15 (C), P14 (D) and P25 (E) are shown. The high AF ring surrounding the low AF lesion area correlated in all eyes with the outer limits of a central area of ISe loss/break-up. SD-OCT features of the low AF lesion area included obvious RPE thinning in 53 eyes (27 patients, 15 of which were ABCA4-positive), increased choroidal reflectivity in 61 eyes (32 patients, 19 of which were ABCA4-positive) and variable amounts of hyperreflective debris above RPE/Bruch's membrane in 53 eyes (28 patients, 15 of which were ABCA4-positive). An optical empty lesion (OEL) with localized ISe loss at the fovea and an intact external limiting membrane (ELM) throughout the SD-OCT scan, was present in 10 eyes (5 patients, all ABCA4-positive) (Fig. 6B). Relative foveal sparing, as shown in Fig. 6D-E, was present in 9 eyes (7 patients, 3 of which were ABCA4-positive). In all eyes except for P36, the outer nuclear layer (ONL) was thinned in the central part of the lesion and in an adjacent transition zone. In 32 eyes (16 patients, 14 of which were ABCA4-positive), the ONL was disrupted by hyperreflective dots in the transition zone bordering the central lesion. Interestingly, this feature was most pronounced in patients with an OEL (Fig 6B). In some patients, the ELM appeared more pronounced than in healthy subjects (Fig. 6C). At the eccentricities where qAF measurements were obtained (double headed arrows in Fig. 6), in at least some eyes abnormalities were observed in the form of hyperreflective dots at the level of the ONL (Fig. 6B), ELM thickening (Fig. 6C) or ONL thinning (Fig. 6E).
Figure 6. Spectral domain optical coherence tomography (SD-OCT).
AF images (left) and corresponding SD-OCT images (right) of a 21-year-old healthy subject (A), P10 (B), P15 (C), P14 (D) and P25 (E). Horizontal axis and extent of SD-OCT image indicated by white arrow in AF image. SD-OCT images were stretched vertically for presentation purposes. The retinal layers corresponding to outer nuclear layer (ONL), external limiting membrane (ELM), inner segment ellipsoid (ISe), ensheathed outer segments (eOS) and retinal pigment epithelium (RPE)/Bruch's membrane are indicated in (A). The assignment is based on Curcio/Spaide.39 The double-headed white arrows in the SD-OCT images indicate the position where the qAF measurements were taken (Fig. 1).
DISCUSSION
In the present study, we assessed whether qAF, an indirect measure of RPE lipofuscin, could aid in differentiating ABCA4-positve from ABCA4-negative cases of BEM. Quantitative AF clearly distinguished the two groups. Specifically, qAF analysis indicated that ABCA4-positive BEM patients have increased lipofuscin levels throughout the posterior pole, while patients with BEM due to mutations in other genes have qAF levels within normal limits for age. These data reinforce the clinical utility of qAF. Due to the association between ABCA4-related disease and a dark choroid in fluorescein angiography, the latter imaging modality can also benefit diagnosis. However, qAF has the advantage of being non-invasive. It is also worth noting that In the case of G1961E mutations in ABCA4 neither fluorescein angiography nor qAF may be helpful imaging modalities; a dark choroid is absent in these individuals27 and in the presence of the G1961E mutation, qAF values can be within the normal range for age (Fig. 5).
The ABCA4 disease pathway is known. Functioning ABCA4 protein28 is needed to remove N-retinylidene-phosphatidylethanolamine (NRPE), formed by the binding of retinaldehyde to phosphatidylethanolamine (PE), from the outer segment disc membranes of rods and cones. Failure of this process, such as in STGD1, permits NRPE to accumulate in excess such that a second molecule of retinaldehyde can react with NRPE leading to the formation of A2E and related bisretinoids. These molecules are phagocytosed and stored in RPE cells as lipofuscin and have potential for cellular damage.13 The disease pathways in ABCA4-negative BEM patients are less clear and the phenotypic similarities between ABCA4-positive and ABCA4-negative patients are currently difficult to explain. Moreover, while lipofuscin accumulation is likely involved in the primary pathogenesis of ABCA4-related disease, whether or not this is the case for non-ABCA4-disease is not known.
Although retinal changes were most obvious in the central macula, we also observed ONL thinning in a transition zone at the lesion border in all but one patient. In a subgroup of patients, the ONL in the transition zone was altered by the presence of hyperreflective material. The ELM was also pronounced outside the central part of the lesion in some ABCA4-positive patients. A case of ELM thickening in a young STGD1 patient without any obvious RPE changes has been reported before29 and it was suggested that ELM thickening could be an early disease marker. While in our study cohort all patients with an OEL were ABCA4-positive, other studies have shown that OEL can also be associated with mutations in other genes, e.g. in achromatopsia.30 We identified several quantifiable features by SD-OCT, however, none of these clearly distinguished ABCA4-positive and ABCA4-negative cases.
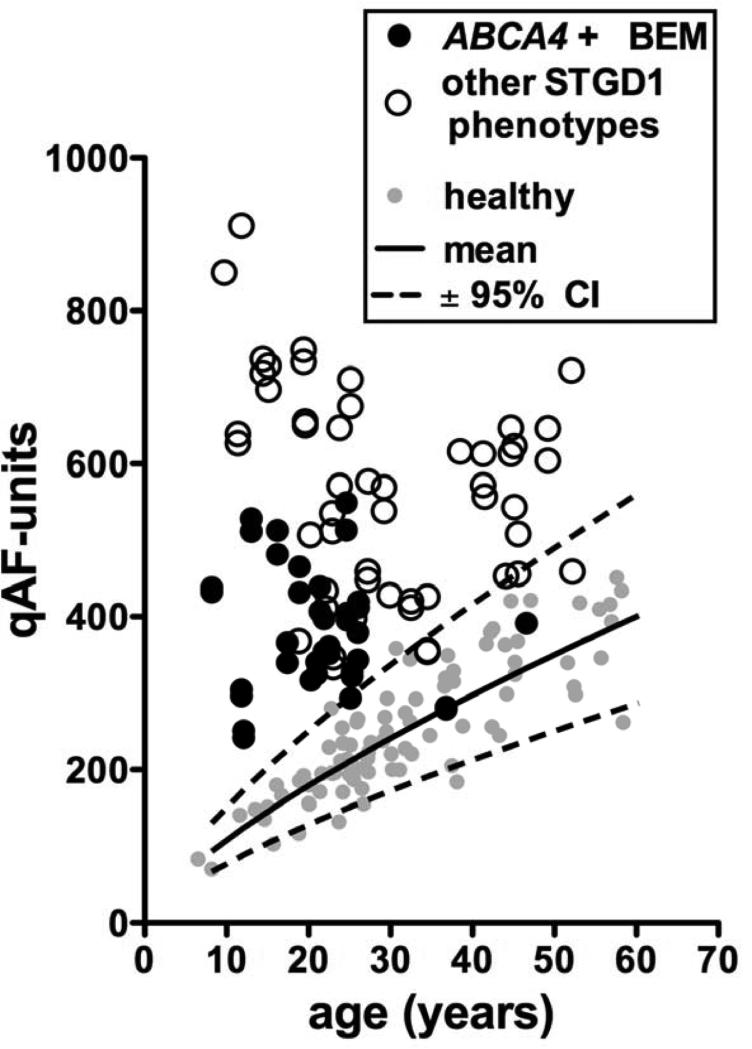
Since all photoreceptors of ABCA4-positive cases have a defective visual cycle, it is perhaps not surprising, that retinal changes also extended into areas that appeared unaffected on AF imaging. It is interesting to consider however, why the central macula appears to be more susceptible to the damaging effects of the ABCA4 mutations than the rest of the retina. One possibility is that certain ABCA4 mutations, for instance, the p.G1961E variant, may elicit a stronger effect on cones than rods. Although p.G1961E is the most frequent ABCA4 variant in STGD1 (allele frequency ~10%),31,32 it is still remarkable that 14/22 (64%) ABCA4-positive BEM patients carried this variant. It has been noted before, however, that the p.G1961E appears to be associated with the BEM phenotype and a milder disease spectrum.2,20,31,33 The notion that STGD1 patients with a BEM phenotype have less widespread disease is further supported by Fig. 7, which shows the qAF8 levels of the white ABCA4-positve BEM patients in comparison to previously published20 white STGD1 patients with other phenotypes than BEM, including patients with extramacular fundus changes. ABCA4-positve BEM patients have higher qAF levels than normal subjects (and ABCA4-negative BEM patients) but can have relatively low qAF levels when compared to other STGD1 patients.
Figure 7. Quantitative fundus autofluorescence in patients homozygous or compound heterozygous for disease-causing mutations in ABCA4.
qAF8 of both eyes of white STGD1 patients with a phenotype other than BEM (non-filled circles)20 are shown together with qAF8 of white ABCA4-positive BEM patients (black circles). For comparison, qAF8 from white healthy subjects14 (grey circles) together with their 95% confidence intervals (dashed lines) and mean (solid line) are shown.
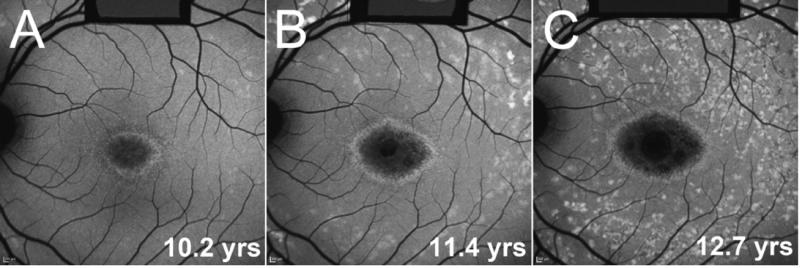
It is perhaps not a coincidence that most ABCA4-positive patients in our study clustered at young ages. In STGD1, the BEM phenotype may in some cases be a transient stage and patients will eventually develop more extensive fundus changes. This is illustrated in Fig. 8 wherein disease progression over a period of 2.5 years is shown for the brother of P15, who also carries the complex allele L541P/A1038V. At the initial visit (Fig. 8A), this patient could readily have been classified as presenting with BEM. However, we decided not to include the patient in this study since some peripheral flecks were already visible. At the subsequent visits 1.2 (Fig. 8B) and 2.5 (Fig. 8C) years later, the flecks were more pronounced and numerous.
Figure 8. Disease progression in an ABCA4-positive patient.
AF images from three visits (A-C) are shown for the brother of P15 at the indicated ages, illustrating that patients with a BEM phenotype can develop extramacular disease and flecks. This patient was not included in the study (due to presence of peripheral flecks) but also carries the complex allele L541P/A1038V.
A question that is not only of interest for the interpretation of the AF signal in BEM but also for other retinal dystrophies, is what may be the basis for the high AF ring that surrounds the low AF part of the central lesion. We found that, similar to retinitis pigmentosa,34 the ISe was discontinued at the outer border of or within the high AF ring. Thus, the high AF ring may reflect an accelerated production of bisretinoids within degenerating photoreceptors.35 As an alternative explanation, Freund et al. recently suggested that the high AF ring may result from a “window defect”.36 They proposed that loss of the outer retina might cause less absorption of the AF signal originating from the RPE. However, photopigment, the major absorber of the fundus AF exciting and emitted light, was bleached before image acquisition in our protocol.
A limitation of this study is that retinal layer thicknesses on SD-OCT were not analyzed quantitatively. By retinal layer segmentation one could confirm whether the ONL was thinned throughout the retina or whether the thinning was limited to the central part of the lesion and the adjacent transition zone.37
While finding the definitive causal genes in the ABCA4-negative patients is beyond the scope of this study, we have investigated the genetic causality in most ABCA4-negative cases by whole-exome sequencing (WES, 7/15 patients) or targeted candidate gene sequencing (4/15 patients). While these studies have not yielded the causal gene in most cases, we found that: 1) the genetic causality varies widely in the ABCA4-negative group; 2) except for one patient with an RPGR mutation, in all cases we excluded known genes that have previously been associated with the BEM phenotype (PROM1, GUCA1A, etc.); 3) in some cases we unexpectedly found disease-causing mutations in known retinal disease genes such as CRX38 and CNGA3, which have never been associated with the BEM phenotype; i.e., suggesting phenotypic expansion (BEM phenotype in genes known to cause a very different disease phenotype). Since almost all of our patients exhibit sporadic disease with no available family members, we were not able to identify the causal gene, even by WES, in most cases since, unless one finds clearly pathogenic variants in known disease genes, it is impossible to distinguish between many candidate genes that result from WES studies of a single patient. In summary, we found a very likely causal gene in 5/15 cases, excluded known BEM-associated genes in most cases, and identified multiple possible new causal genes in 4/15 cases that would need detailed follow-up analyses.
A common challenge in the diagnosis of retinal dystrophies is that mutations in different genes can result in very similar phenotypes. Identifying the causal gene has implications with respect to the patient's prognosis and will be critical when personalized treatment options such as gene therapy become available. Quantitative AF cannot circumvent the need for genetic testing of causal genes such as ABCA4. However, clinical criteria such as qAF that provides some indication of how likely a specific gene is the cause of a patient's phenotype, can be a valuable clinical tool. For instance, in patients with a clinical diagnosis of recessive Stargardt disease (STGD1), complete sequencing of exons and adjacent intronic sequences in the ABCA4 gene, may identify only one disease-causing mutation in 15-20% of cases and no mutations in 10-15% of individuals.32 In these groups of patients, qAF analysis can be particularly valuable. While qAF levels in the normal range do not completely exclude the possibility of ABCA4 mutations, they substantially increase the likelihood of finding causal mutations in genes other than ABCA4.
Quantitative AF is clinically useful to recognize BEM patients with qAF levels above the normal limits for age, as in these patients one might expect to confirm the presence of ABCA4 mutations with genotyping. Thus the qAF method could perhaps guide genetic testing and help to counsel patients at a stage where genetic results are not yet available. Ongoing longitudinal qAF studies involving STGD1 patients hold promise in providing valuable information regarding the natural course of the disease. Quantitative AF may also help to ascertain the role of lipofuscin in different disorders. Whether the qAF approach will be useful as an outcome measure in clinical trials, remains to be determined.
Supplementary Material
Précis.
The qAF method can differentiate between ABCA4-associated and non-ABCA4-associated Bull's-Eye maculopathy and may guide clinical diagnosis and genetic testing.
Acknowledgments
Financial support
Supported in part by grants from the National Eye Institute/NIH EY024091, EY021163, EY019861, P30EY019007, Foundation Fighting Blindness and a grant from Research to Prevent Blindness to the Department of Ophthalmology, Columbia University. During initial stages of the work, FCD was partially supported by EY015520.
Footnotes
Publisher's Disclaimer: This is a PDF file of an unedited manuscript that has been accepted for publication. As a service to our customers we are providing this early version of the manuscript. The manuscript will undergo copyediting, typesetting, and review of the resulting proof before it is published in its final citable form. Please note that during the production process errors may be discovered which could affect the content, and all legal disclaimers that apply to the journal pertain.
Supplemental material (available at http://aaojournal.org): Quantitative AF images from all eyes included in this study
Disclosure: The authors report no conflicts of interest in this work.
References
- 1.Kellner U, Renner AB, Tillack H. Fundus autofluorescence and mfERG for early detection of retinal alterations in patients using chloroquine/hydroxychloroquine. Invest Ophthalmol Vis Sci. 2006;47:3531–8. doi: 10.1167/iovs.05-1290. [DOI] [PubMed] [Google Scholar]
- 2.Cella W, Greenstein VC, Zernant-Rajang J, et al. G1961E mutant allele in the Stargardt disease gene ABCA4 causes bull's eye maculopathy. Exp Eye Res. 2009;89:16–24. doi: 10.1016/j.exer.2009.02.001. [DOI] [PMC free article] [PubMed] [Google Scholar]
- 3.Kurz-Levin MM, Halfyard AS, Bunce C, et al. Clinical variations in assessment of bull's-eye maculopathy. Arch Ophthalmol. 2002;120:567–75. doi: 10.1001/archopht.120.5.567. [DOI] [PubMed] [Google Scholar]
- 4.Michaelides M, Chen LL, Brantley MA, Jr, et al. ABCA4 mutations and discordant ABCA4 alleles in patients and siblings with bull's-eye maculopathy. Br J Ophthalmol. 2007;91:1650–5. doi: 10.1136/bjo.2007.118356. [DOI] [PMC free article] [PubMed] [Google Scholar]
- 5.Kearns TP, Hollenhorst RW. Chloroquine retinopathy. Evaluation by fluorescein fundus angiography. Arch Ophthalmol. 1966;76:378–84. doi: 10.1001/archopht.1966.03850010380016. [DOI] [PubMed] [Google Scholar]
- 6.Michaelides M, Gaillard MC, Escher P, et al. The PROM1 mutation p.R373C causes an autosomal dominant bull's eye maculopathy associated with rod, rod-cone, and macular dystrophy. Invest Ophthalmol Vis Sci. 2010;51:4771–80. doi: 10.1167/iovs.09-4561. [DOI] [PMC free article] [PubMed] [Google Scholar]
- 7.Michaelides M, Holder GE, Hunt DM, et al. A detailed study of the phenotype of an autosomal dominant cone-rod dystrophy (CORD7) associated with mutation in the gene for RIM1. Br J Ophthalmol. 2005;89:198–206. doi: 10.1136/bjo.2004.050773. [DOI] [PMC free article] [PubMed] [Google Scholar]
- 8.Michaelides M, Johnson S, Poulson A, et al. An autosomal dominant bull's-eye macular dystrophy (MCDR2) that maps to the short arm of chromosome. 4. Invest Ophthalmol Vis Sci. 2003;44:1657–62. doi: 10.1167/iovs.02-0941. [DOI] [PubMed] [Google Scholar]
- 9.Robson A, Michaelides M, Saihan Z, et al. Functional characteristics of patients with retinal dystrophy that manifest abnormal parafoveal annuli of high density fundus autofluorescence; a review and update. Doc Ophthalmol. 2008;116:79–89. doi: 10.1007/s10633-007-9087-4. [DOI] [PMC free article] [PubMed] [Google Scholar]
- 10.Robson AG, Michaelides M, Luong VA, et al. Functional correlates of fundus autofluorescence abnormalities in patients with RPGR or RIMS1 mutations causing cone or cone rod dystrophy. Br J Ophthalmol. 2008;92:95–102. doi: 10.1136/bjo.2007.124008. [DOI] [PubMed] [Google Scholar]
- 11.Michaelides M, Wilkie SE, Jenkins S, et al. Mutation in the gene GUCA1A, encoding guanylate cyclase-activating protein 1, causes cone, cone-rod, and macular dystrophy. Ophthalmology. 2005;112:1442–7. doi: 10.1016/j.ophtha.2005.02.024. [DOI] [PubMed] [Google Scholar]
- 12.Delori FC, Dorey CK, Staurenghi G, et al. In vivo fluorescence of the ocular fundus exhibits retinal pigment epithelium lipofuscin characteristics. Invest Ophthalmol Vis Sci. 1995;36:718–29. [PubMed] [Google Scholar]
- 13.Sparrow JR, Gregory-Roberts E, Yamamoto K, et al. The bisretinoids of retinal pigment epithelium. Prog Retin Eye Res. 2012;31:121–35. doi: 10.1016/j.preteyeres.2011.12.001. [DOI] [PMC free article] [PubMed] [Google Scholar]
- 14.Greenberg JP, Duncker T, Woods RL, et al. Quantitative fundus autofluorescence in healthy eyes. Invest Ophthalmol Vis Sci. 2013;54:5684–93. doi: 10.1167/iovs.13-12445. [DOI] [PMC free article] [PubMed] [Google Scholar]
- 15.Delori FC, Goger DG, Dorey CK. Age-related accumulation and spatial distribution of lipofuscin in RPE of normal subjects. Invest Ophthalmol Vis Sci. 2001;42:1855–66. [PubMed] [Google Scholar]
- 16.Delori FC, Staurenghi G, Arend O, et al. In vivo measurement of lipofuscin in Stargardt's disease--Fundus flavimaculatus. Invest Ophthalmol Vis Sci. 1995;36:2327–31. [PubMed] [Google Scholar]
- 17.Birnbach CD, Jarvelainen M, Possin DE, Milam AH. Histopathology and immunocytochemistry of the neurosensory retina in fundus flavimaculatus. Ophthalmology. 1994;101:1211–9. doi: 10.1016/s0161-6420(13)31725-4. [DOI] [PubMed] [Google Scholar]
- 18.Cideciyan AV, Aleman TS, Swider M, et al. Mutations in ABCA4 result in accumulation of lipofuscin before slowing of the retinoid cycle: a reappraisal of the human disease sequence. Hum Mol Genet. 2004;13:525–34. doi: 10.1093/hmg/ddh048. [DOI] [PubMed] [Google Scholar]
- 19.Eagle RC, Jr, Lucier AC, Bernardino VB, Jr, Yanoff M. Retinal pigment epithelial abnormalities in fundus flavimaculatus: a light and electron microscopic study. Ophthalmology. 1980;87:1189–200. doi: 10.1016/s0161-6420(80)35106-3. [DOI] [PubMed] [Google Scholar]
- 20.Burke TR, Duncker T, Woods RL, et al. Quantitative fundus autofluorescence in recessive Stargardt disease. Invest Ophthalmol Vis Sci. 2014;55:2841–52. doi: 10.1167/iovs.13-13624. [DOI] [PMC free article] [PubMed] [Google Scholar]
- 21.Jaakson K, Zernant J, Kulm M, et al. Genotyping microarray (gene chip) for the ABCR (ABCA4) gene. Hum Mutat. 2003;22:395–403. doi: 10.1002/humu.10263. [DOI] [PubMed] [Google Scholar]
- 22.Delori F, Greenberg JP, Woods RL, et al. Quantitative measurements of autofluorescence with the scanning laser ophthalmoscope. Invest Ophthalmol Vis Sci. 2011;52:9379–90. doi: 10.1167/iovs.11-8319. [DOI] [PMC free article] [PubMed] [Google Scholar]
- 23.Duncker T, Greenberg JP, Ramachandran R, et al. Quantitative fundus autofluorescence and optical coherence tomography in Best vitelliform macular dystrophy. Invest Ophthalmol Vis Sci. 2014;55:1471–82. doi: 10.1167/iovs.13-13834. [DOI] [PMC free article] [PubMed] [Google Scholar]
- 24.van de Kraats J, van Norren D. Optical density of the aging human ocular media in the visible and the UV. J Opt Soc Am A Opt Image Sci Vis. 2007;24:1842–57. doi: 10.1364/josaa.24.001842. [DOI] [PubMed] [Google Scholar]
- 25.Bland JM, Altman DG. Statistical method for assessing agreement between two methods of clinical measurement. Lancet. 1986;1:307–10. [PubMed] [Google Scholar]
- 26.Lois N, Holder GE, Bunce C, et al. Phenotypic subtypes of Stargardt macular dystrophy–fundus flavimaculatus. Arch Ophthalmol. 2001;119:359–69. doi: 10.1001/archopht.119.3.359. [DOI] [PubMed] [Google Scholar]
- 27.Fishman GA, Stone EM, Grover S, et al. Variation of clinical expression in patients with Stargardt dystrophy and sequence variations in ABCR gene. Arch Ophthalmol. 1999;117:504–10. doi: 10.1001/archopht.117.4.504. [DOI] [PubMed] [Google Scholar]
- 28.Quazi F, Lenevich S, Molday RS. ABCA4 is an N-retinylidene phosphatidylethanolamine and phosphatidylethanolamine importer. Nat Commun. 2012;3:925. doi: 10.1038/ncomms1927. [DOI] [PMC free article] [PubMed] [Google Scholar]
- 29.Burke TR, Yzer S, Zernant J, et al. Abnormality in the external limiting membrane in early Stargardt disease. Ophthalmic Genet. 2013;34:75–7. doi: 10.3109/13816810.2012.707271. [DOI] [PMC free article] [PubMed] [Google Scholar]
- 30.Greenberg JP, Sherman J, Zweifel SA, et al. Spectral-domain optical coherence tomography staging and autofluorescence imaging in achromatopsia. JAMA Ophthalmol. 2014;132:437–45. doi: 10.1001/jamaophthalmol.2013.7987. [DOI] [PMC free article] [PubMed] [Google Scholar]
- 31.Burke TR, Fishman GA, Zernant J, et al. Retinal phenotypes in patients homozygous for the G1961E mutation in the ABCA4 gene. Invest Ophthalmol Vis Sci. 2012;53:4458–67. doi: 10.1167/iovs.11-9166. [DOI] [PMC free article] [PubMed] [Google Scholar]
- 32.Zernant J, Schubert C, Im KM, et al. Analysis of the ABCA4 gene by next-generation sequencing. Invest Ophthalmol Vis Sci. 2011;52:8479–87. doi: 10.1167/iovs.11-8182. [DOI] [PMC free article] [PubMed] [Google Scholar]
- 33.Fujinami K, Sergouniotis PI, Davidson AE, et al. The clinical effect of homozygous ABCA4 alleles in 18 patients. Ophthalmology. 2013;120:2324–31. doi: 10.1016/j.ophtha.2013.04.016. [DOI] [PubMed] [Google Scholar]
- 34.Duncker T, Tabacaru MR, Lee W, et al. Comparison of near-infrared and short-wavelength autofluorescence in retinitis pigmentosa. Invest Ophthalmol Vis Sci. 2013;54:585–91. doi: 10.1167/iovs.12-11176. [DOI] [PMC free article] [PubMed] [Google Scholar]
- 35.Sparrow JR, Yoon KD, Wu Y, Yamamoto K. Interpretations of fundus autofluorescence from studies of the bisretinoids of the retina. Invest Ophthalmol Vis Sci. 2010;51:4351–7. doi: 10.1167/iovs.10-5852. [DOI] [PMC free article] [PubMed] [Google Scholar]
- 36.Freund KB, Mrejen S, Jung J, et al. Increased fundus autofluorescence related to outer retinal disruption. JAMA Ophthalmol. 2013;131:1645–9. doi: 10.1001/jamaophthalmol.2013.5030. [DOI] [PubMed] [Google Scholar]
- 37.Lazow MA, Hood DC, Ramachandran R, et al. Transition zones between healthy and diseased retina in choroideremia (CHM) and Stargardt disease (STGD) as compared to retinitis pigmentosa (RP). Invest Ophthalmol Vis Sci. 2011;52:9581–90. doi: 10.1167/iovs.11-8554. [DOI] [PMC free article] [PubMed] [Google Scholar]
- 38.Yamamoto SJ, Charng WL, Gambin T, et al. A Drosophila genetic resource to study the homologs of human disease-causing genes and its use in gene discovery from analyses of human exome data. Cell. (in press) [Google Scholar]
- 39.Spaide RF, Curcio CA. Anatomical correlates to the bands seen in the outer retina by optical coherence tomography. Literature review and model. Retina. 2011;31:1609–19. doi: 10.1097/IAE.0b013e3182247535. [DOI] [PMC free article] [PubMed] [Google Scholar]
Associated Data
This section collects any data citations, data availability statements, or supplementary materials included in this article.


