

Abstract
Injectable, degradation-resistant peptide agonists for the glucagon-like peptide 1 (GLP-1) receptor (GLP-1R), such as exenatide and liraglutide, activate the GLP-1R via a complex orthosteric-binding site and are effective therapeutics for glycemic control in type 2 diabetes. Orally bioavailable orthosteric small-molecule agonists are unlikely to be developed, whereas positive allosteric modulators (PAMs) may offer an improved therapeutic profile. We hypothesize that allosteric modulators of the GLP-1R would increase the potency and efficacy of native GLP-1 in a spatial and temporally preserved manner and/or may improve efficacy or side effects of injectable analogs. We report the design, optimization, and initial results of a duplexed high-throughput screen in which cell lines overexpressing either the GLP-1R or the glucagon receptor were coplated, loaded with a calcium-sensitive dye, and probed in a three-phase assay to identify agonists, antagonists, and potentiators of GLP-1, and potentiators of glucagon. 175,000 compounds were initially screened, and progression through secondary assays yielded 98 compounds with a variety of activities at the GLP-1R. Here, we describe five compounds possessing different patterns of modulation of the GLP-1R. These data uncover PAMs that may offer a drug-development pathway to enhancing in vivo efficacy of both endogenous GLP-1 and peptide analogs.
Keywords: High-throughput screening, glucagon-like peptide-1 receptor, calcium, positive allosteric modulator, agonist
Introduction
Glucagon-like peptide 1 (GLP-1) is a gut-derived hormone that is released in response to oral nutrients and plays a role in a variety of physiological functions, including inhibition of gastric emptying, inhibition of food intake, and most notably enhancement of glucose-stimulated insulin secretion from pancreatic β-cells.1 Central and peripheral administration of GLP-1 is known to elicit food intake and blood glucose–lowering effects in human and rodent models,2 making the GLP-1 receptor (GLP-1R) an attractive therapeutic target. The half-life of GLP-1 in the bloodstream is minutes, due to cleavage by dipeptidyl peptidase-IV (DPP-IV),3 and therefore other strategies have been deployed to capitalize on this therapeutically relevant receptor. Thus, subcutaneously administered peptide analogs that are resistant to DPP-IV inactivation, such as Byetta (exenatide)® and Victoza (liraglutide)®,4 and small-molecule, orally bioavailable DPP-IV inhibitors, such as Januvia (sitaglipin)®3 and Onglyza (saxagliptin)®, have been successfully developed and marketed to capitalize on the salutary effects of GLP-1R activation in diabetes.
The efficacy of these therapeutics to improve hemoglobin A1c, fasting glucose concentration, weight loss, and insulin secretion and to inhibit glucagon release has been validated in several large-scale clinical studies.5 Exenatide is a short-acting GLP-1 agonist dosed twice daily at 5–10 µg, whereas liraglutide has a longer half-life and is given in 0.6–1.2 mg dosages once daily, although longer-acting versions of these agonists are beginning to emerge.6 Despite the tremendous clinical success of this class of peptide incretin mimetics, liabilities do exist. Adherence to an injectable medication can be limiting,7 and side effects such as nausea, vomiting, and gastrointestinal distress may further limit compliance.8 Additional concerns regarding pancreatitis and pancreatic malignancies have also been raised.9
Diabetes mellitus is a progressive disease, and GLP-1R agonists, which have efficacy to control blood glucose levels and also body weight, have offered the potential to be truly disease altering. A firm demonstration of alteration of disease course has yet to be demonstrated. The overarching hypothesis of our work is that allosteric modulation of GLP-1R signaling may offer the opportunity to augment and/or fine-tune both native GLP-1 action and that of peptide analogs. For example, the amplification of native GLP-1 signaling in a temporally and spatially preserved manner may prove optimal for fully capitalizing on the salutary effects of GLP-1 action during the course of diabetes disease progression. Furthermore, this approach may offer an opportunity to attenuate or eliminate side effects by coadministration with peptide analogs, allowing lower exposure with enhanced potency. Finally, an exciting development in G-protein-coupled receptor (GPCR) biology, allosteric modulation, offers the opportunity to alter the intracellular signal transduced by receptor activation, a concept referred to as signaling bias.10 Thus, the development of experimental tools with unique modes of action at the GLP-1R will allow us to test the hypothesis that allosteric modulation could improve on native biology and current therapies and potentially engender disease-altering therapeutics.
The GLP-1R belongs to the class-B GPCR family and binds four different forms of endogenous GLP-1 peptide—GLP-1(1-37), GLP-1(7-37), GLP-1(1-36)NH2, and GLP-1(7-36)NH2—and a structurally related peptide, oxyntomodulin. Upon ligand binding, the GLP-1R primarily couples to the Gαs heterotrimeric G-protein, resulting in conversion of adenosine triphosphate (ATP) to cyclic adenosine monophosphate (cAMP) through adenylate cyclase–dependent mechanisms,11 although there is evidence that the GLP-1R couples to multiple G-proteins.12 GLP-1 binding to its receptor is known to activate several downstream signaling targets, the most well characterized being the phosphorylation of extracellular signal-regulated kinase (ERK),13 activation of phosphatidylinositol 3-kinase,14 and opening of voltage-dependent Ca2+ channels, which elicits the release of insulin from β-cells.15–16 Although capitalizing on these intracellular targets would have tremendous therapeutic benefit, the development of small-molecule orthosteric ligands has been challenging likely because of the large and structurally complex orthosteric-binding site.11 Thus, identification of small molecules with an allosteric mode of action was especially attractive at this GPCR. Indeed, a large proportion of current small-molecule therapeutics target GPCRs of multiple classes, and allosteric modulation has gained recognition as a tractable therapeutic strategy.17–18
Here, we describe screening a compound library to uncover GLP-1R-specific allosteric modulators and their initial characterization. Our approach is an innovative duplexed screening paradigm in which we coplated two different cell types overexpressing either the GLP-1R or the glucagon receptor to more quickly identify compounds that are nonspecific for the GLP-1R target. We developed novel and robust primary and secondary high-throughput screening (HTS) assays, validated chemical “hits” via retesting and characterizing concentration responses, demonstrated the selectivity of key compounds for the GLP-1R, and further characterized and classified compounds into agonist, positive allosteric modulator, or antagonist groups based on their activity profile. The results are used to discuss the different approaches to discovery of GLP-1R PAMs and how the results may translate into in vivo therapeutic effects.
Methods
Creation of GLP-1R, Glucocorticoid Receptor (GR), and p-GLO Insulinoma (INS-1) Cell Lines
Human GLP-1R 9-3-H cells were obtained by clonal selection of a GLP-1R-overexpressing cell line derived from ChemiSCREEN™ human recombinant GLP-1 receptor cells that also overexpress a promiscuous G-protein (Millipore #HTS163C; Millipore, Billerica, MA, USA). Cell cultures were maintained in Dulbecco’s Modified Eagles Medium (DMEM) with 10% fetal calf serum (FCS), 4.0 mM L-glutamine, 1X non-essential amino acids (NEAAs), and 10.0 mM hydroxyethyl piperazineethanesulfonic acid (HEPES), and they were retained under selection using 500 µg/mL geneticin and 500 µg/mL hygromycin B. Human glucagon receptor (glucagon R) cells were obtained by clonal selection of a glucagon receptor–overexpressing cell line derived from ChemiSCREEN™ human recombinant glucagon receptor cells (Millipore #HTS112C). Cells were maintained in DMEM with 10% FCS, 1X NEAAs, and 10.0 mM HEPES, and were retained under selection using 250 µg/mL geneticin. Rat INS-1 cells19 were cotransfected with a plasmid containing a pIRESpuro3 vector (Clonetech #631619; Clonetech, Mountain View, CA) and human GLP-1R (OriGene #TC124060; OriGene, Rockville, MD) and with a plasmid encoding a cAMP-sensitive luciferase (p-GLOsensor-20F™, Promega #E1171; Promega, Madison, WI). Clones were selected based on functional expression and response to GLP-1 peptide using the GloSensor cAMP reagent (Promega #E1290). Cells were maintained in RPMI-1640 with 10% FCS, 1.0 mM sodium pyruvate, 100 U/mL penicillin, 100 µg/mL streptomycin, 50.0 µM beta-mercaptoethanol, and 10.0 mM HEPES. For the selectivity assays, Chinese hamster ovary (CHO) K1 cells were purchased from the American Type Culture Collection, and human embryonic kidney 293 (HEK293) cells overexpressing the human melanocortin 4 receptor (MC4R) were provided by Roger Cone.20
RPMI-1640 (#11875), DMEM (#11960), FCS (#16140), penicillin–streptomycin (#15140), geneticin (#10130), trypsin (#25200), hygromycin B (#1068), L-glutamine (#25030), sodium pyruvate (#11140), and HEPES (#15630) were purchased from Life Technologies (Grand Island, NY). β-mercaptoethanol (#M3148) and NEAAs (#M7145) were purchased from Sigma-Aldrich (St. Louis, MO).
Primary GLP-1RGR Calcium Screen
All assays were performed in the Vanderbilt Institute of Chemical Biology (VICB) High-Throughput Screening Facility. The chemical library screened (VICB collection) consisted of 175,488 compounds obtained from ChemDiv and Chembridge and was designed to cover a diverse range of drug-like molecules. The fluorescence-based calcium assays were performed as previously reported with a few changes.21–22 Briefly, human GLP-1R 9-3-H cells and glucagon R cells were plated in a 20 µL mixed suspension (65% and 35%, respectively) of cells at a density of 15,000 total cells per well in a 384-well plate (#781091; Greiner Bio-one, Monroe, NC) in plating medium (DMEM supplemented with 4.0 mM L-glutamine, 10% FCS, 1X NEAA, and 10.0 mM HEPES) using a Multidrop Combi (Thermofisher Scientific, Waltham, MA) and incubated overnight at 37°C and 5% CO2. Individual 384-well plates of cells were transferred to a Cytomat Automated Incubator (Thermo Fisher Scientific) on the day of screening and were processed through the primary calcium-screening assay with an integrated suite of automated instrumentation. Each screening day was monitored and systematically staggered on a time-locked scheduler using Polara Scheduling Software (Thermofisher Scientific) integrated with an ELx405CW cell washer (Bio-Tek, Winooski, VT), a Multidrop Combi, and a Functional Drug Screening System (FDSS) 6000 (Hamamatsu, Bridgewater, NJ). Plates were handled and transferred using an F-3 robotic arm (Thermofisher Scientific). Each plate was first washed on the ELx405CW and then loaded with the calcium-sensitive dye fluo-4 AM (Invitrogen, Grand Island, NY) at a final concentration of 2.0 µM. Plates were then incubated at ambient temperature for 40 min, and the dye was then removed by washing, leaving 20 µL per well of assay buffer. The cell plate was then introduced alongside a 384-well compound plate (Greiner Bio-one) containing 320 test compounds per plate and 16 wells each of both vehicle (0.3% DMSO) and 5 µM GLP-1 peptide (to measure the maximal GLP-1 signal). All compounds were assigned a unique identifier beginning with the letters VU and followed by a seven-digit number. Compounds were delivered fresh each screen day using a non-pipette-based liquid-transfer instrument, ECHO555 (Labcyte, Sunnyvale, CA) and were presented at a concentration of 10.0 µM in 0.3% DMSO at 10 s to look for agonist activity. Compounds were laid out in the plate to reside in central columns 3 through 22, leaving exterior columns 1, 2, 23, and 24 for negative and positive controls. Fluorescent measurements tracking kinetic calcium traces from three plates for three distinct additions of compound, GLP-1, and glucagon, respectively, were monitored using the FDSS6000 with 488 nm excitation and 480/540 emission filters. The first addition (20 µL of 10.0 µM library test compound) was introduced at 10 s, and monitoring continued for an additional 2 min to identify compounds with agonist activity (i.e., inducing change in fluorescence in the absence of GLP-1 and glucagon). At 2 min, half maximal effective concentration (EC50) GLP-1 (40.0 nM) was added to identify compounds that do not have any intrinsic activity but that potentiate (or inhibit) the calcium flux signaling generated by GLP-1. Finally, EC50 glucagon (40.0 nM) was added at 4 min to identify compounds that potentiate (or inhibit) a calcium flux signal in response to glucagon. Higher concentrations of GLP-1 or glucagon were not used because inducing the maximum signal might preclude detection of compounds that are ago-potentiators. Two minute intervals were sufficient for the maximum signals to return to baseline prior to the next addition. Calcium measurements were collected throughout a total of 5 min, and hits were determined in the agonist or potentiator–antagonist windows if the signal was three standard deviations higher or lower than the mean of the 320 test well population. Human recombinant peptides GLP-1 7-36 (#028-11; Phoenix Pharmaceuticals, Burlingame, CA) and glucagon (Bedford Labs glucagon hydrochloride 1.0 mg dry with 107 mg lactose; Bedford Labs, Bedford, OH) were both reconstituted into HBSS supplemented with 0.1% fatty acid–free bovine serum albumin (#A6003; Sigma) and 20.0 mM HEPES.
Confirmation and Selectivity Assays
CHO K1 cells were plated at 10,000 cells per well in DMEM Nutrient Mixture F-12. All of the cell-plate conditions were the same as described in the primary HTS assay with the following modifications. Compounds were cherry picked and presented in duplicate on each plate at a final concentration of 15.0 µM in Hank’s Balanced Salt Solution (HBSS; Life Technologies) with 20.0 mM HEPES and 1.0 mM probenecid. Each compound was retested this time individually on each cell line (GLP-1R, glucagon, or null CHO K1) using the same FDSS protocol. In the case of CHO K1, 1.0 µM ATP was added as a positive control for non-GLP-1R–non-GR calcium flux (i.e., through purinergic receptors). Controls were added in the same pattern as in the primary assay. Any compounds that showed a modified response in the ATP and CHO K1 cell plate was eliminated from further study. Compounds that displayed a modified response from the negative controls on either GLP-1R Chem9 or both GLP-1R and glucagon R Chem1 cells were selected and categorically segregated for further study.
Concentration-Response Curve (CRC) Assay
Hits from secondary screens were tested for concentration-dependent activity. Human GLP-1R 9-3-H cells and glucagon R cells were plated separately at 15,000 cells per well in a 384-well tissue culture–treated plate (#781091; Greiner Bio-one) in 20 µL plating medium (DMEM, 4.0 mM glutamine, 10% FCS, 1X NEAA, and 10.0 mM HEPES) using a multichannel pipette and incubated overnight at 37°C and 5% CO2. GLP-1R cells and glucagon R cells were tested in separate plates in an effort to clearly differentiate agonist, potentiator, and antagonist for both GLP-1 and glucagon. A triple-add protocol was used to present an 11-point concentration series of each selected compound. The cells were treated with compound followed by the addition of an EC20 concentration (20% maximal effective concentration) of peptide, and, last, an EC80 concentration of the same peptide. After each addition, the fluorescence was monitored for 2 min. Using two peptide concentrations allowed us to identify hits that are able to potentiate the effects of GLP-1 as well as inhibit (negative modulation) GLP-1 action—seen in the third addition. The increase in the EC20 peptide response at each compound concentration was plotted as percentage of maximum of the log concentration value, and the dose–response curves were fitted using a four-parameter logistic equation to achieve a sigmoidal plot and evaluate the potency at EC20 concentration of GLP-1. On each testing plate, controls were in the top row (A) and columns 1 and 24 to provide a vehicle, EC20 peptide (~10 nM), EC80 peptide (~1.0 µM), and ECMAX peptide (~5.0 µM).
Secondary GloSensor™ cAMP Screen
Because both calcium and cAMP are primary coupling modalities for GLP-1R signaling,23 hits were tested for GLP-1R potentiation by measuring cAMP accumulation in the presence of EC20 and EC80 GLP-1. The primary calcium assay was performed using a highly engineered system that may or may not be indicative of native GLP-1 signaling, and, as a result, we designed a secondary screening tier to help validate the predictive power of the primary HTS assay in a more native cell background. For the secondary assay, pancreatic INS-1 cells stably transfected with the GloSensor™ reporter plasmid were plated at 15,000 cells per well in 384-well black-wall plates (Greiner Bio-one) in 20 µL RPMI-1640 and incubated for 48 h at 37°C and 5% CO2. Two hours prior to addition of compound and GLP-1, each well received 10.0 µL of GLO reagent at 4% using the BRAVO liquid dispenser (Agilent) and returned to 37°C. The plate was then transferred to the FDSS6000 for reading. Eight minutes of baseline data were collected, followed by the addition of test compounds and luminescence readings every 3 s for 2 min. EC20 (add 2) and EC80 (add 3) concentrations of GLP-1 were added to each well, followed by another 2 min of luminescence monitoring among additions.
Data Analysis
For the primary screen, fluorescence data were analyzed with Pipeline Pilot (Accelrys, San Diego, CA) using custom protocols to identify hits on a per-plate basis. Raw data values were normalized (F/F0). Amplitudes (maximum values minus initial minimum values) for defined time regions after the first, second, and third sample additions were used to define categories for compound response (e.g., agonist, potentiatior, and antagonist). Hits were defined as three standard deviations higher or lower than the mean of the entire population of test compound-treated wells in each plate. Controls were used to obtain Z’ values24 to monitor data quality for GLP-1 and ensure the EC50 peptide values were stable throughout the screening day. Hits were then retested in the confirmation assay. Efficacy and potency values were calculated from fitting CRC data to use a four-parameter logistical equation in XLfit curve-fitting software (IDBS, Bridgewater, NJ) in Excel (Microsoft, Redmond, WA).
Results
The GLP-1RGR Calcium Assay Is Compatible with High-Throughput Screening
Validation of the GLP-1RGR mixed-cell primary assay was assessed using stimulation with GLP-1 and glucagon peptides in alternating wells of a 384-well plate to demonstrate that distinctly responding populations of signal response via calcium flux through the GPCR were robust and reproducible. A Z’ of 0.68 with a coefficient of variation less than 5%24 (Fig. 1A) was calculated using this layout for GLP-1, which indicates that the assay exhibits a suitable dynamic range and variation to distinguish significant differences among test compounds. Initial testing of these cell lines in the calcium assay was done by adding a full-concentration series of GLP-1, as depicted in Figure 1B (the first set of peaks). Clearly, GLP-1 generates a dose-dependent increase in fluorescent signal, which is correlated with an increase in intracellular calcium. Next, we use this curve to calculate an EC80 dose of GLP-1, whereas maximum doses of GLP-1 could not be further enhanced (Fig. 1B, second peak). Using this validation experiment, we calculated the EC20 (10.0 nM), EC50 (40.0 nM), and EC80 (1.0 µM) concentrations to use in subsequent experiments. In the primary screens, cells were treated with both GLP-1 and glucagon for a combined two-target, duplexed screen that, for the purposes of this discussion, offered instant simultaneous counterscreen against the glucagon receptor. Figure 1C is an example of the fluorescent traces from the FDSS6000 instrument achieved in the primary screen with vehicle (all panels), compound only (panel 1), and EC50 and ECMAX concentrations of both GLP-1 (panel 2) and glucagon (panel 3). Clearly, distinct cell populations respond to the two test concentrations of each ligand. Both GLP-1 and glucagon have dose-dependent responses in the calcium assay (Fig. 1D) with EC50 values in the nM range. This same methodology was used to validate the cAMP GloSensor™ assay, and those curves are shown in Figure 2. The GloSensor assay is more susceptible to noise and nonuniform signal, we suspect, because of high temperature sensitivities intrinsic to this assay. To address some of these issues, we measured baseline luminescence for ~8 min prior to the addition of compound or ligand (Fig. 2A) within a temperature-controlled setting of the FDSS6000.
Figure 1.

Real-time monitoring of calcium flux using coplated glucagon-like peptide 1 (GLP-1) receptor (GLP-1R)– and glucagon R-expressing cells to identify GLP-1R positive allosteric modulators (PAMs). (A) The Z’ value, indicating the separation between the signal from vehicle-treated cells and the agonist-treated cells, was calculated in the primary calcium assay based on the mean GLP-1 response and mean ± 3 standard deviations (SD) for each control population. Shown is a representative experiment in which Z’ = 0.68 ± .178. (B) To validate the primary calcium assay, a concentration-response curve of GLP-1 was added ranging from 10−10 to 10−5.4 M (first set of peaks). This allowed a determination of EC20, EC50, and ECMAX values for GLP-1 in the assay. An EC80 concentration of GLP-1 was added to each well of the GLP-1 CRC 2 min after the full CRC (second set of peaks). The EC80 was also tested to reveal antagonists and to show desensitization of the receptor at high GLP-1 concentrations. (C) A schematic showing the primary mixed-cell assay and the compound, GLP-1, and glucagon addition windows that are used to classify compounds. (D) Sigmoidal dose response of both GLP-1 and glucagon in the primary calcium assay. Error bars represent ± SD, and R2 = 0.99 for both GLP-1 and glucagon.
Figure 2.

Real-time monitoring of cyclic adenosine monophosphate (cAMP) accumulation in insulinoma (INS)-1 cells to identify glucagon-like peptide 1 (GLP-1) receptor (GLP-1R) positive allosteric modulators (PAMs). After hits were identified in the primary calcium assay, the GloSensor™ cAMP assay was used as a secondary marker to validate the effect of the hit compounds on GLP-1R. The secondary assay was also used in a more native pancreatic β-cell line and in a similar format as the primary calcium assay. To validate the cAMP assay, a concentration-response curve of GLP-1 was added ranging from 10−10 to 10−5.4 M, and the luminescent traces were recorded (A). This allowed a determination of EC20, EC50, and ECMAX values for GLP-1. (B) Sigmoidal dose response of GLP-1 in the secondary cAMP assay. Error bars represent ± standard error of the mean (SEM), and R2 = 0.97.
Workflow, Screening Tiers, Selection Criteria, and Data Summary
We used a workflow (Fig. S1) that would permit incremental and systematic refinement of results and incrementally increase the stringency of hit selection, prioritization, and classification. Ninety-eight compounds survived the screening tier and were classified as GLP-1R hits or compounds of interest (i.e., possible antagonists). These compounds were picked from the initial library based on the pass criteria in each phase of the screening workflow (Fig. S1). The initial, large-scale, primary “triple-addition” calcium screen of all compounds (Figs. S1 and S2A) yielded 1292 hits. Screening at EC50 GLP-1 (40.0 nM) allowed identification of hits that increase or decrease the GLP-1- or glucagon-induced signals, although we largely describe GLP-1R PAMs herein. If the compound increased calcium mobilization in the absence of GLP-1, it was classified as a potential agonist. If the compound modified calcium mobilization higher or lower than that of an EC50 of GLP-1 alone, it was classified as a potential potentiator or antagonist, respectively. Compounds that had agonist activity and potentiated GLP-1 activity were classified as ago-potentiators (Fig. S3).
After the initial primary screen (Fig. S2A), compound hits were picked from the entire library based on the selection criteria, new source plates were made, and the compounds were rescreened in duplicate (Fig. S1, phase 2). Compounds that failed to exhibit activity were eliminated as false positives. Next, only cells expressing the GLP-1R were used to rescreen the compounds in duplicate, and in addition, we added a second plate seeded with CHO K1 cells (Fig. S2B) to act as an untransfected control cell line to aid in identifying non-GLP-1R-specific effects on intracellular calcium dynamics (phase 3). Compounds that were active in the CHO K1 cell line were not advanced to the next phase, leaving 130 compounds. At this point, all compounds were obtained as dry samples by purchase or in-house resynthesis.
In phase 4, 130 compounds were tested in 11-point CRCs using the calcium assay. GLP-1R and glucagon R cells were plated separately. A concentration range from 10−10 M to 10−5 M of each hit compound was tested against both EC20 and EC80 concentrations of GLP-1 (Fig. S2C). At this point, we began testing EC20 and EC80 concentrations of both GLP-1 and glucagon as opposed to EC50 concentrations to begin differentiating the effects on efficacy and potency at both high and low concentrations. This approach revealed potentiators at the EC20 dose as well as any potentiation, antagonism, or desensitization at the EC80 dose. Also in phase 4, selectivity for the GLP-1R was further demonstrated by screening against a class A GPCR (MC4 receptor; data not shown). Compounds were also subjected to the secondary cAMP assay (Fig. S2D). Of the 175,488 compounds screened, 98 total hits were found to meet all the selection criteria and were ranked for potency and efficacy based on analysis of the CRC data. These compounds were divided into 11 groups based on different patterns of activity demonstrated in all the assays (i.e., calcium, glucagon R activity, cAMP, MC4 receptor activity, CHO K1 activity, and dose dependency). For brevity and focus, we show representative examples from 5 of the 11 groups.
Calcium and cAMP Screening Reveals Compounds and Scaffolds Likely to Act at the GLP-1 Receptor
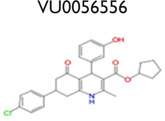
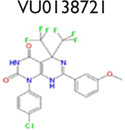
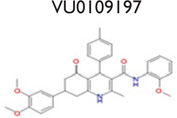
An analysis of our 175,488 compound-screening efforts revealed a total of 98 compounds that act as potential allosteric modulators for the GLP-1R. The emerging patterns of calcium mobilization in both the presence and absence of GLP-1 and glucagon directed us to classify the compounds into multiple groups (Fig. S3). For example, we have identified compounds that were classified as potentiators (VU056556, VU0089276, and VU0109197), agonists (VU0138721), and ago-potentiators (VU0143436). In addition to the 66 compounds in the 5 groups of Table 1, we have 32 more compounds that have been divided into 6 additional groups and exhibit different patterns, or “bins,” of activity in each assay used during the screening phases (data not shown). These 6 groups require further characterization. The structures shown were selected to demonstrate a common scaffold that each has unique activity and potencies ranging from 4.0 mM to 60.0 nM. Agonist VU0138721, although active in both GLP-1 and glucagon receptor cells, did not have activity in a common CHO parental-like cell line, nor in the common assay cAMP GLO MC4R cells. VU0143436, ranked most potent of all tested in CRC, interestingly has activity at all three receptors but did not show cAMP path activity at the GLP-1R (Fig. 4E).
Table 1.
Compounds from GLP-1 and Glucagon Mixed Screen Give Rise to Structures with Unique Categories, including Agonists, Potentiators, and Ago-Potentiators.
| No Activity in CHO K1 449 Compounds Tested in Duplicate Single Dose | ||||
|---|---|---|---|---|
| No Activity in MC4R | Active in MC4R | |||
| GLP-1 Selective |
GLP-1R and Glucagon R |
GLP-1R and Glucagon R |
GLP-1R and Glucagon R |
GLP-1R and Glucagon R |
| Ago-Potentiator or Potentiator |
Ago-Potentiator or Potentiator |
Agonist | Ago-Potentiator or Potentiator |
Ago-Potentiator or Potentiator |
| Calcium Flux and cAMP GloSensor™ |
Calcium Flux and cAMP GloSensor™ |
Calcium Flux and cAMP GloSensor™ |
Calcium Flux and cAMP GloSensor™ |
No activity in cAMP GloSensor™ |
| 6 compounds | 18 compounds | 2 compounds | 9 compounds | 31 compounds |
 |
 |
 |
 |
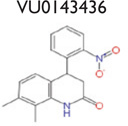 |
Figure 4.

The luminescent GloSensor™ assays with compound followed by 20% maximal effective concentration (EC20) and ECMAX glucagon-like peptide 1 (GLP-1) reveal potentiators, ago-potentiators, and agonists specific for the GLP-1 receptor (GLP-1R). Each trace represents data from step 4 for the GloSensor™ cAMP assay with GLP-1. Each graph is divided into three panels. There is no addition of compounds or ligand in panel 1. In panel 2, compound was added at the white arrow, and the signal is represented by the green trace (agonist window). In panel 3, EC20 GLP-1 was added at the black arrow to the compound (green trace), along with EC20 GLP-1 (yellow trace) and ECMAX GLP-1 (red trace) for comparison. Potentiation of the cAMP signal over that of the EC20 GLP-1 is visible in (A), (B), (C), and (E), but no potentiation is in (D).
Figures 3 and 4 show representative data for five of the most potent compounds and their fluorescent and luminescent traces from the primary calcium and secondary cAMP assays. In Figure 3, A through E represent fluorescent traces from the calcium assay in response to compound and GLP-1, and F through J represent fluorescent traces from the calcium assay in response to compound and glucagon. In Figure 4, A through E represent luminescent traces for each representative compound in the secondary cAMP assay. Figure 3A–J is each divided into three panels. At the white arrow in panel 1, the green trace represents compound only, whereas the red and yellow traces received vehicle. In panel 2, the black arrow indicates the addition of EC20 GLP-1 or glucagon. The red and yellow traces indicate no GLP-1 or glucagon and EC20 GLP-1 or glucagon, respectively, whereas the green trace contains compound with EC20 GLP-1 or glucagon. Last, the gray arrow in panel 3 indicates the addition of EC80 GLP-1 or glucagon. The red and yellow traces indicate ECMAX GLP-1 or glucagon and EC80 GLP-1 or glucagon, respectively, and the green trace again contains compound with EC80 GLP-1 or glucagon. The white, black, or gray arrows correspond to the addition times outlined in Figure S2.
Figure 3.

The fluorescent calcium assay with compound followed by 20% maximal effective concentration (EC20) and EC80 glucagon-like peptide 1 (GLP-1) or glucagon reveals potentiators, ago-potentiators, and agonists specific for the GLP-1 receptor (GLP-1R). Each trace represents data from step 4 for the calcium assay with GLP-1 (A–E) and glucagon (F–J). Representative compounds exhibit potentiation (A, VU056556; B, VU0089276; and C, VU0109197), agonism (D, VU0138721), and ago-potentiation (E, VU0143436) at the GLP-1R. Each graph is divided into three panels corresponding to the triple-add protocol. In panel 1, compound was added at the white arrow, and the signal is represented by the green trace (agonist window). In panel 2, EC20 GLP-1 or glucagon is added (black arrow), and the red and yellow traces indicate no GLP-1 or glucagon and EC20 GLP-1 or glucagon, respectively, whereas the green trace contains compound with EC20 GLP-1 or glucagon (potentiator window). In panel 3 (the ligand addition at the gray arrow), the red and yellow traces indicate ECMAX GLP-1 or glucagon and EC80 GLP-1 or glucagon, respectively, whereas the green trace again contains compound with EC80 GLP-1 or glucagon (antagonist window). In potentiation (A–C), notice the lack of signal during the compound-only phase in panel 1, then an increase in calcium with GLP-1 in panel 2 as indicated by the green trace, above the GLP-1-only signal (yellow trace). In ago-potentiation (E), the compound alone in panel 1 elicits a clear calcium response, and then potentiation is seen in panel 2 again. In agonism (D and I), the compound alone increases calcium flux, but there is no potentiation of the GLP-1 signal in panel 2. The compound depicted in (F) showed no activity at the glucagon receptor, but compounds in (G), (H), and (J) had some potentiator activity at EC20 glucagon.
The agonist activity of VU0089276, VU0138721, and VU0143436 is apparent in panel 1 of Figure 3B, Figure 3D, and Figure 3E, as the compounds alone (green trace) induce an increase in intracellular calcium. In Figure 3A–C, panel 2, the compounds exhibit clear potentiation of GLP-1 action, meaning that the calcium signal with compound followed by EC20 GLP-1 (green trace) is larger than that of EC20 GLP-1 alone (yellow trace). Cells that exhibit potentiation together with agonist activity, as in Figure 3E, are grouped as ago-potentiators. Figure 3D is an example of an agonist, because there is increased calcium with compound alone but no significant amount of potentiator activity. It is notable that compounds in Figure 3B–C (panel 3, green trace) do induce calcium flux beyond what GLP-1 will maximally induce (panel 3, red trace).
Although the presence of activity in the glucagon window was used to eliminate GLP-1R hits in the primary screen, in phase 3 of the screening, we also plated glucagon R cells to more rigorously and separately test the selectivity of these compounds as compared to GLP-1R. As shown in Figure 3G, Figure 3H, and Figure 3J, VU0089276, VU0109197, and VU0143436 all potentiate EC20 glucagon (panel 2, green trace). Most notably, VU056556 (Fig. 3F, panel 2) does not potentiate glucagon R in these studies and is marked with five others in the screen that were classified as highly selective to GLP-1R (Table 1). Similarly, VU0138721 appeared to have no potentiation of the glucagon R (Fig. 3I), although this compound was classified as an agonist only (Table 1).
Consistent with the results of the primary calcium assay, the compounds exhibit agonist, potentiation, and ago-potentiation patterns in the secondary cAMP luminescent assay (Fig. 4). This secondary assay provides a more “native” prediction of the effects of each compound as compared to the calcium flux assay. Figure 4 is also divided into three panels in a similar scheme as the calcium assay, although there was no EC80 addition in this experimental design. In Figure 4B and 4D, there is clear agonist activity after the compound addition (white arrow), with the compound-only trace (green) showing increased cAMP accumulation. In Figure 4A–C, the green trace (compound followed by EC20 GLP-1) appears to show a steady and sustainable increase in cAMP accumulation, indicating a potentiating effect on GLP-1 signaling. In Figure 4B, the compound appears to sustain intracellular cAMP higher than the maximal GLP-1 signal (red trace), an effect that was also observed in the calcium primary assay (Fig. 3B). Furthermore, these same compounds exhibited strong concentration-dependent cAMP accumulation (Fig. 5C) when treated in tandem with EC20 GLP-1.
Figure 5.

Glucagon-like peptide 1 (GLP-1) receptor (GLP-1R) allosteric modulators potentiate intracellular calcium in GLP-1R cells, glucagon R cells, and cyclic adenosine monophosphate (cAMP) accumulation in GLP-1R insulinoma (INS-1) cells. Compounds were added in triplicate in an 11-point concentration-response curve prior to adding an 20% maximal effective concentration (EC20) concentration of either GLP-1 or glucagon. Concentration-response curves of compound hits are shown (A) in the presence of EC20 GLP-1 in the calcium assay using GLP-1R cells, (B) in the presence of EC20 glucagon in the calcium assay using glucagon R cells, and (C) in the presence of EC20 GLP-1 in the secondary GloSensor™ assay using GLP-1R INS-1 cells. A sigmoidal dose–response equation was fit to the data, and potencies and efficacies were calculated for comparison (D). All compounds classified as potentiators increase the calcium and cAMP signals, as reflected in the percentage of EMAX for the respective peptide and cells. Notably, VU0089276 exhibits the greatest increase at 93% and 70% for GLP-1R and glucagon R, respectively. Each compound was more efficacious for GLP-1R than glucagon R. Error bars represent ±SEM.
GLP-1R Potentiators, Agonists, and Ago-Potentiators Are Potent and Efficacious
The five compounds in Figures 3 and 4 were analyzed for dose dependency in the concentration-response experiments of phase 4 (Fig. 5). These compounds represent some of the more potent of the hit list for inducing calcium. Like GLP-1, these compounds exhibit a concentration-response curve in the presence of EC20 GLP-1 and glucagon (Fig. 5A–C) with EC50 values ranging from 10−7.2 to 10−5.15 M in the calcium assay (Fig. 5D). Although several compounds exhibited some activity at the glucagon receptor, the hits were much more efficacious for GLP-1R when compared to glucagon R (Fig. 5D). VU056556 represents a group of six compounds that were selective for GLP-1R only, which is of particular interest to our study.
Discussion
Mixed-Cell HTS Assay Is Novel
We report here the results of a novel, mixed-cell HTS effort to identify potent, selective, small-molecular-weight agonists and PAMs of the GLP-1R. Our approach is fast, is simple, and perhaps most importantly allows identification of specific and selective allosteric modulators from a large screening library. In addition, we are able to more thoroughly understand the relationship between GLP-1R and glucagon receptor regulation, which can be extended to other GPCRs using this methodology. Our method of mixing target cells (GLP-1R) with an off-target GPCR (glucagon) was validated as suitable for screening a large compound library for GLP-1R allosteric modulators by multiple criteria. First of all, each assay exhibited GLP-1 or glucagon dose dependency, and, second, the sensitivity of both GLP-1 and glucagon ligands to potentiate intracellular calcium was demonstrated. The timeline and concentrations used (shown in Figure 1C) demonstrate a return to baseline of our controls after the GLP-1 addition that allowed the determination of a clear and distinct window for adding glucagon in the same wells. The primary calcium assay in the screening tiers was validated using the calculated Z’ factor, which established that our assay can distinguish hits, or a certain level of activity, when compared to controls. Our approach is also value added because not only are we simultaneously performing a selectivity screen with the glucagon R cells, but also we are able to identify compounds that are specific for the glucagon R, another GPCR target of therapeutic interest. This assay format could be applied easily to other GPCRs of interest.
A number of GLP1R PAMs have been previously described,25–27 although none are currently approved for human use. Modulators of GLP-1R include naturally occurring flavonoids like quercetin, which selectively modulate the receptor only with specific peptide isoforms of GLP-1, but not a related peptide oxyntomodulin or full-length GLP-1.28 Other screening efforts have identified pyrimidine-based compounds that enhance cAMP signaling and insulin secretion in in vivo models.29 These compounds demonstrated agonist activity in addition to potentiation (defined as ago-potentiation) of GLP-1 action. Another large-scale screening effort also identified a series of quinoxalines that also exhibited GLP-1R ago-potentiation.30 Interesting studies with oxyntomodulin have shown it to only partially recruit β-arrestin to the GLP-1R, but full potency was observed with respect to GLP-1R internalization, possibly demonstrating a partial and pathway-specific activation of the GLP-1R as a function of ligand structure.31 Taken as a whole, this work illustrates the feasibility to identify and develop small molecules that act as PAMs of the GLP-1R.
Our results yielded a set of 98 hit compounds that were divided into 11 subgroups based on their activity in the primary calcium assay; activity in MC4 receptor cells, CHO cells, and glucagon receptor cells; and potency and efficacy in the calcium and cAMP assays. Five of the subgroups, their definitions, and representative compounds are shown in Table 1. Although other allosteric modulators have been reported in the literature, we present data for GLP-1R PAMs showing selectivity for the GLP-1R, represented by VU056556 and five additional compounds (structures not shown).
The compounds identified by our screen target the GLP-1R and have not been previously reported. This is the first report, to our knowledge, of GLP-1R agonists or PAMs that significantly alter the potency and efficacy of GLP-1. Other attempts to identify allosteric agonists of the GLP-1R have relied on more difficult and costly methods, such as competition binding assays and radioligand-binding experiments.25,28–30,32 By counterscreening with a closely related GPCR early in the screening milieu, the chances of continuing to develop potent chemical hits that may later prove less selective for the target of interest is reduced. Like many HTS-optimized cell systems, our screening cell line is highly engineered and may not accurately reproduce “native” GLP-1R activation and coupling mechanisms. To rapidly address this issue, the secondary cAMP screen was designed to use pancreatic β-cell line INS-1 cells, and compounds that did not exhibit measureable agonist or potentiator activity in this more native cell line were able to be quickly excluded.
Allosteric Mode of Modulation?
The primary and secondary screening assays were designed with agonist, potentiator, and antagonist windows to rapidly classify each compound. Although we do not discuss GLP-1 antagonists (determined by the addition of EC80 GLP-1) in the present report, we were able to classify some compounds as antagonists based on these criteria and will follow up with these compounds in subsequent projects. Furthermore, we do not directly assess ligand-binding domains of ago-potentiators or potentiators, but our collective data would suggest that compounds that potentiate the GLP-1 signal, but have no agonist activity on their own, do so through binding to a site on the receptor that is distinct from the GLP-1 orthosteric site. Additional studies would be needed to determine whether our compounds truly occupy allosteric sites.
Assays Reveal That Modest Structural Modifications Alter Scaffold Pharmacology
A hallmark of class A and C GPCR allosteric ligands is the concept of molecular switches, wherein subtle structural modifications can result in changes in either the mode of pharmacology and/or receptor selectivity.33–34 With our discovery of class B GPCR allosteric modulators here, the phenomenon of molecular switches is now extended to this family of GPCR ligands. For example (Table 1), VU0056556 and VU0089276 are both derived from a common hexahydroquinolone carboxylate core, yet alternate substituents on the 4- and 7-aryl rings confer selective GLP-1 ago-potentiation for VU0056556, whereas VU0089276 displays ago-potentiator activity for both GLP-1 and the glucagon receptor. A structurally distinct yet topologically similar HTS hit, VU0138721, based on a tetrahydropyrimido[4,5-d]pyrmidine core, possesses agonist activity at both GLP-1 and the glucagon receptor. Importantly, all three ligands are inactive on the MC4 receptor. Although this remains an unproved possibility, these data suggest that minor modifications to these cores may enable the development of a suite of small-molecule tools to explore selective GLP-1 or dual GLP-1 and glucagon receptor activation through multiple pharmacological mechanisms.
VU00056556 and VU0109197 Are GLP-1R PAMs
As mentioned in this article, the GLP1R has a large and structurally complex orthosteric-binding site, and successful development of orally bioavailable small-molecule druglike agonists has been challenging.17 We therefore sought to identify allosteric modulators of GLP-1R, and our data suggest that at least two compounds presented here, VU00056556 and VU0109197, function as PAMs. At an EC20 concentration of GLP-1, these compounds are potent and effective at inducing calcium mobilization and cAMP accumulation within the cells at a higher level than what is induced by GLP-1 alone.
Future Directions
In summary, we have described an innovative HTS methodology for identifying agonists and positive allosteric modulators of the GLP-1R based on a primary calcium screen, a secondary cAMP screen, concentration-response testing, and selectivity testing. A key aspect of our unique HTS approach is coplating cells overexpressing our target of interest along with a cell line overexpressing an off-target GPCR, which permits a cost-effective and data-rich selectivity screen alongside the primary screen. Indeed, PAMs, NAMs, and ago-PAMs for the glucagon receptor remain viable targets for the treatment of metabolic disease, and future work in this study includes analyzing our data to identify compounds that act specifically at the glucagon receptor. Furthermore, we have validated and used this screening paradigm to evaluate a large compound library. The feasibility and cost-effectiveness of this screening method make it attractive for other GPCR targets. Future work will assess the ability of these PAMs to potentiate glucose-dependent insulin secretion together with GLP-1 in pancreatic β-cells and characterize their ability to induce signaling bias toward pathways of therapeutic interest, such as apoptotic or proliferative outcomes.
Supplementary Material
Acknowledgments
The authors would like to thank the Vanderbilt High-Throughput Screening Facility and the Vanderbilt Diabetes Research and Training Center (DRTC).
Funding
The authors disclosed receipt of the following financial support for the research, authorship, and/or publication of this article: This work was supported by resources of the Tennessee Valley Healthcare System (K.D.N.), the American Diabetes Association (K.D.N.), the Culpeper Medical Scholarship (K.D.N.), and a Vanderbilt Institute for Chemical Biology Pilot and Feasibility Grant (C.D.W.), the Vanderbilt Diabetes Research and Training Center (DK020593). L.C.M. is supported by a postdoctoral training grant (5 T32 MH093366).
Abbreviations
- GPCR
G-protein-coupled receptor
- GLP-1
glucagon-like peptide-1
- GLP-1R
glucagon-like peptide-1 receptor
- glucagon R
glucagon receptor
- HTS
high-throughput screening
- CRC
concentration-response curve
- PAM
positive allosteric modulator
Footnotes
Declaration of Conflicting Interests
The authors declared no potential conflicts of interest with respect to the research, authorship, and/or publication of this article.
Supplementary material for this article is available on the Journal of Biomolecular Screening Web site at http://jbx.sagepub.com/supplemental.
References
- 1.Holst JJ. The Physiology of Glucagon-Like Peptide 1. Physiol. Rev. 2007;87(4):1409–1439. doi: 10.1152/physrev.00034.2006. [DOI] [PubMed] [Google Scholar]
- 2.Perry CM. Liraglutide: A Review of Its Use in the Management of Type 2 Diabetes Mellitus. Drugs. 2011;71(17):2347–2373. doi: 10.2165/11208110-000000000-00000. [DOI] [PubMed] [Google Scholar]
- 3.Drucker DJ, Nauck MA. The Incretin System: Glucagon-Like Peptide-1 Receptor Agonists and Dipeptidyl Peptidase-4 Inhibitors in Type 2 Diabetes. Lancet. 2006;368(9548):1696–1705. doi: 10.1016/S0140-6736(06)69705-5. [DOI] [PubMed] [Google Scholar]
- 4.Hansen KB, Vilsboll T, Knop FK. Incretin Mimetics: A Novel Therapeutic Option for Patients with Type 2 Diabetes—a Review. Diab. Met. Synd. Obes. 2010;3:155–163. [PMC free article] [PubMed] [Google Scholar]
- 5.Edwards KL, Stapleton M, Weis J, et al. An Update in Incretin-Based Therapy: A Focus on Glucagon-Like Peptide-1 Receptor Agonists. Diab. Tech. Therap. 2012;14(10):951–967. doi: 10.1089/dia.2012.0098.edw. [DOI] [PubMed] [Google Scholar]
- 6.Garber AJ. Long-Acting Glucagon-Like Peptide 1 Receptor Agonists: A Review of Their Efficacy and Tolerability. Diab. Care. 2011;34(Suppl. 2):S279–S284. doi: 10.2337/dc11-s231. [DOI] [PMC free article] [PubMed] [Google Scholar]
- 7.Bode BW, Testa MA, Magwire M, et al. Patient-Reported Outcomes following Treatment with the Human GLP-1 Analogue Liraglutide or Glimepiride in Monotherapy: Results from a Randomized Controlled Trial in Patients with Type 2 Diabetes. Diab. Obes. Metab. 2010;12(7):604–612. doi: 10.1111/j.1463-1326.2010.01196.x. [DOI] [PMC free article] [PubMed] [Google Scholar]
- 8.Lovshin JA, Drucker DJ. Incretin-Based Therapies for Type 2 Diabetes Mellitus. Nature Rev. Endocrinol. 2009;5(5):262–269. doi: 10.1038/nrendo.2009.48. [DOI] [PubMed] [Google Scholar]
- 9.Butler PC, Elashoff M, Elashoff R, et al. A Critical Analysis of the Clinical Use of Incretin-Based Therapies: Are the GLP-1 Therapies Safe? Diab. Care. 2013;36(7):2118–2125. doi: 10.2337/dc12-2713. [DOI] [PMC free article] [PubMed] [Google Scholar]
- 10.Kenakin T, Christopoulos A. Signalling Bias in New Drug Discovery: Detection, Quantification and Therapeutic Impact. Nature Rev. Drug Disc. 2013;12(3):205–216. doi: 10.1038/nrd3954. [DOI] [PubMed] [Google Scholar]
- 11.Willard FS, Sloop KW. Physiology and Emerging Biochemistry of the Glucagon-Like Peptide-1 Receptor. Exper. Diab. Res. 2012;2012:470851. doi: 10.1155/2012/470851. [DOI] [PMC free article] [PubMed] [Google Scholar]
- 12.Montrose-Rafizadeh C, Avdonin P, Garant MJ, et al. Pancreatic Glucagon-Like Peptide-1 Receptor Couples to Multiple G Proteins and Activates Mitogen-Activated Protein Kinase Pathways in Chinese Hamster Ovary Cells. Endocrinology. 1999;140(3):1132–1140. doi: 10.1210/endo.140.3.6550. [DOI] [PubMed] [Google Scholar]
- 13.Sonoda N, Imamura T, Yoshizaki T, et al. Beta-Arrestin-1 Mediates Glucagon-Like Peptide-1 Signaling to Insulin Secretion in Cultured Pancreatic Beta Cells. Proc. Natl. Acad. Sci. USA. 2008;105(18):6614–6619. doi: 10.1073/pnas.0710402105. [DOI] [PMC free article] [PubMed] [Google Scholar]
- 14.Buteau J, Roduit R, Susini S, et al. Glucagon-Like Peptide-1 Promotes DNA Synthesis, Activates Phosphatidylinositol 3-Kinase and Increases Transcription Factor Pancreatic and Duodenal Homeobox Gene 1 (PDX-1) DNA Binding Activity in Beta (INS-1)-Cells. Diabetologia. 1999;42(7):856–864. doi: 10.1007/s001250051238. [DOI] [PubMed] [Google Scholar]
- 15.Koole C, Pabreja K, Savage EE, et al. Recent Advances in Understanding GLP-1R (Glucagon-Like Peptide-1 Receptor) Function. Biochem. Soc. Trans. 2013;41(1):172–179. doi: 10.1042/BST20120236. [DOI] [PubMed] [Google Scholar]
- 16.Selway J, Rigatti R, Storey N, et al. Evidence That Ca2+ within the Microdomain of the L-Type Voltage Gated Ca2+ Channel Activates ERK in MIN6 Cells in Response to Glucagon-Like Peptide-1. PLoS One. 2012;7(3):e33004. doi: 10.1371/journal.pone.0033004. [DOI] [PMC free article] [PubMed] [Google Scholar]
- 17.Hoare SR. Allosteric Modulators of Class B G-Protein-Coupled Receptors. Curr. Neuropharmacol. 2007;5(3):168–179. doi: 10.2174/157015907781695928. [DOI] [PMC free article] [PubMed] [Google Scholar]
- 18.Reiter E, Ahn S, Shukla AK, et al. Molecular Mechanism of Beta-Arrestin-Biased Agonism at Seven-Transmembrane Receptors. Ann. Rev. Pharmacol. Toxicol. 2012;52:179–197. doi: 10.1146/annurev.pharmtox.010909.105800. [DOI] [PMC free article] [PubMed] [Google Scholar]
- 19.Hohmeier HE, Mulder H, Chen G, et al. Isolation of INS-1-Derived Cell Lines with Robust ATP-Sensitive K+ Channel-Dependent and -Independent Glucose-Stimulated Insulin Secretion. Diabetes. 2000;49(3):424–430. doi: 10.2337/diabetes.49.3.424. [DOI] [PubMed] [Google Scholar]
- 20.Pantel J, Williams SY, Mi DH, et al. Development of a High Throughput Screen for Allosteric Modulators of Melanocortin-4 Receptor Signaling Using a Real Time cAMP Assay. Euro. J. Pharmacol. 2011;660(1):139–147. doi: 10.1016/j.ejphar.2011.01.031. [DOI] [PMC free article] [PubMed] [Google Scholar]
- 21.Noetzel MJ, Rook JM, Vinson PN, et al. Functional Impact of Allosteric Agonist Activity of Selective Positive Allosteric Modulators of Metabotropic Glutamate Receptor Subtype 5 in Regulating Central Nervous System Function. Mol. Pharmacol. 2012;81(2):120–133. doi: 10.1124/mol.111.075184. [DOI] [PMC free article] [PubMed] [Google Scholar]
- 22.Shirey JK, Xiang Z, Orton D, et al. An allosteric Potentiator of M4 mAChR Modulates Hippocampal Synaptic Transmission. Nat. Chem. Biol. 2008;4(1):42–50. doi: 10.1038/nchembio.2007.55. [DOI] [PubMed] [Google Scholar]
- 23.Doyle ME, Egan JM. Glucagon-Like Peptide-1. Recent Prog. Horm. Res. 2001;56:377–399. doi: 10.1210/rp.56.1.377. [DOI] [PubMed] [Google Scholar]
- 24.Zhang JH, Chung TD, Oldenburg KR. A Simple Statistical Parameter for Use in Evaluation and Validation of High Throughput Screening Assays. J. Biomol. Screen. 1999;4(2):67–73. doi: 10.1177/108705719900400206. [DOI] [PubMed] [Google Scholar]
- 25.Koole C, Wootten D, Simms J, et al. Allosteric Ligands of the Glucagon-Like Peptide 1 Receptor (GLP-1R) Differentially Modulate Endogenous and Exogenous Peptide Responses in a Pathway-Selective Manner: Implications for Drug Screening. Molec. Pharmacol. 2010;78(3):456–465. doi: 10.1124/mol.110.065664. [DOI] [PMC free article] [PubMed] [Google Scholar]
- 26.Eng H, Sharma R, McDonald TS, et al. Demonstration of the Innate Electrophilicity Of 4-(3-(Benzyloxy)Phenyl)-2-(Ethylsulfinyl)-6-(Trifluoromethyl)Pyrimidine (BETP), a Small Molecule Positive Allosteric Modulator of the Glucagon-Like Peptide-1 (GLP-1) Receptor. Drug Metab. Dispos. 2013;41(8):1470–1479. doi: 10.1124/dmd.113.052183. [DOI] [PubMed] [Google Scholar]
- 27.Coopman K, Huang Y, Johnston N, et al. Comparative Effects of the Endogenous Agonist Glucagon-Like Peptide-1 (GLP-1)-(7-36) Amide and the Small-Molecule Ago-Allosteric Agent “Compound 2” at the GLP-1 Receptor. J. Pharmacol. Exper. Therap. 2010;334(3):795–808. doi: 10.1124/jpet.110.166009. [DOI] [PMC free article] [PubMed] [Google Scholar]
- 28.Wootten D, Simms J, Koole C, et al. Modulation of the Glucagon-Like Peptide-1 Receptor Signaling by Naturally Occurring and Synthetic Flavonoids. J. Pharmacol. Exper. Therap. 2011;336(2):540–550. doi: 10.1124/jpet.110.176362. [DOI] [PubMed] [Google Scholar]
- 29.Sloop KW, Willard FS, Brenner MB, et al. Novel Small Molecule Glucagon-Like Peptide-1 Receptor Agonist Stimulates Insulin Secretion in Rodents and from Human Islets. Diabetes. 2010;59(12):3099–3107. doi: 10.2337/db10-0689. [DOI] [PMC free article] [PubMed] [Google Scholar]
- 30.Knudsen LB, Kiel D, Teng M, et al. Small-Molecule Agonists for the Glucagon-Like Peptide 1 Receptor. Proc. Natl. Acad. Sci. USA. 2007;104(3):937–942. doi: 10.1073/pnas.0605701104. [DOI] [PMC free article] [PubMed] [Google Scholar]
- 31.Jorgensen R, Kubale V, Vrecl M, et al. Oxyntomodulin Differentially Affects Glucagon-Like Peptide-1 Receptor Beta-Arrestin Recruitment and Signaling through Galpha(s) J. Pharmacol. Exper. Therap. 2007;322(1):148–154. doi: 10.1124/jpet.107.120006. [DOI] [PubMed] [Google Scholar]
- 32.Wootten D, Savage EE, Valant C, et al. Allosteric Modulation of Endogenous Metabolites as an Avenue for Drug Discovery. Mol. Pharmacol. 2012;82(2):281–290. doi: 10.1124/mol.112.079319. [DOI] [PubMed] [Google Scholar]
- 33.Sharma S, Kedrowski J, Rook JM, et al. Discovery of Molecular Switches That Modulate Modes of Metabotropic Glutamate Receptor Subtype 5 (mGlu5) Pharmacology in Vitro and in Vivo within a Series of Functionalized, Regioisomeric 2- and 5-(Phenylethynyl)Pyrimidines. J. Med. Chem. 2009;52(14):4103–4106. doi: 10.1021/jm900654c. [DOI] [PMC free article] [PubMed] [Google Scholar]
- 34.Wood MR, Hopkins CR, Brogan JT, et al. “Molecular switches” on mGluR allosteric ligands that modulate modes of pharmacology. Biochemistry. 2011;50(13):2403–2410. doi: 10.1021/bi200129s. [DOI] [PMC free article] [PubMed] [Google Scholar]
Associated Data
This section collects any data citations, data availability statements, or supplementary materials included in this article.