Abstract
Background
Prostate cancer is a global health issue. Usually, men with metastatic disease will progress to castration-resistant prostate cancer (CRPC). We aimed to identify the differentially expressed genes (DEGs) in tumor samples from non-castrated and castrated men from LNCaP Orthotopic xenograft models of prostate cancer and to study the mechanisms of CRPC.
Material/Methods
In this work, GSE46218 containing 4 samples from non-castrated men and 4 samples from castrated men was downloaded from Gene Expression Omnibus. We identified DEGs using limma Geoquery in R, the Robust Multi-array Average (RMA) method in Bioconductor, and Bias methods, followed by constructing an integrated regulatory network involving DEGs, miRNAs, and TFs using Cytoscape. Then, we analyzed network motifs of the integrated gene regulatory network using FANMOD. We selected regulatory modules corresponding to network motifs from the integrated regulatory network by Perl script. We preformed gene ontology (GO) and pathway enrichment analysis of DEGs in the regulatory modules using DAVID.
Results
We identified total 443 DEGs. We built an integrated regulatory network, found three motifs (motif 1, motif 2 and motif 3), and got two function modules (module 1 corresponded to motif 1, and module 2 corresponded to motif 2). Several GO terms (such as regulation of cell proliferation, positive regulation of macromolecule metabolic process, phosphorylation, and phosphorus metabolic process) and two pathways (pathway in cancer and Melanoma) were enriched. Furthermore, some significant DEGs (such as CAV1, LYN, FGFR3 and FGFR3) were related to CPRC development.
Conclusions
These genes might play important roles in the development and progression of CRPC.
MeSH Keywords: Genes, abl; Neurology; Prostatic Neoplasms
Background
Prostate cancer is a major cause of cancer-related mortality and morbidity in men worldwide [1,2]. Currently, the main treatments for the most early-stage localized disease (androgen-dependent prostate cancer, ADPC) include targeting androgen receptor (AR) signaling by using antiandrogens, such as bicalutamide, and drugs that prevent the production of androgens in the testicles and adrenal glands, such as gonadotropin-releasing hormone agonists and ketoconazole [3]. Unfortunately, despite a good initial response, remissions last on average 2–3 years, with eventual progression occurring despite castration [1]. In these cases, men with metastatic disease frequently will progress to castration-resistant prostate cancer (CRPC). Usually, the treatment of patients with CRPC remains a significant clinical challenge and account for the majority of deaths from the disease [1,2].
In patients with metastatic prostate neoplasm, bicalutamide can reduce the symptoms of tumor flare by being used in the initiation of androgen deprivation therapy [4]. Transdermal estradiol had biochemical activity and was safe in heavily pre-treated patients with chemotherapy-refractory metastatic and advanced castrate prostate cancer [5]. Vitamin D3 may affect the development of prostate cancer and its status at the beginning of treatment may synergistically improve the prognosis of prostate cancer [6]. Until recently, few reports have been published on the molecular mechanism of prostate cancer. The family of fibroblast growth factor (FGF) and fibroblast growth factor receptor (FGFR) are important in prostate organogenesis [7]. FGFs 6, 8, and 17 have been shown to be overexpressed in human prostate cancer, and FGF6 expression has also been found to be increased in prostatic intraepithelial neoplasia [8]. FGFR3 is significantly associated with a subgroup of low-grade prostate tumors, rather than being central to the pathogenesis of prostate cancer [8]. Up-regulated FGFR1 expression is associated with the transition of hormone-naive to CRPC [9]. Mutations in BRCA1 and BRCA2 are important risk factors for prostate cancer in men [10]. Caveolin-1 (Cav-1) is a downstream effector of T-mediated prostate cancer cell survival/clonal growth and modest levels of Cav-1 can independently promote prostate cancer cell survival/clonal growth and metastatic activities [11]. However, the molecular mechanisms leading to the development of and progression to CRPC are still not clearly understood.
In this study, we aimed to identify the differentially expressed genes (DEGs) in tumor samples from non-castrated and castrated men from LNCaP Orthotopic xenograft models of prostate cancer and to study the mechanisms of CRPC. An integrated regulatory network to investigate the critical DEGs in the progression was built. Then, network motifs of the integrated gene regulatory network were analyzed using FANMOD. Regulatory modules corresponding to network motifs from the integrated regulatory network were selected by Perl script. The database for annotation, visualization, and integrated discovery (DAVID) was used for identifying the over-represented gene ontology (GO) categories in biological processes and the significant pathways.
Material and Methods
Affymetrix microarray data
The gene expression profile data GSE46218 (http://www.ncbi.nlm.nih.gov/geo/query/acc.cgi?acc=GSE46218) was downloaded from Gene expression omnibus (GEO) of the National Center for Biotechnology Information (NCBI). GSE46218 was based on GPL570 [HG-U133_Plus_2] Affymetrix Human Genome U133 Plus 2.0 Array. A total of 8 chips were available for further analysis, including 4 samples from non-castrated men (GSM1126521, GSM1126522, GSM1126523, and GSM1126524) and 4 samples from castrated men (GSM1126525, GSM1126526, GSM1126527, and GSM1126528) from the LNCaP Orthotopic xenograft models of prostate cancer.
Data preprocessing
For the GSE46218 dataset, the limma Geoquery in R (v.2.15.3) was used for the analysis of the DEGs. The original expression datasets from all conditions were processed into expression estimates using the Robust Multi-array Average (RMA) method with the default settings implemented in Bioconductor, and then the linear model was constructed. Finally, multiple test correction was performed by Bias methods. The |logFC| >1.5 and the p-value <0.05 were chosen as cut-off criteria.
Construction of an integrated regulatory network
The MicroRNAs (miRNAs) and transcriptional factors (TFs) involving DEGs between ADPC and CRPC were selected from an integrated miRNA database of miRecords [12], TarBase [13], StarBase [14] and miRDisease [15] and a transcriptional regulatory element database (TRED) [16], respectively. Cytoscape is a general-purpose modeling environment for integrating biomolecular interaction networks and states, especially when used in conjunction with large databases of protein–protein, protein–DNA, and genetic interactions [17]. An integrated regulatory network was built using Cytoscape.
Analysis of network motifs
FANMOD was used for the analysis of network motifs of the integrated gene regulatory network. A p-value less than 0.05 and Z-score larger than 1.5 were chosen as cut-off criteria.
Gene ontology and pathway enrichment analysis
The regulatory modules corresponding to network motifs were selected from the integrated regulatory network by Perl script. DAVID, which that consists of an integrated biological knowledgebase and analytic tools, is useful for researchers to understand the biological meanings from a large list of genes or proteins [18]. For functional annotation of genes in the interaction network, we identified the over-represented gene ontology (GO) categories in biological processes by DAVID with the p-value <0.05 and count >2. In addition, DAVID was also applied for identifying the significant pathways using cut-off criteria of p-value <0.05 and count >2.
Results
DEGs analysis between ADPC and CRPC
To identify the DEGs between ADPC and CRPC patients, we obtained publicly available microarray dataset GSE46218 from GEO database. The analysis of DEGs was achieved by the limma Geoquery method. Finally, a total of 443 genes were considered significantly differentially expressed with p-value <0.05.
An integrated regulatory network for DEGs
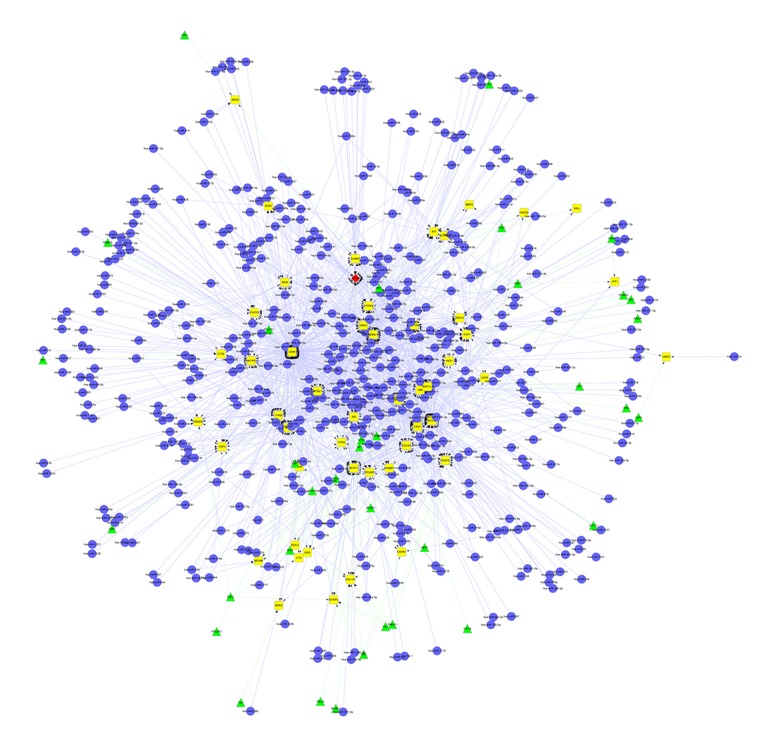
The miRNAs represent an important class of small non-coding RNAs capable of regulating expression of other genes by targeting messenger RNAs [12]. DEGs-related miRNAs were screened by an integrated miRNA database of miRecords, TarBase, StarBase and miRDisease [12–15]. TFs and many of their target genes are involved in gene regulation at the level of transcription [16]. In this study, DEGs-related TFs were screened using TRED, which contains comprehensive transcriptional regulatory elements for gene regulation and function studies [16]. Finally, an integrated regulatory network involving both miRNAs and TFs (miRNAs-DEGs-TFs) was built using Cytoscape, as shown in Figure 1.
Figure 1.
An integrated regulatory network: miRNAs-DEGs-TFs. There are 612 nodes and 1758 edges in the network. (Yellow diamonds represent DEGs; blue dots represent miRNAs; green triangles represent TFs; red rhombus represents a differentially expressed gene as well as a transcriptional factor).
Regulatory network motifs
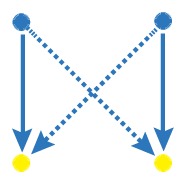
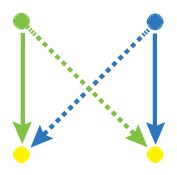
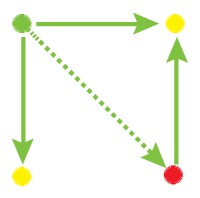
Network motif is an important local property for researchers to identify functional units in the networks, which is usually detected by FANMOD [19]. To facilitate the detection of larger motifs in an integrated gene regulatory network, FANMOD was used for the analysis of network motifs. In this work, three motifs (motif 1, motif 2 and motif 3) were found with p-value <0.05 and Z-score >1.5 (Table 1). Motifs 1–3 represented the DEGs under the control of miRNA and miRNA as well as TFs and TFs, respectively.
Table 1.
The regulatory network motifs built in the work. (Blue dots represent miRNA; yellow dots represent DEGs; green dots represent transcriptional factors; red dot represents a differentially expressed gene as well as a transcriptional factor; edges represent regulatory effect, and arrows represent regulation orientation.)
| Name | Motif | Z-Score | p-Value |
|---|---|---|---|
| motif 1 |
|
3.0684 | 0.003 |
| motif 2 |
|
1.8465 | 0.048 |
| motif 3 |
|
1.5928 | 0.031 |
Construction of function modules
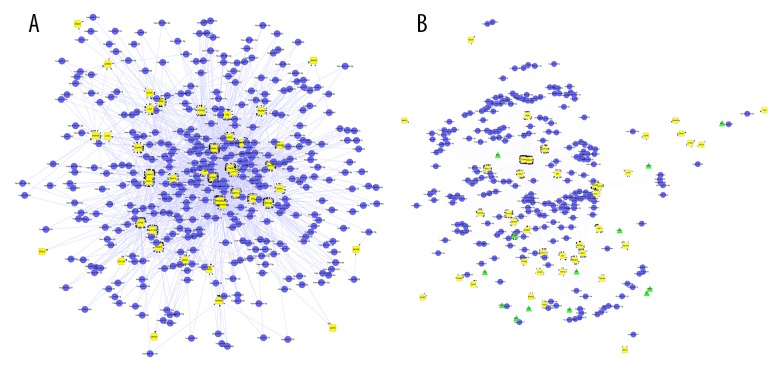
In the work, Perl programming language was used to screen function modules corresponding to network motifs. After screening, we got two function modules, as shown in Figure 2. Module 1 corresponded to motif 1, containing 417 nodes and 1474 edges. Module 2 corresponded to motif 2, containing 288 nodes and 903 edges.
Figure 2.
The function modules built in the study: (A) Module 1 corresponded to motif 1; (B) Module 2 corresponded to motif 2. (Yellow diamonds represent DEGs; blue dots represent miRNAs; green triangles represent TFs).
GO enrichment analysis of the interaction network
GO analysis is a commonly used approach for functional analysis of large-scale genomic or transcriptomic data [20]. To investigate the function changes between CRPC and ADPC, we used the online tool DAVID to identify over-represented GO categories in biological process with p-value less than 0.05 and count larger than 2 as threshold. Several GO categories were enriched among these genes in the regulatory network. In Table 2 we list the top 10 GO molecular function categories. Two GO terms were enriched significantly among the DEGs in the network, including “regulation of cell proliferation” and “positive regulation of macromolecule metabolic process” (Table 2). Moreover, many enriched GO terms of DEGs were related to “phosphorylation”, “phosphorus metabolic process”, and “phosphate metabolic process”, as shown in Table 2. The other common GO terms were “response to abiotic stimulus”, “positive regulation of cell proliferation”, and “regulation of cell development”. It was also shown that many DEGs were related to CRPC development, such as CAV1, LYN, FGFR3, and FGF2 (Table 2).
Table 2.
Classification of DEGs between uncastrasion and castration samples according to GO terms with p-value <0.05. (A) GO enrichment results of module 1 (Top 10). (B) GO enrichment results of module 2 (Top 10).
| A | |||
|---|---|---|---|
| GO description | Count | p-Value | DEGs |
| Regulation of cell proliferation | 14 | 3.05E-07 | CAV1,FGR3, LYN, SOX2,NF1, NAP1L1,EGN3, GJA1, CDK6, KIT, HES1, CDKN2C, PDGFC, FGF2 |
| Positive regulation of macromolecule metabolic process | 11 | 1.83E-04 | HES1, CAV1, LYN, THRB, ETS2, SOX2, NR4A2, GJA1, PDGFC, KIT, FGF2 |
| Response to abiotic stimulus | 10 | 1.20E-06 | CAV1, SLC12A2, LYN, NF1, SOX2, GJA1, ERO1L, KIT, COL1A1, SNAI2 |
| Positive regulation of cell proliferation | 9 | 2.83E-05 | HES1, FGFR3, LYN, SOX2, NAP1L1, CDK6, PDGFC, KIT, FGF2 |
| Regulation of phosphorylation | 7 | 0.002613 | CAV1, LYN, CDKN2C, NF1, PDGFC, KIT, FGF2 |
| Regulation of phosphorus metabolic process | 7 | 0.003187 | CAV1, LYN, CDKN2C, NF1, PDGFC, KIT, FGF2 |
| Regulation of phosphate metabolic process | 7 | 0.003187 | CAV1, LYN, CDKN2C, NF1, PDGFC, KIT, FGF2 |
| Regulation of nervous system development | 6 | 2.71E-04 | HES1, LYN, NF1, SOX2, KIT, FGF2 |
| Regulation of cell development | 6 | 3.66E-04 | HES1, LYN, NF1, SOX2, KIT, FGF2 |
| Negative regulation of cell differentiation | 6 | 4.65E-04 | HES1, CAV1, NF1, SOX2, CDK6, KIT |
| B | |||
|---|---|---|---|
| GO description | Count | p-Value | DEGs |
| Regulation of cell proliferation | 15 | 2.55E-08 | BMP4, CAV1,FGFR3, LYN, SOX2, NF1, NAP1L1, GJA1, CDK6, KIT, HES1, CDKN2C, PDGFC, IGFBP3, FGF2 |
| Positive regulation of macromolecule metabolic process | 11 | 1.46E-04 | HES1, BMP4, CAV1, LYN, ETS2, SOX2, NR4A2, GJA1, PDGFC, KIT, FGF2 |
| Positive regulation of cell proliferation | 10 | 2.54E-06 | HES1, BMP4, FGFR3, LYN, SOX2, NAP1L1, CDK6, PDGFC, KIT, FGF2 |
| Response to abiotic stimulus | 9 | 9.97E-06 | BMP4, CAV1, SLC12A2, LYN, NF1, SOX2, GJA1, KIT, COL1A1 |
| Regulation of phosphorylation | 9 | 5.44E-05 | BMP4, CAV1, LYN, CDKN2C, NF1, PDGFC, KIT, IGFBP3, FGF2 |
| Regulation of phosphate metabolic process | 9 | 7.20E-05 | BMP4, CAV1, LYN, CDKN2C, NF1, PDGFC, KIT, IGFBP3, FGF2 |
| Regulation of phosphorus metabolic process | 9 | 7.20E-05 | BMP4, CAV1, LYN, CDKN2C, NF1, PDGFC, KIT, IGFBP3, FGF2 |
| Regulation of cell development | 8 | 2.02E-06 | HES1, BMP4, LYN, NF1, SOX2, KIT, IGFBP3, FGF2 |
| Negative regulation of cell proliferation | 8 | 7.93E-05 | BMP4, CAV1, CDKN2C, NF1, GJA1, CDK6, IGFBP3, FGF2 |
| Regulation of nervous system development | 7 | 1.94E-05 | HES1, BMP4, LYN, NF1, SOX2, KIT, FGF2 |
Pathway enrichment analysis of the interaction network
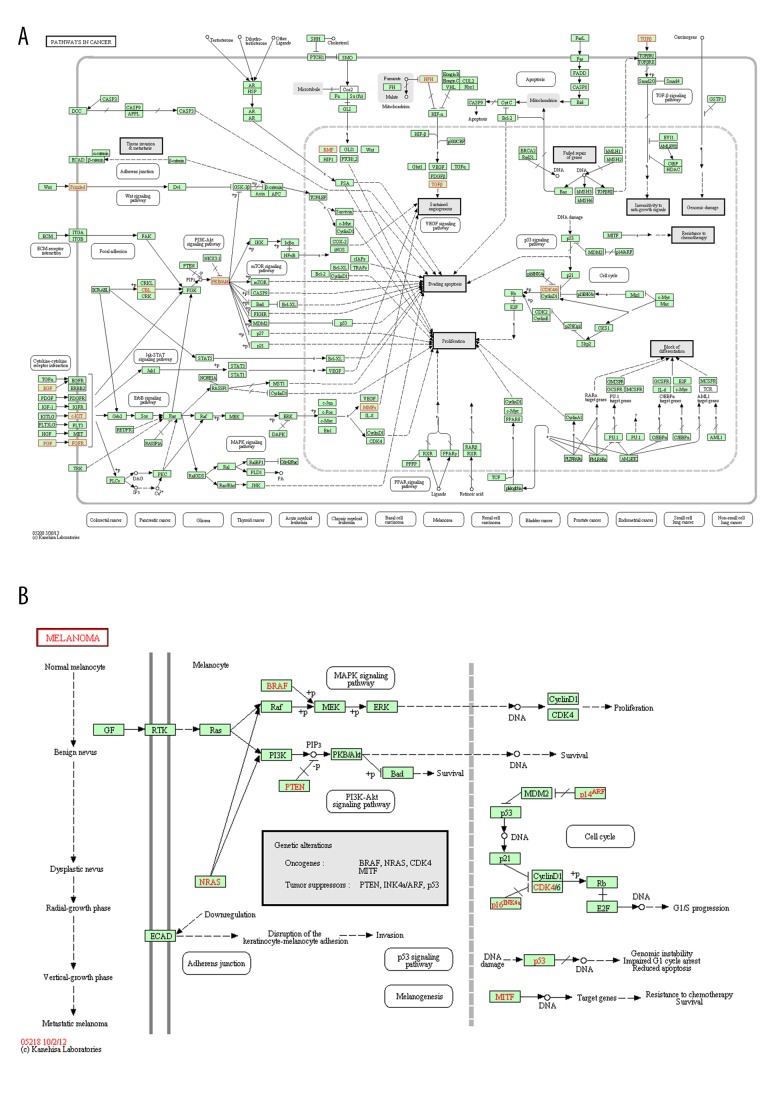
To gain further insights into the function of genes in the interaction network, we used DAVID to analyze the pathway enrichment. The results indicated that the most significant enrichment pathways were hsa05200 (pathway in cancer) and hsa05218 (Melanoma), as shown in Figure 3 (p-value <0.05). Two DEGs of FGFR3 and FGF2 that were associated with enriched GO terms were also found in the enriched pathway hsa05200 (Figure 3).
Figure 3.
The pathway enrichment results: (A) hsa05200 (pathway in cancer); (B) hsa05218 (melanoma).
Discussion
Although most men who develop ADPC do not die from their disease, those who develop CRPC have a poor prognosis and are more likely to die from complications of metastatic disease [1]. Understanding the molecular mechanisms of the progression from ADPC to CPRC can facilitate the selection of an appropriate treatment strategy and develop new treatments for CRPC [21]. In the present work, the gene expression profile downloaded from GEO was used for exploring the mechanism of CPRC development. A total of 443 genes were identified as differentially expressed between samples from non-castrated and castrated men. Moreover, an integrated regulatory network was built to investigate the critical DEGs in the progression. Furthermore, several GO terms and two enriched pathways were found using DAVID.
Prostate cancer that progresses to a castrate-resistant phenotype has a poor prognosis. CRPC is thought to develop because of selection pressures by androgen ablation therapies that induce altered expression and activation of many involved proteins [22]. In this study, it was found that many significant DEGs were related to CRPC development, such as CAV1 (encode Cav-1), LYN (encode Lyn), FGFR3 (encode FGFR3), and FGF2 (encode FGF2) (Table 2 and Figure 3).
Cav-1 is a co-regulator of AR that is involved in the development and maintenance of the normal prostate and the development and progression of prostate cancer [22]. A direct interaction between AR and Cav-1 has been demonstrated using the LNCaP prostate cancer cell lines in the presence of androgen [23]. The expression and prevalence of Cav-1 is up-regulated by and are linked with increased AR activity in prostate cancer progression [22,23]. Moreover, GO enrichment showed that Cav-1 was related to many biological processes such as “regulation of cell proliferation”, “positive regulation of macromolecule metabolic process”, and “regulation of phosphorylation”. It has been hypothesized that knockdown of Cav-1 might revert CRPC cells to an androgen-sensitive phenotype. Furthermore, function module construction revealed that CAV1 was regulated by miRNA-548d and miRNA-let7d and transcription factor SP1. As described previously, miRNA-548d is identified as a potential superior regulator for the progression of prostate cancer [24]. The miRNA-let7 family has been detected in various cancers [25]. Sp1 regulates a variety of cancer associated genes that are involved in cell cycle, proliferation, cell differentiation, and apoptosis [26]. These results further highlight the importance of Cav-1 in prostate cancer.
GO enrichment indicated that the LYN gene was related to many biological processes such as “cell proliferation”, “response to abiotic stimulus”, and “regulation of phosphorylation”. It has been suggested that Lyn is involved in the control of cellular proliferation, which can lead to cellular transformation and is associated with tumor maintenance and progression [27]. Membrane-associated CD19-LYN complex is an Bc1-2-independent and p53-independent regulator of apoptosis in human B-lineage lymphoma cells [28]. These further findings further demonstrate the importance of LYN in prostate cancer.
Genes FGFR3 (encode FGFR3) and FGF2 (encode FGF2) were associated with enriched GO terms and the enrichment pathway hsa05200 (pathway in cancer) (Table 2 and Figure 3). As described previously, mutation analysis of exons 7, 10, and 15 of FGFR3 revealed 9 mutations in the 112 prostate tumors studied (8%) [8]. These mutations might change the expression level or the structure of FGFR3 in prostate tumors. Thus, molecular changes could occur in prostate cancer. Moreover, FGFR3 can also crosstalk with other receptor tyrosine kinases such as FGFR1, whose up-regulation is associated with the transition of hormone-naive to CRPC [9]. FGFs play an important role in the growth and maintenance of the normal prostate. Alterations in FGF signaling regulators have an impact on tumorigenesis in prostate cancer by mediating stromal – epithelial interactions [29]. FGFR1 is the receptor of FGF2, and their interactions may play an important role in prostate cancer progression to CRPC [9]. Furthermore, the function modules indicated that both FGFR3 and FGF2 were regulated by the transcription factor Egr1, which is overexpressed in most aggressive tumorigenic prostate cancer cells [30], further confirming the importance of FGFR3 and FGF2 in the progression of CRPC.
Conclusions
In conclusion, our results provide a comprehensive bioinformatics analysis of genes and pathways that may be involved in the progression of CRPC. A total of 443 DEGs were identified between samples from non-castrated and castrated men. Four DEGs of CAV1, LYN, FGFR3, and FGF2 may play important roles in the development and progression of CPRC. However, as none of these genes were tested by experiments, further analyses are imperative to unravel their mechanism in the process of malignant progression in prostate cancer. In the future, we will perform PCR or Western blot to check the expression levels of these genes in samples from non-castrated and castrated men.
Footnotes
Conflict of Interest
None.
Source of support: This study was supported by grant from Dongfang Zhaoyang Talent Plan (DFZY-3)
References
- 1.Amaral TM, Macedo D, Fernandes I, Costa L. Castration-resistant prostate cancer: mechanisms, targets, and treatment. Prostate Cancer. 2012;2012:1–12. doi: 10.1155/2012/327253. [DOI] [PMC free article] [PubMed] [Google Scholar]
- 2.Shen MM, Abate-Shen C. Molecular genetics of prostate cancer: new prospects for old challenges. Genes Dev. 2010;24:1967–2000. doi: 10.1101/gad.1965810. [DOI] [PMC free article] [PubMed] [Google Scholar]
- 3.Dahlman KB, Parker JS, Shamu T, et al. Modulators of prostate cancer cell proliferation and viability identified by short-hairpin RNA library screening. PLoS One. 2012;7:405–14. doi: 10.1371/journal.pone.0034414. [DOI] [PMC free article] [PubMed] [Google Scholar]
- 4.Hussain S, Haidar A, Bloom RE, et al. Bicalutamide-induced hepatotoxicity: A rare adverse effect. Am J Case Rep. 2014;15:266–70. doi: 10.12659/AJCR.890679. [DOI] [PMC free article] [PubMed] [Google Scholar]
- 5.Stein M, Goodin S, Doyle-Lindrud S, et al. Transdermal estradiol in castrate and chemotherapy resistant prostate cancer. Med Sci Monit. 2012;18(4):CR260–64. doi: 10.12659/MSM.882626. [DOI] [PMC free article] [PubMed] [Google Scholar]
- 6.Ho A, Gabriel A, Bhatnagar A, et al. Seasonality pattern of breast, colorectal, and prostate cancer is dependent on latitude. Med Sci Monit. 2015;21:818–24. doi: 10.12659/MSM.890062. [DOI] [PMC free article] [PubMed] [Google Scholar]
- 7.Dunham-Ems SM, Pudavar HE, Myers JM, et al. Factors controlling fibroblast growth factor receptor-1’s cytoplasmic trafficking and its regulation as revealed by FRAP analysis. Mol Biol Cell. 2006;17:2223–35. doi: 10.1091/mbc.E05-08-0749. [DOI] [PMC free article] [PubMed] [Google Scholar]
- 8.Hernandez S, De Muga S, Agell L, et al. FGFR3 mutations in prostate cancer: association with low-grade tumors. Mod Pathol. 2009;22:848–56. doi: 10.1038/modpathol.2009.46. [DOI] [PubMed] [Google Scholar]
- 9.Armstrong K, Ahmad I, Kalna G, et al. Upregulated FGFR1 expression is associated with the transition of hormone-naive to castrate-resistant prostate cancer. Br J Cancer. 2011;105:1362–69. doi: 10.1038/bjc.2011.367. [DOI] [PMC free article] [PubMed] [Google Scholar]
- 10.Struewing JP, Hartge P, Wacholder S, et al. The risk of cancer associated with specific mutations of BRCA1 and BRCA2 among Ashkenazi Jews. N Engl J Med. 1997;336:1401–8. doi: 10.1056/NEJM199705153362001. [DOI] [PubMed] [Google Scholar]
- 11.Li L, Yang G, Ebara S, et al. Caveolin-1 mediates testosterone-stimulated survival/clonal growth and promotes metastatic activities in prostate cancer cells. Cancer Res. 2001;61:4386–92. [PubMed] [Google Scholar]
- 12.Xiao F, Zuo Z, Cai G, et al. miRecords: an integrated resource for microRNA-target interactions. Nucleic Acids Res. 2009;37:105–10. doi: 10.1093/nar/gkn851. [DOI] [PMC free article] [PubMed] [Google Scholar]
- 13.Sethupathy P, Corda B, Hatzigeorgiou AG. TarBase: A comprehensive database of experimentally supported animal microRNA targets. RNA. 2006;12:192–97. doi: 10.1261/rna.2239606. [DOI] [PMC free article] [PubMed] [Google Scholar]
- 14.Yang JH, Li JH, Shao P, et al. starBase: a database for exploring microRNA-mRNA interaction maps from Argonaute CLIP-Seq and Degradome-Seq data. Nucleic Acids Res. 2011;39:D202–9. doi: 10.1093/nar/gkq1056. [DOI] [PMC free article] [PubMed] [Google Scholar]
- 15.Jiang Q, Wang Y, Hao Y, et al. miR2Disease: a manually curated database for microRNA deregulation in human disease. Nucleic Acids Res. 2009;37:98–104. doi: 10.1093/nar/gkn714. [DOI] [PMC free article] [PubMed] [Google Scholar]
- 16.Jiang C, Xuan Z, Zhao F, Zhang MQ. TRED: a transcriptional regulatory element database, new entries and other development. Nucleic Acids Res. 2007;35:137–40. doi: 10.1093/nar/gkl1041. [DOI] [PMC free article] [PubMed] [Google Scholar]
- 17.Shannon P, Markiel A, Ozier O, et al. Cytoscape: a software environment for integrated models of biomolecular interaction networks. Genome Res. 2003;13:498–504. doi: 10.1101/gr.1239303. [DOI] [PMC free article] [PubMed] [Google Scholar]
- 18.Da Wei Huang BTS, Lempicki RA. Systematic and integrative analysis of large gene lists using DAVID bioinformatics resources. Nat Protoc. 2008;4:44–57. doi: 10.1038/nprot.2008.211. [DOI] [PubMed] [Google Scholar]
- 19.Wernicke S, Rasche F. FANMOD: a tool for fast network motif detection. Bioinformatics. 2006;22:1152–53. doi: 10.1093/bioinformatics/btl038. [DOI] [PubMed] [Google Scholar]
- 20.Hulsegge I, Kommadath A, Smits MA. Globaltest and GOEAST: two different approaches for Gene Ontology analysis. BMC Proc. 2009;3(Suppl 4):S10. doi: 10.1186/1753-6561-3-S4-S10. [DOI] [PMC free article] [PubMed] [Google Scholar]
- 21.Shore N, Mason M, De Reijke TM. New developments in castrate-resistant prostate cancer. BJU Int. 2012;109(Suppl 6):22–32. doi: 10.1111/j.1464-410X.2012.11217.x. [DOI] [PubMed] [Google Scholar]
- 22.Bennett N, Hooper JD, Lee CS, Gobe GC. Androgen receptor and caveolin-1 in prostate cancer. IUBMB Life. 2009;61:961–70. doi: 10.1002/iub.244. [DOI] [PubMed] [Google Scholar]
- 23.Lu ML, Schneider MC, Zheng Y, et al. Caveolin-1 interacts with androgen receptor A positive modulator of androgen receptor mediated transactivation. J Biol Chem. 2001;276:13442–51. doi: 10.1074/jbc.M006598200. [DOI] [PubMed] [Google Scholar]
- 24.Heyn H, Schreek S, Buurman R, et al. MicroRNA miR-548d is a superior regulator in pancreatic cancer. Pancreas. 2012;41:218–21. doi: 10.1097/MPA.0b013e318224b701. [DOI] [PubMed] [Google Scholar]
- 25.Porkka KP, Pfeiffer MJ, Waltering KK, et al. MicroRNA expression profiling in prostate cancer. Cancer Res. 2007;67:6130–35. doi: 10.1158/0008-5472.CAN-07-0533. [DOI] [PubMed] [Google Scholar]
- 26.Sankpal UT, Goodison S, Abdelrahim M, Basha R. Targeting SP1 transcription factor in prostate cancer therapy. Med Chem. 2011;7:518–25. doi: 10.2174/157340611796799203. [DOI] [PubMed] [Google Scholar]
- 27.Goldenberg-Furmanov M, Stein I, Pikarsky E, et al. Lyn Is a Target Gene for Prostate Cancer: Sequence-Based Inhibition Induces Regression of Human Tumor Xenografts. Cancer Res. 2004;64:1058–66. doi: 10.1158/0008-5472.can-03-2420. [DOI] [PubMed] [Google Scholar]
- 28.Myers DE, Jun X, Waddick KG, et al. Membrane-associated CD19-LYN complex is an endogenous p53-independent and Bc1-2-independent regulator of apoptosis in human B-lineage lymphoma cells. Proc Natl Acad Sci USA. 1995;92:9575–79. doi: 10.1073/pnas.92.21.9575. [DOI] [PMC free article] [PubMed] [Google Scholar]
- 29.Giri D, Ropiquet F, Ittmann M. Alterations in expression of basic fibroblast growth factor (FGF) 2 and its receptor FGFR-1 in human prostate cancer. Clin Cancer Res. 1999;5:1063–71. [PubMed] [Google Scholar]
- 30.Virolle T, Krones-Herzig A, Baron V, et al. Egr1 promotes growth and survival of prostate cancer cells. Identification of novel Egr1 target genes. J Biol Chem. 2003;278:11802–10. doi: 10.1074/jbc.M210279200. [DOI] [PubMed] [Google Scholar]


