Abstract
apoE is a multi-functional protein expressed in several cell types and in several organs. It is highly expressed in adipose tissue, where it is important for modulating adipocyte lipid flux and gene expression in isolated adipocytes. In order to investigate a potential systemic role for apoE that is produced in adipose tissue, mice were generated with selective suppression of adipose tissue apoE expression and normal circulating apoE levels. These mice had less adipose tissue with smaller adipocytes containing fewer lipids, but no change in adipocyte number compared with control mice. Adipocyte TG synthesis in the presence of apoE-containing VLDL was markedly impaired. Adipocyte caveolin and leptin gene expression were reduced, but adiponectin, PGC-1, and CPT-1 gene expression were increased. Mice with selective suppression of adipose tissue apoE had lower fasting lipid, insulin, and glucose levels, and glucose and insulin tolerance tests were consistent with increased insulin sensitivity. Lipid storage in muscle, heart, and liver was significantly reduced. Adipose tissue macrophage inflammatory activation was markedly diminished with suppression of adipose tissue apoE expression. Our results establish a novel effect of adipose tissue apoE expression, distinct from circulating apoE, on systemic substrate metabolism and adipose tissue inflammatory state.
Keywords: apolipoproteins, insulin resistance, obesity, lipid metabolism, apolipoprotein E
ApoE is a multifunctional protein that is expressed in a large number of cell types and in several organs. Circulating apoE is predominantly derived from the liver, which accounts for at least 90% of the circulating apoE (1). Other cells that are capable of synthesizing apoE include macrophages, astrocytes, and endocrine cells such as adrenal and ovarian cells (2–4). In addition, adipocytes have the capacity to synthesize significant amounts of apoE, as first reported by Zechner et al. (5). Adipocyte expression of apoE modulates adipocyte TG turnover, gene expression, and VLDL metabolism (6–8) in an isoform-dependent manner (9). Further, adipocyte expression of apoE is subject to regulation by a number of physiologically relevant stimuli such as organismal nutritional status (10), inflammatory cytokines (11), and adipose tissue oxidative stress (12, 13).
Global knockout of apoE in mice results in massive hypercholesterolemia and accelerated atherosclerosis. Both of these can be attenuated by bone marrow transplantation furnishing macrophages synthesizing apoE (14, 15). Similar observations have been made in Apoe−/− animals transgenically expressing low levels of adrenal apoE (16, 17). On the other hand, we have recently shown that wild-type adipose tissue transplanted into Apoe−/− mice achieves a plasma level of apoE similar to bone marrow transplantation (about 1% of normal), yet is unable to suppress the hypercholesterolemia and atherosclerosis of the Apoe−/− mouse (18). While the reasons for the lack of impact of adipose-derived apoE on circulating lipid levels remains to be determined, it is clear that apoE produced by adipocytes is critically important for maintaining adipocyte differentiated function (6–9, 19).
Animals globally deficient in apoE are not readily rendered obese by the feeding of obesogenic diets (20). Adipocytes isolated from Apoe−/− mice are smaller, store fewer lipids, and acquire lipids from extracellular VLDL less efficiently than wild-type adipocytes (6–8). ApoE-deficient adipocytes also have lower TG synthetic rates, and an increased TG hydrolysis rate (6–8). The culture of apoE-deficient adipocytes in media containing exogenous apoE-rich VLDL does not reverse the disturbances of adipocyte lipid homeostasis, but viral-mediated induction of endogenous adipocyte apoE expression does restore a more normal adipocyte phenotype (6). Consistent with this, apoE-deficient adipose tissue and adipocytes retain an abnormal phenotype after transplantation into wild-type hosts, where they are exposed to normal circulating extracellular levels of apoE (7).
While study of isolated adipocytes and transplanted adipose tissue points to the critical importance of endogenous adipocyte apoE for adipocyte lipid metabolism and gene expression, it does not provide information regarding potential changes in whole body energy homeostasis that might occur as a result of either altered lipid flux through adipose tissue or changes in adipokine gene expression that occur with reduced adipose tissue apoE expression (6–8). Further, interpretation of results of experiments using adipose tissue transplanted between wild-type mice and globally deficient apoE mice are confounded by the exposure of adipose tissue to a markedly hyperlipidemic in vivo environment, either before or after transplantation (18). Obtaining additional insight into the function of apoE expressed in adipose tissue is best approached by the selective suppression of apoE expression in adipocytes/adipose tissue, with preserved expression in other tissues, particularly the liver, which accounts for over 90% of circulating apoE (1). In the current study, we report results of experiments employing a new mouse model with selective suppression of adipocyte and adipose tissue apoE with normal circulating levels of apoE
METHODS
Materials
Cell culture medium and FBS were purchased from Invitrogen (Carlsbad, CA). Organic solvents were from Thermo-Fisher (Pittsburgh, PA). Other chemicals were from Sigma (St. Louis, MO). [14C]glucose was obtained from PerkinElmer (Wellesley, MA). Total cholesterol (TC) and TG assay kits were obtained from Wako Chemicals USA (Richmond, VA). Mouse insulin ELISA kits were purchased from ALPCO Diagnostics (Salem, NH). Blood glucose was measured by Alpha TRACK glucometer (Abbott, Abbott Park, IL) or Infinity glucose hexokinase (Thermo Fisher, Waltham, MA). Other reagents were from previously identified sources (6–13, 18). The homeostatic model assessment of insulin resistance (HOMA-IR) was calculated from fasting glucose and insulin levels as previously described (21).
Generation of selective adipose tissue apoE knockout mice
Selective adipose tissue Apoe knockout (SEKO) mice were generated in two major steps. First, Apoe exon 3 was flanked with 2 loxP sites in 129/SvEv mice. Apoe “floxed” mice were then intensively bred (10 times) with wild-type C57BL/6J mice (Jackson Lab, Bar Harbor, ME) to obtain a C57BL/6 background. Second, aP2-Cre transgenic mice [B6.Cg-Tg (Fabp4-Cre 1Rev/J), C57BL/6 background, Jackson Lab] were crossed with Apoe floxed homozygous mice (Apoeflox/flox). aP2-Cre Apoeflox/+ offspring were crossed again with Apoeflox/flox to obtain aP2-Cre Apoeflox/flox mice that are referred to as SEKO mice. Mouse genotype was confirmed by PCR using both Apoe flox and Cre primer sets. SEKO mice were born with the expected Mendelian frequency. Apoeflox/+ or Apoe+/+, with or without aP2-Cre, had similar metabolic characteristics and were used as control mice. Mice were housed under pathogen-free conditions, controlled light-dark cycle (12 h/12 h), and free access to water and standard chow food. For measuring food intake, five male mice of each genotype (8–10 weeks old) were housed individually and food was weighed daily over five consecutive days. All animal protocols were approved by the Institutional Animal Care and Use Committees of the University of Illinois at Chicago.
Tissue sampling
Liver, heart, gastrocnemius muscle, and a portion of epididymal fat pad were flash frozen in liquid nitrogen when mice were euthanized. Tissue lipids were extracted with chloroform:methanol (2:1) from 20–100 mg tissue lysates.
Isolation and culture of adipocytes, adipocyte size, and number analysis
Freshly isolated mature adipocytes and cultured adipocytes were prepared as described previously (6–8). Briefly, mature adipocytes were isolated from epididymal adipose tissues by collagenase digestion. After centrifugation, floating mature adipocytes were collected from the top phase. The pellets of stromovascular cells (SVCs) that contained preadipocytes were washed and cultured for 10–14 days before being used for experiments. The size of freshly isolated mature adipocytes was analyzed using an automated program, CCAP (Mayo Clinic, Rochester, MN). Adipocyte cellular lipids were estimated based on adipocyte volume and the density of triolein. Adipocyte cell numbers were estimated using a conversion factor of 6.6 pg genomic DNA per single cell (22)
TG synthesis rate in adipocytes
TG synthesis was measured as described previously (8). Freshly isolated and cultured adipocytes were incubated with 0.5 μCi/ml [14C]glucose, with or without 100 μg/ml human VLDL, in 0.1% BSA and DMEM for 6 h at 37°C. After washing, cellular lipids were extracted with chloroform:methanol (2:1), and TGs were separated by thin layer chromatography in a solvent system of hexane:ethyl ether:acetic acid (90:30:1). The TG spots were harvested and the radioactivity in the spots was measured in a scintillation counter. Human VLDL was prepared from plasma of E3/E3 donors by sequential density gradient ultracentrifugation. The TG synthesis rate was normalized to DNA amount or cell protein.
mRNA quantitation by quantitative RT-PCR
Total RNA was extracted using Qiagen kits (Valencia, CA). First-strand cDNA was synthesized from 1 mg total RNA according to the manufacturer’s instructions (Fermentas, Hanover, MD). Real-time PCR was performed using the Mx3000p quantitative PCR system (Stratagene, La Jolla, CA). Reactions were carried out in a total volume of 25 μl using Brilliant SYBR Green QRT-PCR Master Mix (Stratagene). Relative quantitation for each gene (expressed as fold changes over control) was calculated after normalization to β-actin. The primer pairs used for this study are provided in previous publications (6–13) or in a subsequent paragraph.
ApoE protein expression by Western blot
Samples were prepared for Western blot analysis of apoE as described in detail in previous publications (6–8). Western blot images were quantitated using ImageQuant TL software (GE Healthcare).
Glucose tolerance test and insulin tolerance test
SEKO or control mice were fasted for 5 h before testing, and were injected intraperitoneally with 1 g/kg D-glucose or 0.8 U/kg insulin. Blood samples were collected from the tail veins at 0, 15, 30, 60, and 120 min after injection. Glucose levels were measured by Alpha TRACK glucometer. Area under the curve (AUC) was calculated using Sigmaplot 11.0 (Systat, San Jose, CA).
Analysis of adipose tissue macrophage number and activation state
SVC fractions of adipose tissue digests that contained adipose tissue macrophages (ATMs) were prepared as described above. For flow cytometry analysis, red blood cells were lysed with BD Pharm LyseTM for 5 min, nonspecific binding sites were blocked by incubation of cells with anti-CD16/32 antibodies for 15 min on ice. ATMs were stained with eFluro450-F4/80, Alexa 488-CD11b, PE-CD11c, or Alexa 647-CD206, or their matching isotype control for 30 min (all antibodies were purchased from eBiosciences). Stained cells were analyzed with a Cyan ADP flow cytometer (Beckman Coulter, Fort Collins, CO) using Summit 4.3 software (Beckman Coulter). F4/80+CD11b+CD11c+CD206− or F4/80+CD11b+CD11c−CD206+ are referred to as M1 or M2 macrophages, respectively. Cell viability was measured with propidium iodide staining of DNA fragmentation. The macrophage cell number was normalized to fat weight.
The ATM inflammatory state was also examined by quantitative (q)RT-PCR to evaluate macrophage gene expression using the following primer sets: CD11c forward (F) ccccagaggctgtgaacata, reverse (R) ttgctttggacactcctgct; TNFα F gtccccaaagggatgagaag, R cacttggtggtttgctacga; MCP F agctctctcttcctccacca, R ctggtgatcctcttgtagctctc; IFN-γ F ctcttcctcatggctgtttc, R gtcaccatccttttgccagtt; CD206 F GGGCTTACGGTGAACCAAAT, R TGTCTTGTGGAGCAGGTGTG; IL-10 F CTGGACAACATACTGCTAACCG, R GGGCATCACTTCTACCAGGTAA; Arg1 F tggcttgcgagacgtagac, R gctcaggtgaatcggcctttt; iNOS F TTCCATGCTAATGCGAAAGG, R GCTCCTCTTCCAAGGTGCTT; YM1 F GCCCACCAGGAAAGTACACA, R TGTTGTCCTTGAGCCACTGA.
Lipid, protein, and DNA estimation
TC and TG levels were estimated with Wako TC and TG kits. Protein levels were quantified with Bio-Rad protein DC kit (Bio-Rad, Hercules, CA). DNA was isolated with a Qiagen DNeasy kit according to the manufacturer’s instructions and the amount of DNA was measured by a PicoGreen DNA assay kit (Invitrogen).
Statistics
Results are expressed as the mean ± SD of five mice in each experimental group, unless otherwise indicated in the figure legend. Results are representative of two separate experiments. Statistical differences were analyzed using Student’s t-test or ANOVA (PASW 18.0; IBM SPSS, Armonk, NY) followed by a post hoc test for multiple comparisons. P < 0.05 was considered significant.
RESULTS
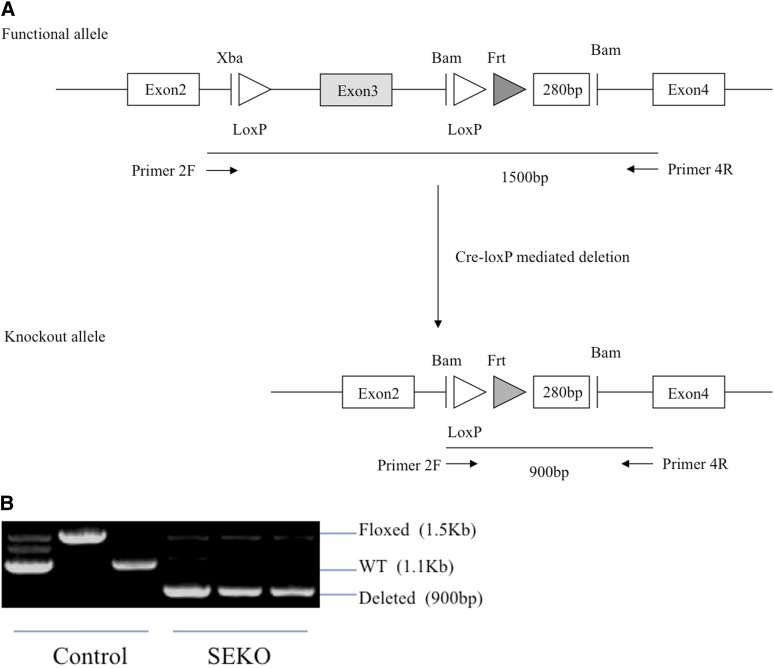
For the construction of the selective knockout of Apoe, loxP sites were inserted into either side of the third exon of the Apoe gene. The floxed mice were initially created in the 129/SvEv strain and these were then backcrossed into the C57BL/6 background (10 generations). With the crossing of this strain with aP2-Cre, the knockout allele was established in adipocytes and macrophages, the two cell types in which aP2 is highly expressed (23). The presence of the knockout allele in adipocytes of SEKO mice was indicated by the 900 bp PCR product on agarose gel; its position is indicated in Fig. 1A, B. This is in contrast to the functional allele which is 1,500 bp in length using the same primers.
Fig. 1.
Generation of SEKO mice. A: Schematic representation of the Apoe targeted allele and Cre-loxP-mediated deletion of exon 3. B: PCR analysis of Apoe deletion in adipocytes of SEKO or control mice. 2F primer, ctg ttg gtc aca ttg ctg ac; 4R primer, ttg cgt aga tcc tcc atg tc.
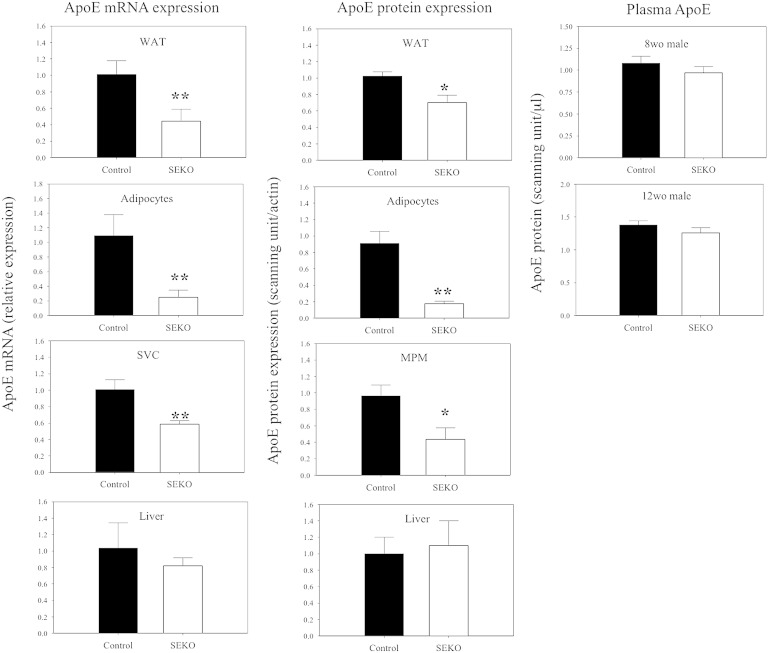
The efficacy of the selective excision of exon 3 on apoE expression in these animals is indicated in Fig. 2, where we show the levels of apoE mRNA and apoE protein. ApoE mRNA was reduced by 56% in the epididymal fat pad, by 75% in freshly isolated mature adipocytes, and by 41% in SVCs, which contain the ATMs. ApoE protein levels were reduced 31% in the epididymal fat pad, by 81% in freshly isolated adipocytes, and by 55% in the peritoneal macrophages from these animals. The difference between the 81% reduction of apoE protein in adipocytes compared with the more modest 31% reduction in the whole epididymal fat pad is likely accounted for by infiltration of the fat pad by circulating plasma apoE. There were no changes in liver apoE mRNA or protein levels in the SEKO animals. Plasma apoE levels were not significantly different comparing control and SEKO mice at both 8 and 12 weeks of age. There was no difference in apoE mRNA expression in the adrenal cortex or brain comparing control to SEKO mice (not shown).
Fig. 2.
ApoE protein and mRNA levels in SEKO and control mice. ApoE mRNA levels in whole adipose tissue, freshly isolated adipocytes, SVCs, and livers of SEKO or control mice were measured by qRT-PCR; apoE protein expression in whole adipose tissue, freshly isolated adipocytes, mouse peritoneal macrophages (MPMs), livers, and plasma were examined by Western blot as described in the Methods. Results are the mean ± SD of five mice (except for plasma, n = 12) per group [male, 8 weeks old (wo), or 12 wo as indicated]. *P < 0.05; **P < 0.01 for the difference between control and SEKO mice.
In Table 1 important phenotypic features of 8-week-old control and SEKO animals are shown. Total body weight (BW) was not significantly altered, though it trended lower in SEKO animals. The ratio of epididymal fat pad weight to BW was significantly reduced in SEKO mice. Circulating TG levels trended lower, but were not significantly different between control and SEKO mice. Plasma TC, glucose, insulin, and HOMA-IR were all significantly lower in SEKO mice. Food intake measured over five consecutive days was not different between control and SEKO mice (3.7 ± 0.4 g/day vs. 3.6 ± 0.4 g/day, P = NS).
TABLE 1.
Phenotypic characteristics of 8-week-old SEKO mice
| Control | SEKO | |
| BW (g) | 23.9 ± 1.5 | 21.3 ± 3.2 |
| WAT/BW (%) | 1.63 ± 0.20 | 1.25 ± 0.25a |
| Plasma TC (mg/dl) | 110.7 ± 7.6 | 91.3 ± 14.5a |
| Plasma TG (mg/dl) | 61.5 ± 11.4 | 57.0 ± 9.4 |
| Glucose (mg/dl) | 267.0 ± 25.2 | 195.8 ± 43.6a |
| Insulin (pg/ml) | 732.5 ± 197.0 | 490.4 ± 117.3a |
| HOMA-IR | 10.8 ± 3.8 | 5.1 ± 1.4a |
Data shown are mean ± SD.
P < 0.05 for the difference between control and SEKO mice.
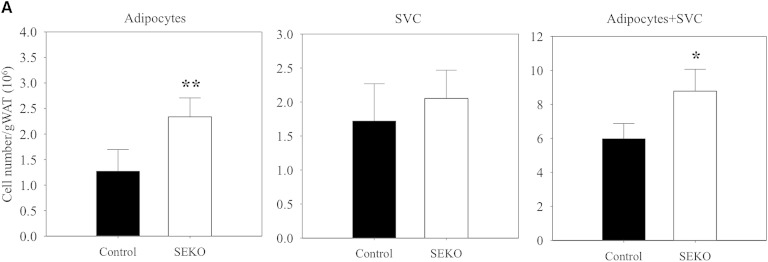
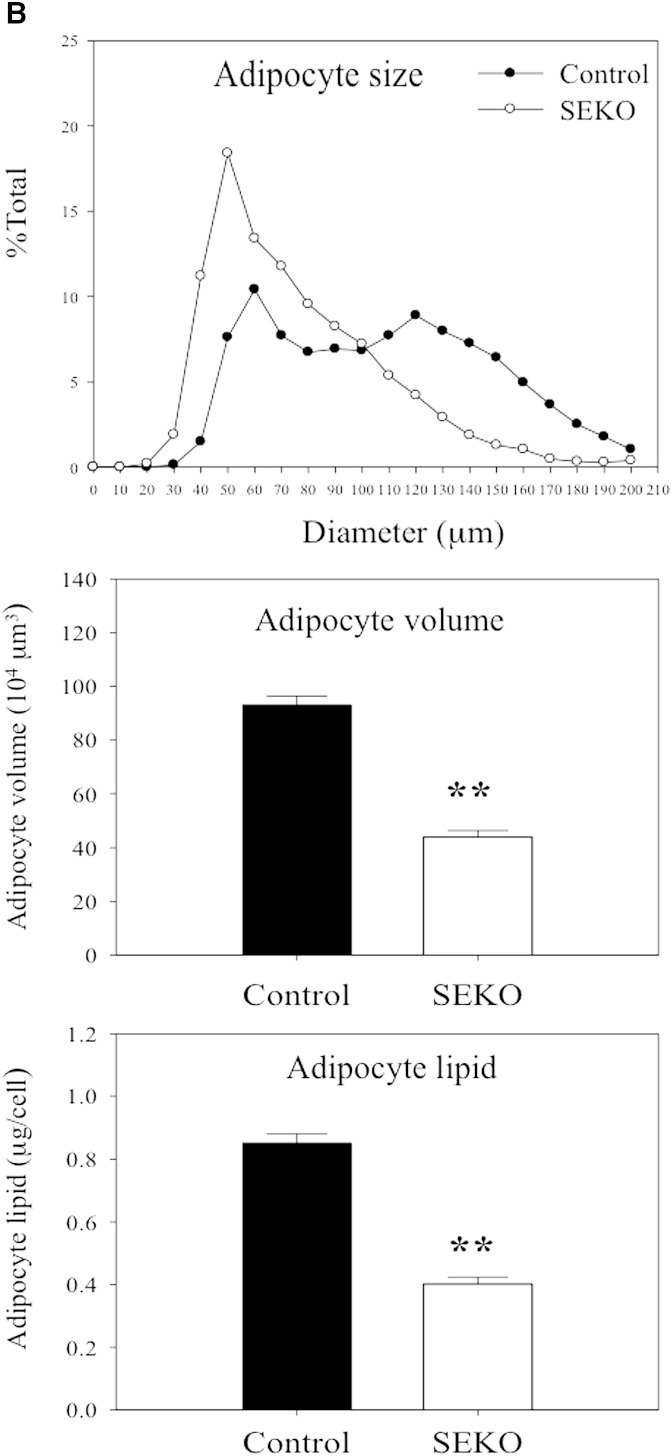
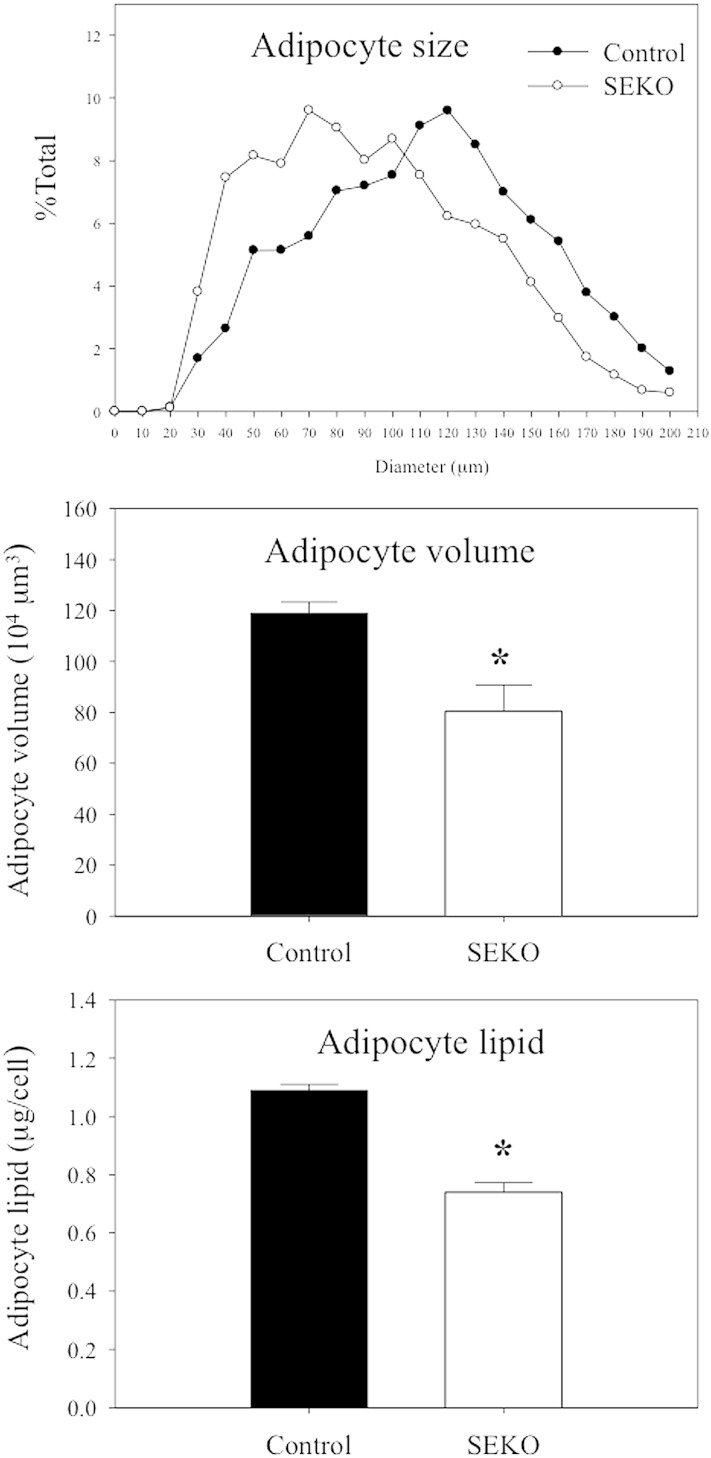
We next explored the basis for the reduction of adipose tissue mass in SEKO mice. The reduction in the ratio of adipose tissue weight to total BW was not attributable to a reduction in adipocyte number. The number of adipocytes from fat pads was actually increased in the SEKO mice (Fig. 3A). There was also no difference in the number of SVCs. However, as shown in Fig. 3B, reduction of adipocyte size and lipid content in adipocytes isolated from SEKO mice contributed to reduction in overall adipose tissue mass.
Fig. 3.
Adipocyte number and size at 8 weeks. Mature adipocytes and SVCs were isolated from visceral adipose tissue of SEKO or control mice as described in the Methods. A: Adipocyte and SVC number was estimated as described in the Methods. B: Mature adipocyte size and lipid content were analyzed using CCAP software as described in the Methods. Results are the mean ± SD of five mice. *P < 0.05; **P < 0.01 for the difference between control and SEKO mice.
Table 2 presents the results of a metabolic evaluation of control and SEKO mice at 12–13 weeks of age. The differences between SEKO and control animals at 12–13 weeks were similar to those observed at 8 weeks with respect to BW, white adipose tissue (WAT)/BW, TC, glucose, insulin, and HOMA-IR. At 12–13 weeks, plasma TG was also significantly lower in SEKO mice. The results in Fig. 4 demonstrate that at 12–13 weeks, adipocytes isolated from SEKO mice remain significantly smaller with fewer lipids than those isolated from control mice.
TABLE 2.
Phenotypic characteristics of 12–13-week-old SEKO mice
| Control | SEKO | |
| BW(g) | 25.8 ± 2.8 | 25.1 ± 0.6 |
| WAT/BW (%) | 1.22 ± 0.15 | 1.01 ± 0.10a |
| Plasma TC (mg/dl) | 114.0 ± 3.8 | 96.1 ± 5.1a |
| Plasma TG (mg/dl) | 78.6 ± 14.8 | 53.2 ± 8.9a |
| Glucose (mg/dl) | 176.2 ± 9.3 | 153.5 ± 5.8a |
| Insulin (pg/ml) | 736.3 ± 77.7 | 574.8 ± 52.2b |
| HOMA-IR | 7.0 ± 0.6 | 4.8 ± 0.5b |
Data are represented as mean ± SD.
P < 0.05.
P < 0.01 for the difference between control and SEKO mice.
Fig. 4.
Adipocyte size at 12–13 weeks. Mature adipocyte size and lipid content were analyzed using CCAP software as described in the Methods. Results are the mean ± SD of five mice. *P < 0.05 for the difference between control and SEKO mice.
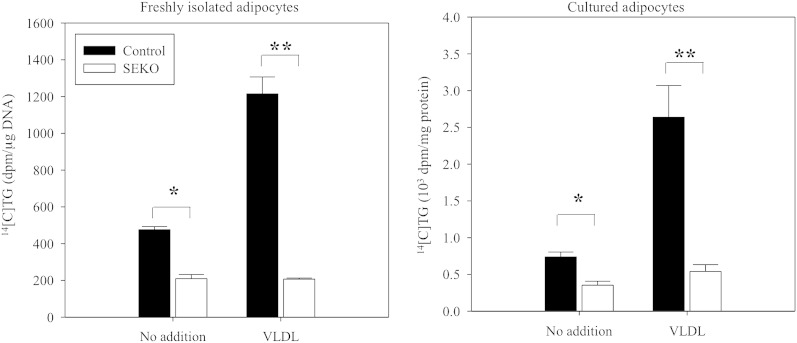
To explore a potential basis for the reduced lipid content of SEKO adipocytes, we evaluated the rate of TG synthesis from radioactive glucose precursor under basal conditions and in the presence of added apoE3-containing VLDL (Fig. 5). TG synthesis was reduced in both freshly isolated mature and cultured SEKO adipocytes in both experimental conditions. The addition of apoE-containing VLDL to control adipocytes leads to marked stimulation of adipocyte TG synthesis. In contrast, addition of apoE-containing VLDL to SEKO adipocytes has no stimulatory impact on adipocyte TG synthesis. As a consequence, TG synthesis was more markedly reduced in SEKO adipocytes in the presence of VLDL.
Fig. 5.
TG synthesis in freshly isolated mature and cultured adipocytes. Freshly isolated mature and cultured adipocytes of SEKO or control mice were prepared as described in the Methods. Cells were incubated with 0.5 μCi/ml [14C]glucose in 0.1% BSA and DMEM with or without 100 μg/ml apoE-containing VLDL for 6 h at 37°C. [14C]TG was separated by TLC, radioactivity of TG spots was estimated by β-counter. Results are the mean ± SD of five mice per group (male, 8 weeks old). *P < 0.05; **P < 0.01 for the difference between control and SEKO mice.
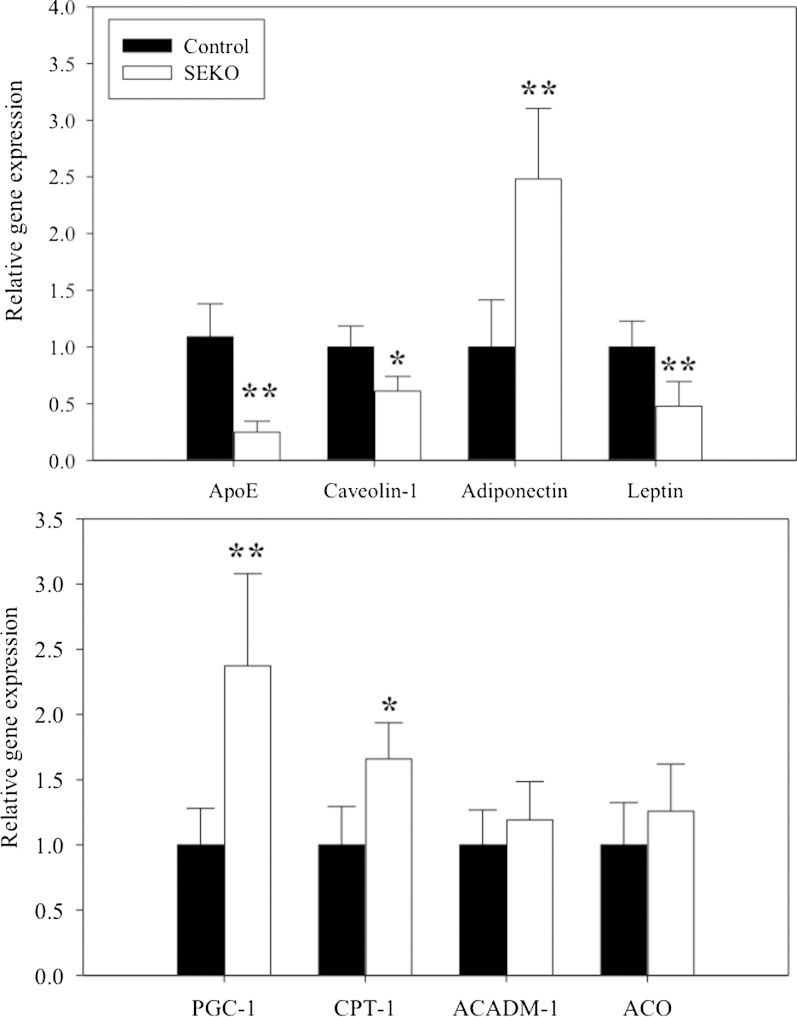
We have previously described changes in the expression of several important genes in adipocytes isolated from Apoe−/− mice (7). These results, however, may have been influenced by the exposure of these adipocytes during their development to the markedly hyperlipidemic environment characteristic of Apoe−/− mice. Figure 6 shows the differences in gene expression between freshly isolated mature adipocytes from control and SEKO male animals at 8 weeks of age. The expected reduction in apoE gene expression is demonstrated. Even without previous exposure to a hyperlipidemic environment, significant changes in gene expression were evident. Caveolin and leptin expression were significantly decreased in SEKO adipocytes. Adiponectin, PGC-1, and CPT-1 expression were significantly increased, while there was no change in ACO and ACADM. The changes in adipocyte leptin expression (lower) and adiponectin expression (higher) were consistent with the differences in adipocyte cell size noted in Fig. 3 for SEKO compared with control adipocytes. There was also no difference in the DGAT1 or DGAT2 mRNA expression level in the adipose tissue of control compared with SEKO mice (not shown). We also evaluated expression of several hepatic genes involved in TG synthesis or fatty acid oxidation. There were no differences in the levels of Dgat1, Dgat2, CPT-1, LCAD, or FASn between control and SEKO mice (not shown).
Fig. 6.
Gene expression in freshly isolated mature adipocytes of SEKO mice. Adipocytes were prepared from the adipose tissue of SEKO or control mice. Adipocyte gene expression was analyzed by qRT-PCR as described in the Methods. Results are the mean ± SD of five mice per group, each run in duplicate. *P < 0.05; **P < 0.01 for the difference between control and SEKO mice.
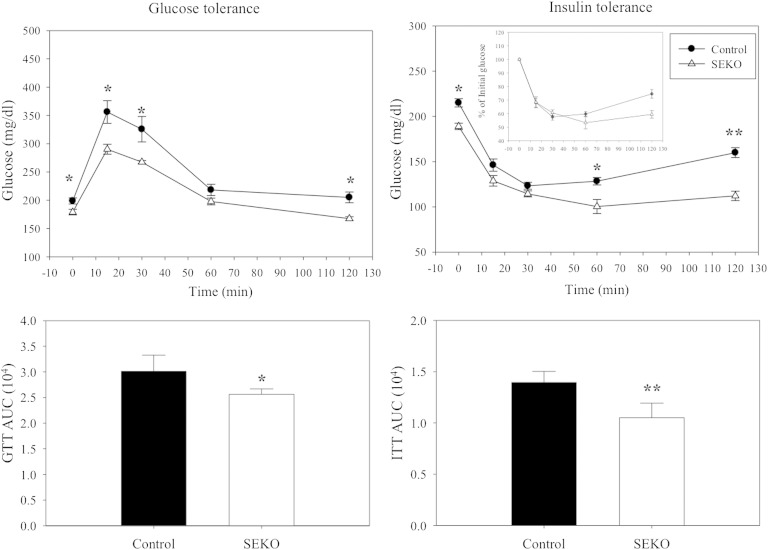
Plasma glucose, insulin, and HOMA-IR were all significantly lower in the SEKO mice (Tables 1, 2), and adipocyte gene expression was altered in a manner consistent with higher systemic insulin sensitivity. To further explore a potential difference in systemic glucose homeostasis, we performed intraperitoneal glucose and insulin tolerance tests (Fig. 7). The upper panels of the figure show the time course of glucose excursions after injection of a glucose load (on the left) or of insulin (on the right). The bottom panels present the AUC for each time course. Both glucose tolerance and insulin efficacy were significantly better in the SEKO mice.
Fig. 7.
Glucose and insulin tolerance. Fasted SEKO or control mice were injected intraperitoneally with 1 g/kg glucose or 0.8 U/kg insulin. Blood glucose levels were measured by tail vein bleeding using an alphaTRACK glucometer. Results are the mean ± SD of five mice per group (male, 8 weeks old). *P < 0.05; **P < 0.01 for the difference between control and SEKO mice.
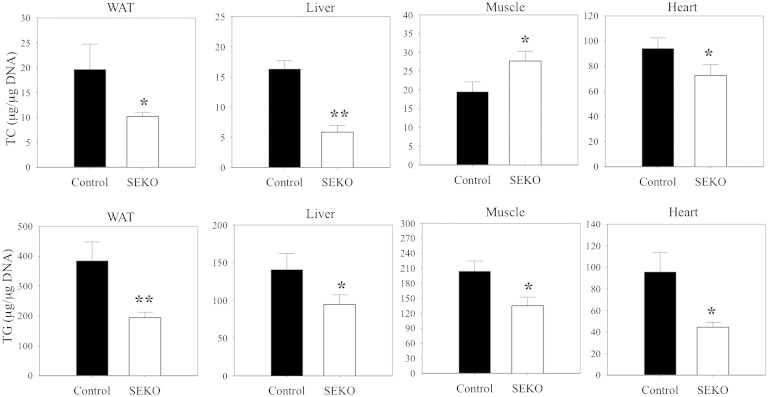
The improved glucose tolerance and increased insulin sensitivity we measured in SEKO mice was unexpected. We therefore next evaluated potential pathways that could contribute to improved systemic substrate utilization. Changes in skeletal muscle or hepatic lipid content have been suggested as important markers of, or contributors to, the altered insulin sensitivity that occurs in response to fat feeding of animals or obesity in humans (24–28). We therefore evaluated the impact of reduced adipose tissue apoE expression on systemic tissue lipid distribution in adipose tissue, liver, skeletal muscle, and heart. TG mass was reduced in all four tissues (Fig. 8) in SEKO mice, while TC mass was also reduced in all except the skeletal muscle, where there was a significant increment in TC mass.
Fig. 8.
Tissue lipid levels. Adipose tissue, liver, muscle, and heart were harvested from SEKO or control mice at 8 weeks of age. Tissue lipids were extracted and TG or TC levels were estimated as described in the Methods. Results are the mean ± SD of five mice per group. *P < 0.05; **P < 0.01 for the difference between control and SEKO mice.
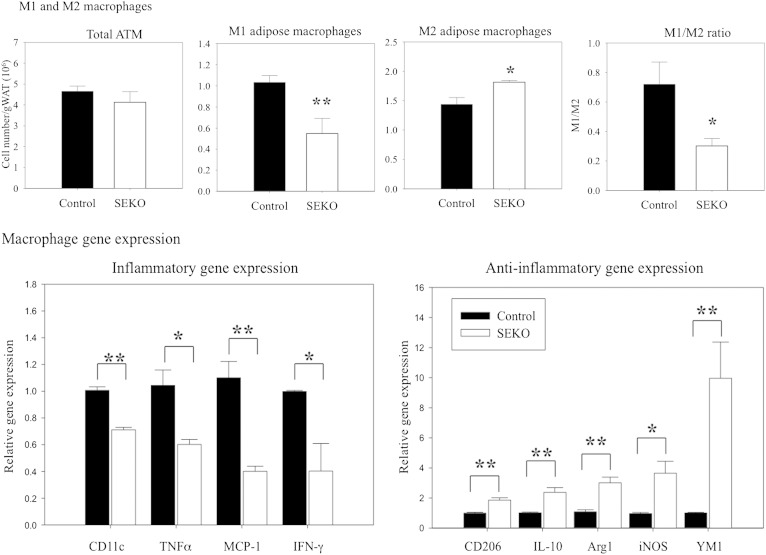
Recent information also points to an important role for macrophage infiltration and inflammatory activation in adipose tissue for producing many of the systemic metabolic effects of obesity, including adverse changes in insulin sensitivity (29–35). ApoE is expressed in both adipocytes and macrophages present in adipose tissue, and SEKO animals exhibited reduced apoE expression in both cell types, with more marked suppression in adipocytes (Fig. 2). We next evaluated the impact of this reduction on adipose tissue inflammatory state by measuring the number and inflammatory state of ATMs (Fig. 9). The total number of ATMs was not different comparing control and SEKO adipose tissue. However, the balance between inflammatory (M1) and noninflammatory (M2) macrophages was significantly altered in the SEKO adipose tissue; with the latter having a predominance of the noninflammatory phenotype (upper panels). Consistent with this flow cytometric data, pro-inflammatory gene expression was significantly higher in control compared with SEKO ATMs, while anti-inflammatory gene expression was significantly higher in the SEKO ATMs (lower panels). These results establish a less inflammatory phenotype in SEKO adipose tissue.
Fig. 9.
ATM characterization. Upper panel: ATMs of SEKO or control mice were stained with F4/80, CD11b, CD11c, and CD206 and analyzed by flow cytometry; M1 (F4/80+CD11b+CD11c+CD206−) or M2 (F4/80+CD11b+CD11c−CD206+). Macrophage number was normalized to adipose tissue mass. Lower panel: Pro- and anti-inflammatory ATM gene expression was analyzed by qRT-PCR as described in the Methods. Results are the mean ± SD of five mice per group (male, 8 weeks old). *P < 0.05; **P < 0.01 for the difference between control and SEKO mice.
DISCUSSION
This is the first report of a model in which the consequences of tissue-specific reduction of apoE expression can be examined without the need for tissue transplantation. We report that selective reduction of adipose tissue apoE, in the presence of normal circulating levels of apoE, produces a novel and somewhat unexpected phenotype. First, there is a significant improvement in systemic insulin sensitivity. Second, the accumulation of lipids in muscle and liver is reduced. Third, ATMs are modulated to a noninflammatory phenotype.
ApoE, first established as a liver-derived ligand for cell surface lipoprotein receptors, is now known to be produced by numerous cell types with pleiotropic and tissue specific effects. ApoE production in adipose tissue by adipocytes was first described by Zechner et al. (5). Subsequent studies have shown that apoE production by adipocytes is regulated by a number of physiologically relevant factors including PPARγ agonists, inflammatory cytokines, and organismal nutritional status and diet (10–13). In addition, using adipocytes isolated from globally apoE-deficient mice, or isolated from adipose tissue derived from these mice after transplantation into wild-type hosts, endogenous adipocyte apoE expression has been shown to significantly influence adipocyte lipid flux and gene expression (6–8). The straightforward interpretation of the results of the above studies however is confounded by the exposure of adipose tissue, at some point, to the massive hyperlipidemia that is characteristic of global apoE deficiency. The SEKO mouse model used for the current study eliminates this confounding issue and establishes that when adipose apoE expression is suppressed in the presence of normal circulating levels of apoE, adipose tissue mass is reduced, adipocytes are smaller and contain fewer lipids, and adipocyte gene expression is altered. The results in Fig. 5 demonstrate that SEKO adipocytes synthesize less TG compared with control adipocytes, and even more provocatively, they completely fail to respond to extracellular apoE-containing VLDL with increased TG synthesis. In isolated adipocytes, we have previously reported that in the absence of endogenous apoE expression, adipocytes have reduced internalization of extracellular free fatty acid and reduced receptor-mediated internalization of apoE-containing VLDL particles. The latter defect is accounted for primarily by a reduction in adipocyte expression of VLDL receptors (8).
Importantly, the current model uniquely allows the investigation of a potential systemic impact of reduced adipose tissue apoE expression. The results in Table 1 and Table 2 show that, at 8 and 12 weeks, respectively, there are changes in circulating insulin and glucose levels consistent with better insulin sensitivity in SEKO animals. The data in Fig. 7 confirm this observation; SEKO mice demonstrate better glucose tolerance and higher insulin efficacy compared with control mice. The systemic changes in insulin sensitivity in SEKO mice might be predicted based on the reduction in adipose tissue mass and the smaller adipocytes measured in these animals, and a number of contributing mechanisms can be considered. In preliminary studies, we measured a reduction in circulating leptin levels, consistent with reduced adipose tissue mass, in SEKO mice (not shown). However, it is uncertain how this reduction could relate directly to changes in systemic insulin action. There were no differences in circulating total or HMW-adiponectin levels (not shown) between control and SEKO mice, implying that this adipokine is not responsible for the observed differences in insulin sensitivity; although a tissue-specific role for adiponectin signaling cannot be ruled out.
We did, however, measure significant differences between control and SEKO mice in lipid accumulation in liver and skeletal muscle. In SEKO mice, lipid content in these tissues is significantly reduced. The notion that this reduction could contribute to changes in insulin action in SEKO mice is consistent with a large body of literature suggesting that the lipid content of hepatocytes and skeletal muscle modulates their responsiveness to insulin (24–28). In addition, we noted an unexpected and provocative change in adipose tissue inflammatory state between control and SEKO mice, with the latter demonstrating a much less inflammatory phenotype. That this change in adipose tissue inflammatory state could contribute to systemic changes in systemic insulin action between control and SEKO mice is consistent with an extensive literature demonstrating that adipose tissue inflammation has a deleterious effect on systemic insulin action (29–35). Consistent with this conclusion, Pownall and colleagues recently reported that the adipose tissue of globally deficient apoE mice was less inflammatory compared with wild-type mice (36). In that report, globally deficient apoE mice on a high-fat diet remained more insulin sensitive than weight-matched wild-type controls with lower levels of inflammatory cytokines in adipose tissue and in muscle. The repeated administration of apoE-poor VLDL induced adipose tissue inflammation in wild-type, but not globally deficient, apoE mice. These latter results are particularly provocative, as they indicate that apoE is necessary to promote adipose tissue inflammation, even in the presence of the marked hyperlipidemia that is present in globally deficient apoE mice. Our results establish an important role for apoE produced locally in adipose tissue, independent of circulating apoE, for modulating the adipose tissue inflammatory state. It should be noted that the difference in inflammatory phenotype we have measured in adipose tissue from control and SEKO mice may be related to the reduced apoE expression in either macrophages or adipocytes. Others have shown that exogenously added apoE can modulate macrophage inflammatory state but, interestingly, suppresses the inflammatory phenotype (37, 38). Our results, however, imply that the expression of apoE in adipose tissue promotes an inflammatory phenotype. The difference between the above mentioned observations could reflect a functional difference between the effect of endogenously expressed compared with addition of extracellular apoE, or could result from the cross-talk between adipocytes and macrophages that occurs uniquely in adipose tissue (39).
One result of using the aP2 promoter to drive expression of the Cre recombinase in our model is reduced expression of apoE in both adipocytes and, to a lesser degree, in macrophages. This is advantageous in that it leads to a more substantial reduction in total adipose tissue apoE, where both cell types produce apoE. This, however, does not allow an unambiguous assignment of the characteristics of SEKO mice to specific reduction in one cell type versus the other. The specific contribution of macrophage and adipocyte apoE in adipose tissue for producing the metabolic and inflammatory phenotype in the SEKO model will need to be addressed in the future using adipocyte- or macrophage-specific promoters for the Cre recombinase.
Although adipose tissue apoE expression is reduced at the transcript and protein level in SEKO mice, expression is by no means negligible. It is somewhat surprising then that the phenotype, with respect to adipocyte lipid flux and gene expression, is as substantially altered as we report here. Even more surprising is that systemic metabolic changes and adipose tissue inflammatory differences are so evident. These results imply that the adipose tissue and systemic phenotype are extremely sensitive to small changes in adipose tissue apoE expression. In view of this, additional investigation of the mechanisms regulating adipose tissue apoE expression and further investigation of the pathways by which this expression influences systemic metabolic phenotype and adipose tissue inflammatory state will be important.
Acknowledgments
The authors thank Johanna VanOpstal for assistance with manuscript preparation.
Footnotes
Abbreviations:
- ATM
- adipose tissue macrophage
- AUC
- area under the curve
- BW
- body weight
- HOMA-IR
- homeostatic model assessment of insulin resistance
- SEKO
- selective apoE knockout (adipose tissue)
- SVC
- stromovascular cell
- TC
- total cholesterol
- WAT
- white adipose tissue
This work was supported by National Institutes of Health Grant DKO71711 (to T.M.).
REFERENCES
- 1.Kraft H. G., Menzel H. J., Hoppichler F., Vogel W., Utermann G. 1989. Changes of genetic apolipoprotein phenotypes caused by liver transplantation. Implications for apolipoprotein synthesis. J. Clin. Invest. 83: 137–142. [DOI] [PMC free article] [PubMed] [Google Scholar]
- 2.Curtiss L. K., Boisvert W. A. 2000. Apolipoprotein E and atherosclerosis. Curr. Opin. Lipidol. 11: 243–251. [DOI] [PubMed] [Google Scholar]
- 3.Getz G. S., Reardon C. A. 2009. Apoprotein E as a lipid transport and signaling protein in the blood, liver, and artery wall. J. Lipid Res. 50: S156–S161. [DOI] [PMC free article] [PubMed] [Google Scholar]
- 4.Mazzone T. 1996. Apolipoprotein E secretion by macrophages: its potential physiological functions. Curr. Opin. Lipidol. 7: 303–307. [DOI] [PubMed] [Google Scholar]
- 5.Zechner R., Moser R., Newman T. C., Fried S. K., Breslow J. L. 1991. Apolipoprotein E gene expression in mouse 3T3-L1 adipocytes and human adiose tissue and its regulation by differentiation and lipid content. J. Biol. Chem. 266: 10583–10588. [PubMed] [Google Scholar]
- 6.Huang Z. H., Reardon C. A., Mazzone T. 2006. Endogenous apoE expression modulates adipocyte triglyceride content and turnover. Diabetes. 55: 3394–3402. [DOI] [PubMed] [Google Scholar]
- 7.Huang Z. H., Gu D., Mazzone T. 2009. Role of adipocyte-derived apoE for modulating adipocyte size, lipid metabolism, and gene expression in vivo. Am. J. Physiol. Endocrinol. Metab. 296: E1110–E1119. [DOI] [PMC free article] [PubMed] [Google Scholar]
- 8.Huang Z. H., Minshall R. D., Mazzone T. 2009. Mechanism for endogenously expressed apoE modulation of adipocyte VLDL metabolism: role in endocytic and lipase-mediated metabolic pathways. J. Biol. Chem. 284: 31512–31522. [DOI] [PMC free article] [PubMed] [Google Scholar]
- 9.Huang Z. H., Maeda N., Mazzone T. 2011. Expression of the human apoE isoform in adipocytes: altered cellular processing and impaired adipocyte lipogenesis. J. Lipid Res. 52: 1733–1741. [DOI] [PMC free article] [PubMed] [Google Scholar]
- 10.Huang Z. H., Luque R. M., Kineman R. D., Mazzone T. 2007. Nutritional regulation of adipose tissue apolipoprotein E expression. Am. J. Physiol. Endocrinol. Metab. 293: E203–E209. [DOI] [PubMed] [Google Scholar]
- 11.Yue L., Christman J., Mazzone T. 2008. Tumor necrosis factor-alpha-mediated suppression of adipocyte apolipoprotein E gene transcription: primary role for the nuclear factor (NF)-kappaB pathway and NFkappaB p50. Endocrinology. 149: 4051–4058. [DOI] [PMC free article] [PubMed] [Google Scholar]
- 12.Espiritu D. J., Mazzone T. 2008. Oxidative stress regulates adipocyte apolipoprotein E and suppresses its expression in obesity. Diabetes. 57: 2992–2998. [DOI] [PMC free article] [PubMed] [Google Scholar]
- 13.Espiritu D. J., Huang Z. H., Zhao Y., Mazzone T. 2010. Hyperglycemia and advanced glycosylation end products suppress adipocyte apoE expression: implications for adipocyte triglyceride metabolism. Am. J. Physiol. Endocrinol. Metab. 299: E615–E623. [DOI] [PMC free article] [PubMed] [Google Scholar]
- 14.Linton M. F., Atkinson J. B., Fazio S. 1995. Prevention of atherosclerosis in apolipoprotein E-deficient mice by bone marrow transplantation. Science. 267: 1034–1037. [DOI] [PubMed] [Google Scholar]
- 15.Hasty A. H., Linton M. F., Swift L. L., Fazio S. 1999. Determination of the lower threshold of apolipoprotein E resulting in remnant lipoprotein clearance. J. Lipid Res. 40: 1529–1538. [PubMed] [Google Scholar]
- 16.Wientgen H., Thorngate F. E., Omerhodzic S., Rolnitzky L., Fallon J. T., Williams D. L., Fisher E. A. 2004. Subphysiologic apolipoprotein E (ApoE) plasma levels inhibit neointimal formation after arterial injury in ApoE-deficient mice. Arterioscler. Thromb. Vasc. Biol. 24: 1460–1465. [DOI] [PubMed] [Google Scholar]
- 17.Thorngate F. E., Rudel L. L., Walzem R. L., Williams D. L. 2000. Low levels of extrahepatic nonmacrophage ApoE inhibit atherosclerosis without correcting hypercholesterolemia in ApoE-deficient mice. Arterioscler. Thromb. Vasc. Biol. 20: 1939–1945. [DOI] [PubMed] [Google Scholar]
- 18.Huang Z. H., Reardon C. A., Subbaiah P. V., Getz G. S., Mazzone T. 2013. ApoE derived from adipose tissue does not suppress atherosclerosis or correct hyperlipidemia in apoE knockout mice. J. Lipid Res. 54: 202–213. [DOI] [PMC free article] [PubMed] [Google Scholar]
- 19.Yue L., Mazzone T. 2011. Endogenous adipocyte apoE is co-localized with caveolin at the adipocyte plasma membrane. J. Lipid Res. 52: 489–498. [DOI] [PMC free article] [PubMed] [Google Scholar]
- 20.Hofmann S. M., Perez-Tilve D., Greer T. M., Coburn B. A., Grant E., Basford J. E., Tschöp M. H., Hui D. Y. 2008. Defective lipid delivery modulates glucose tolerance and metabolic response to diet in apolipoprotein E-deficient mice. Diabetes. 57: 5–12. [DOI] [PMC free article] [PubMed] [Google Scholar]
- 21.Reaven G. M. 2009. Insulin secretory function in type 2 diabetes: does it matter how you measure it? J. Diabetes. 1: 142–150. [DOI] [PubMed] [Google Scholar]
- 22.Dolezel J., Bartos J., Voglmayr H., Greilhuber J. 2003. Nuclear DNA content and genome size of trout and human. Cytometry. 51: 127–128. [DOI] [PubMed] [Google Scholar]
- 23.Makowski L., Boord J. B., Maeda K., Babaev V. R., Uysal K. T., Morgan M. A., Parker R. A., Suttles J., Fazio S., Hotamisligil G. S., et al. 2001. Lack of macrophage fatty-acid-binding protein aP2 protects mice deficient in apolipoprotein E against atherosclerosis. Nat. Med. 7: 699–705. [DOI] [PMC free article] [PubMed] [Google Scholar]
- 24.Virkamäki A., Korsheninnikova E., Seppälä-Lindroos A., Vehkavaara S., Goto T., Halavaara J., Häkkinen A-M., Yki-Järvinen H. 2001. Intramyocellular lipid is associated with resistance to in vivo insulin actions on glucose uptake, antilipolysis, and early insulin signaling pathways in human skeletal muscle. Diabetes. 50: 2337–2343. [DOI] [PubMed] [Google Scholar]
- 25.Itani S. I., Ruderman N. B., Schmieder F., Boden G. 2002. Lipid-induced insulin resistance in human muscle is associated with changes in diacylglycerol, protein kinase C, and IkappaB-alpha. Diabetes. 51: 2005–2011. [DOI] [PubMed] [Google Scholar]
- 26.Boden G., She P., Mozzoli M., Cheung P., Gumireddy K., Reddy P., Xiang X., Luo Z., Ruderman N. 2005. Free fatty acids produce insulin resistance and activate the proinflammatory nuclear factor-кB pathway in rat liver. Diabetes. 54: 3458–3465. [DOI] [PubMed] [Google Scholar]
- 27.Nagle C. A., Klett E. L., Coleman R. A. 2009. Hepatic triacylglycerol accumulation and insulin resistance. J. Lipid Res. 50: S74–S79. [DOI] [PMC free article] [PubMed] [Google Scholar]
- 28.Choi C. S., Savage D. B., Kulkarni A., Yu X. X., Liu Z-X., Morino K., Kim S., Distefano A., Samuel V. T., Neschen S., et al. 2007. Suppression of diacylglycerol acyltransferase-2 (DGAT2), but not DGAT1, with antisense oligonucleotides reverses diet-induced hepatic steatosis and insulin resistance. J. Biol. Chem. 282: 22678–22688. [DOI] [PubMed] [Google Scholar]
- 29.Shoelson S. E., Lee J., Goldfine A. B. 2006. Inflammation and insulin resistance. J. Clin. Invest. 116: 1793–1801. [DOI] [PMC free article] [PubMed] [Google Scholar]
- 30.Hotamisligil G. S. 2006. Inflammation and metabolic disorders. Nature. 444: 860–867. [DOI] [PubMed] [Google Scholar]
- 31.Schenk S., Saberi M., Olefsky J. M. 2008. Insulin sensitivity: modulation by nutrients and inflammation. J. Clin. Invest. 118: 2992–3002. [DOI] [PMC free article] [PubMed] [Google Scholar]
- 32.Sun K., Kusminski C. M., Scherer P. E. 2011. Adipose tissue remodeling and obesity. J. Clin. Invest. 121: 2094–2101. [DOI] [PMC free article] [PubMed] [Google Scholar]
- 33.Li P., Lu M., Nguyen M. T., Bae E. J., Chapman J., Feng D., Hawkins M., Pessin J. E., Sears D. D., Nguyen A. K., et al. 2010. Functional heterogeneity of CD 11c-positive adipose tissue macrophages in diet-induced obese mice. J. Biol. Chem. 285: 15333–15345. [DOI] [PMC free article] [PubMed] [Google Scholar]
- 34.Wu H., Perrard X. D., Wang Q., Perrard J. L., Polsani V. R., Jones P. H., Smith C. W., Ballantyne C. M. 2010. CD11c expression in adipose tissue and blood and its role in diet-induced obesity. Arterioscler. Thromb. Vasc. Biol. 30: 186–192. [DOI] [PMC free article] [PubMed] [Google Scholar]
- 35.Fujisaka S., Usui I., Bukhari A., Ikutani M., Oya T., Kanatani Y., Tsuneyama K., Nagai Y., Takatsu K., Urakaze M., et al. 2009. Regulatory mechanisms for adipose tissue M1 and M2 macrophages in diet-induced obese mice. Diabetes. 58: 2574–2582. [DOI] [PMC free article] [PubMed] [Google Scholar]
- 36.Wang J., Perrard X. D., Perrard J. L., Mukherjee A., Rosales C., Chen Y., Smith C. W., Pownall H. J., Ballantyne C. M., Wu H. 2012. ApoE and the role of very low density lipoproteins in adipose tissue inflammation. Atherosclerosis. 223: 342–349. [DOI] [PMC free article] [PubMed] [Google Scholar]
- 37.Baitsch D., Bock H. H., Engel T., Telgmann R., Müller-Tidow C., Varga G., Bot M., Herz J., Robenek H., von Eckardstein A., et al. 2011. Apolipoprotein E induces antiinflammatory phenotype in macrophages. Arterioscler. Thromb. Vasc. Biol. 31: 1160–1168. [DOI] [PMC free article] [PubMed] [Google Scholar]
- 38.Zhu Y., Kodvawala A., Hui D. Y. 2010. Apolipoprotein E inhibits toll-like receptor (TLR)-3- and TLR-4-mediated macrophage activation through distinct mechanisms. Biochem. J. 428: 47–54. [DOI] [PMC free article] [PubMed] [Google Scholar]
- 39.Suganami T., Tanimoto-Koyama K., Nishida J., Itoh M., Yuan X., Mizuarai S., Kotani H., Yamaoka S., Miyake K., Aoe S., et al. 2007. Role of the toll-like receptor 4/NF-kappaB pathway in saturated fatty acid-induced inflammatory changes in the interaction between adipocytes and macrophages. Arterioscler. Thromb. Vasc. Biol. 27: 84–91. [DOI] [PubMed] [Google Scholar]


