

Abstract
Background
Due to pharmacoresistant seizures and the underutilization of surgical treatments, a large number of temporal lobe epilepsy (TLE) patients experience seizures for years or decades. The goal of this study was to generate a predictive model of duration of disease with the least number of parameters possible in order to identify and quantify the significant volumetric and functional indicators of TLE progression.
Methods
Two cohorts of subjects including 12 left TLE, 21 right TLE and 20 healthy controls (duration=0) were imaged on a 3T MRI scanner using high resolution T1-weighted structural MRI and 20 minutes of resting functional MRI scanning. Multivariate linear regression methods were used to compute a predictive model of duration of disease using 49 predictors including functional connectivity and gray matter volumes computed from these images.
Results
No model developed from the full set of data accurately predicted the duration of disease across the entire range from 3 to 50 years. We then performed the regression on 35 subjects with durations of disease in the range 10 to 35 years. The resulting predictive model showed that longer durations were associated with reductions in functional connectivity from the ipsilateral temporal lobe to the contralateral temporal lobe, precuneus and mid cingulate, and with decreases in volume of the ipsilateral hippocampus and pallidum.
Conclusions
Functional and volumetric parameters accurately predicted duration of disease in TLE. The findings suggest that TLE is associated with a gradual functional isolation and significant progressive structural atrophy of the ipsilateral temporal lobe over years of duration in the range of 10–35 years. Furthermore, these changes can also be detected in the contralateral hemisphere in these patients, but to a lesser degree.
Keywords: temporal lobe epilepsy, brain, functional MRI, connectivity, regression
Introduction
Temporal lobe epilepsy (TLE) is one of the most common and relatively homogeneous forms of epilepsy occurring in adults. Due to pharmacoresistant seizures and the underutilization of surgical treatments, a large number of these patients experience seizures for years or decades. Understanding the structural and functional changes that occur in the brain over years of disease progression can provide potential targets for intervention, be used to monitor the patient, help elucidate mechanisms of cognitive and behavioral impairments, and may predict treatment outcomes. Perhaps, most importantly, it can provide neurophysiological evidence of the progressive effects of long term seizures when considering prolonged medical therapy vs. surgical intervention (Wiebe et al., 2001).
Structural volumetric changes occurring in TLE have been well documented. MRI techniques such as voxel based morphometry (Ashburner and Friston, 2000) and image segmentation methods (Dale et al., 1999) have shown gray matter and white matter atrophy in the temporal lobe ipsilateral to the seizure focus, as well as in many other regions across the brain (Alhusaini et al., 2012; Keller and Roberts, 2008; Li et al., 2012; McDonald et al., 2008). Decreased volume in the ipsilateral hippocampus (Seidenberg et al., 2005), subcortical regions (Pulsipher et al., 2007; Szabo et al., 2006) and parietal and orbitofrontal regions (Bernhardt et al., 2009) have been correlated with increased duration of disease in some studies, but not in others (Bernasconi et al., 2004; Coan et al., 2014).
The evolution of functional networks across the brain over years of TLE can be measured with functional MRI (fMRI). This method can be used to create images that are sensitive to fluctuations in blood oxygenation level that occur spontaneously across the brain (Obrig et al., 2000; Ogawa et al., 1990). The identification of brain networks with synchronous spontaneous low frequency oxygenation fluctuations using fMRI is referred to as functional connectivity (Biswal et al., 1995; Rogers et al., 2007). Functional connectivity changes in TLE have been detected in mesial temporal regions (Bettus et al., 2009; Pereira et al., 2010; Pittau et al., 2012) and across the brain (Zhang et al., 2010). Our previous work has shown linear relationships between functional connectivity and memory scores (Holmes et al., 2013a) and gray matter concentration in TLE (Holmes et al., 2013b).
The goal of this study is to identify and quantify the volumetric and functional changes that occur in the brain over the years of duration of TLE. Specifically, we will use multivariate linear regression methods (Burdenski, 2000; Concato et al., 1993) to test the relationships of 49 potential variables in the context of the other variables to propose an accurate linear predictive model of duration of disease with the least number of parameters required. We hypothesize that this modeling process will determine the significant linear structural and functional effects of TLE over years of duration.
Materials and Methods
2.1 Subjects
In order to maximize the sample size, two cohorts of TLE patients were included in this study. The fMRI scanning for the two cohorts was slightly different and, therefore, the processing was different between the two. The details of each are described below. Cohort 1 consisted of 12 patients from a population of 60 epilepsy patients recruited from the Vanderbilt University Epilepsy Program for imaging. All patients underwent presurgical inpatient video-EEG monitoring for localization of the epileptogenic zone, high resolution structural MRI, fluoro-deoxyglucose positron emission tomography (FDG-PET) and neuropsychological testing. Inclusion criteria were: 1) unilateral temporal lobe epilepsy determined by presurgical noninvasive evaluation, 2) no foreign tissue lesions, and 3) underwent temporal resection with seizure free outcome. Six subjects with left TLE and six with right TLE were included (10F/2M, 2 left handed, age 38 ± 11 years). Cohort 2 consisted of 21 TLE patients (6 left TLE and 15 right TLE, 12F/9M, 3 left handed, age 37 ± 12 years). The same inclusion criteria were used as Cohort 1 except that surgical outcome was not yet available in the last 5 patients. One patient had a single post-surgical seizure. Cohort 2 also included 20 healthy controls matched individually by age (within 3 years) and gender to 20 of the TLE patients in Cohort 2 (11F/9M, 3 left handed, age 38 ± 13 years).
2.2 Imaging
Informed consent was obtained prior to scanning each subject per Vanderbilt University Institutional Review Board guidelines. The imaging for Cohort 1 was performed using a 3T MRI scanner using an 8-channel head coil. The acquisition included the following scans: 1) Three-dimensional, T1-weighted high-resolution image series covering the whole brain for inter-subject normalization (Gradient echo, TR = 9.1 msec, TE = 4.6 ms, 192 shots, flip angle = 8 degrees, matrix = 256×256, 1 × 1 × 1 mm3), 2) Two-dimensional, T1-weighted high-resolution axial full brain image series in the same slice locations as the fMRI scan for functional to 3D structural data coregistration (1 × 1 × 5 mm3), and 3) fMRI Blood Oxygenation Level Dependent (BOLD) image series at rest with eyes closed – 64×64, FOV = 240 mm, 30 axial slices, TE = 35 ms, TR = 2 sec, slice thickness = 4.5 mm/0.5 mm gap, 2 × 300 volumes (20 minutes).
The imaging for Cohort 2 was performed on the same MRI scanner using a 32 channel head coil. The acquisition included the following scans: 1) the same three dimensional structural acquisition parameters as those for Cohort 1, 2) two-dimensional, T1-weighted high-resolution axial full brain image series acquired in the same slice locations as the fMRI scans for functional to 3D structural data coregistration (1 × 1 mm2) with 3.5 mm slice thickness with 0.5 mm gap, and 3) BOLD fMRI T2* weighted gradient echo, echo-planar image series at rest with eyes closed – matrix 80 × 80, FOV = 240 mm, 34 axial slices, TE = 35 ms, TR = 2 sec, slice thickness = 3.5 mm with 0.5 mm gap, 2 × 300 volumes (20 minutes). Physiological monitoring of cardiac and respiratory fluctuations was performed at 500 Hz throughout all scanning of Cohort 2 using the MRI scanner integrated pulse oximeter and the respiratory belt.
2.3 fMRI Image Processing
The fMRI image analyses for both cohorts were performed using SPM8 software (http://www.fil.ion.ucl.ac.uk/spm/software/spm8/).The fMRI images were corrected for slice timing effects and motion between volumes. The six motion time series representing the x, y, and z translations and rotations were saved as potential confounds for the functional connectivity computation. The images of Cohort 2 only (no physiological monitoring was performed in Cohort 1) were then corrected for physiological noise using a RETROICOR protocol (Glover et al., 2000) using the measured cardiac and respiratory time series. The fMRI images were then spatially normalized to the Montreal Neurological Institute (MNI) template using a two-step process. First, the two-dimensional T1-weighted image was co-registered to the three-dimensional T1-weighted image. Then the three-dimensional T1-weighted image was spatially normalized to the template and the normalization parameters were applied to the fMRI images and two-dimensional T1-weighted image. The fMRI images from Cohort 1 which were acquired at 3.75 × 3.75 × 5 mm3 resolution were resampled and then spatially smoothed with a 7 × 7 × 7 mm3 FWHM kernel. The fMRI images from Cohort 2 which were acquired at 3 × 3 × 4 mm3 were resampled and then spatially smoothed with a 6 × 6 × 6 mm3 FWHM kernel. The normalized fMRI time series for both cohorts were then low pass filtered at a cutoff frequency of 0.1 Hz (Cordes et al., 2001).
Eight regions of interest described in the following section and in Table 1 were applied to each of the two fMRI processed image series to yield an average time series for each region for each fMRI series for each subject. Each time series was high pass filtered at 0.0067 Hz. In order to combine the right TLE and the left TLE patients, the regions were converted from designations of left and right to ipsilateral and contralateral referring to the side of seizure focus. No image flipping was performed. In the healthy controls, the side of seizure focus for the purpose of this work was labeled the same as the age and gender matched patient. In addition, the average fMRI time series in the white matter and cerebrospinal fluid as determined by the segmentation of the spatially normalized T1 weighted image were computed for each subject. All pair-wise functional connectivity measures were computed by performing the partial correlation of the average time series of each pair of regions while controlling for the signal in the cerebrospinal fluid (Cohort 1 only due to lack of physiological monitoring), the white matter time series and the six motion time series for each fMRI series. The correlation coefficients were converted to Z values using the Fisher Z transform (Fisher, 1915) and then averaged across the two series for each subject.
Table 1.
List of predictors included in the linear regression analysis
| Other Variables |
|---|
| age (yrs) |
| sz_free (yrs) |
| Functional Connectivity
| |
|---|---|
| Name | Freesurfer ID |
| hippocampus L,R | 17,53 |
| thalamus L,R | 10,49 |
| insula L,R | 1035,2035 |
| precuneus (bilateral) | 1025&2025 |
| mid cingulate (anterior cingulate and anterior ½ of posterior cingulate) | 1002&2002& anterior ½ 1023&2023 |
| Gray Matter Volumes (mm3)
| |
|---|---|
| Name | FreeSurfer ID |
| thalamus L,R | 10,49 |
| hippocampus L,R | 17,53 |
| insula L,R | 1036,2035 |
| pallidum L,R | 13,52 |
| putamen L,R | 12,51 |
| caudate L,R | 11,50 |
| precuneus L,R | 1025,2025 |
| entorhinal cortex L,R | 1006,2006 |
| anterior cingulate L,R | 1002,2002 |
| supratentorial | |
sz_free=longest seizure free interval; L=left; R=right; functional connectivity was calculated for all pairs of the listed regions; the bilateral precuneus region combined both left and right side into a single region for functional connectivity; the mid cingulate included both the bilateral anterior cingulate and the anterior half of the bilateral posterior cingulate for functional connectivity;
2.4 Structural Image Processing
The T1-weighted images with isotropic voxels were parcellated into cortical regions using FreeSurfer (5.1.0), an intensity based surface reconstruction software program (http://surfer.nmr.mgh.harvard.edu/). The technical details of this procedure have been previously described (Dale et al., 1999; Fischl et al., 2004). All FreeSurfer results were visually inspected for accuracy. There were no obvious errors and so all datasets were kept in the analysis without edits. The images were also segmented into gray matter, white matter and cerebrospinal fluid using the software. From this analysis, the gray matter volume of each parcel of the brain is reported.
2.5 Predictors
The FreeSurfer segmentation process was used to define eight regions of interest including the left and right hippocampus, left and right thalamus, left and right insula, cingulate and precuneus across which to investigate functional connectivity (Morgan et al., 2014). The functional connectivity measures between all possible pairs of these eight regions were used as predictors of duration of disease in the linear regression modeling (28 different paths). The gray matter volumes of these regions and those of other regions in the basal ganglia were used as the volumetric predictors in the linear regression modeling (18 regions). The supratentorial volume is a parameter calculated by FreeSurfer that includes the entire volume of the cerebrum including gray matter, white matter, cerebrospinal fluid and vessels. We included this volume as a general measure of brain size. In addition, the age of the subject and the longest seizure free interval were also included as predictors. This resulted in 49 potential predictors (see Table 1) to be explored using the linear regression modeling. These regions were chosen based on a priori hypotheses of TLE seizure propagation (Morgan et al., 2014), rather than including all regions available through FreeSurfer segmentation.
2.6 Lasso Regression
We hypothesized that there are volumetric and functional connectivity measures that change linearly over time with duration of disease in TLE. The linear regression model is a method used to determine the linear relationship between one or more predictors x1… xp and a response y as described by the following equation:
| (1) |
by computing the model coefficients β0 … βp which minimize the sum of the squared difference between y and the estimated response Xβ. In this study, the predictors x are the volumetric and functional connectivity measures in a population of TLE patients, while the response y is the duration of disease in each subject. We used linear modeling to find the model coefficients β which represent the weight of how each predictor linearly relates to duration. One of the restrictions of using the traditional ordinary least squares solution requires approximately 10 data samples for every predictor to avoid “overfitting” the data (Concato et al., 1993). For this study, we have 53 data samples (subjects) and so would only be able to examine five predictors. Therefore, we have implemented the lasso regression methodology (Carroll et al., 2009; Zou and Hastie, 2005) using Matlab (The Mathworks, Inc. Natick, MA). This method allows for very large predictor sets with smaller sample sizes by using regularization parameters. In this work, the sparsity parameter, known as the L1-norm, which helps to reduce the final number of non-zero β values (i.e. predictors in the final model), was included. The new minimization equation becomes (Carroll et al., 2009; Zou and Hastie, 2005):
| (2) |
The algorithm optimizes the β and λ values and performed a 10-fold cross validation procedure with one hundred Monte-Carlo repetitions for each cross validation. The entire process yielded a set of weights, β, with a minimum mean squared error for the cross validation at the optimum λ values creating a final model to predict duration of disease.
The subjects were divided into two groups. The training group subjects were used in the lasso regression to compute the model parameters for estimating duration of disease, and included the majority of the data samples. Then this final model was applied to a small independent test group and the accuracy was calculated. Both the training group and the test group included patients from Cohort 1 and patients and healthy controls from Cohort 2. Both left and right TLE patients were included with the intent in determining a general model. Healthy controls were used with a duration of disease of 0 years to help control for the age confound and to force the model to distinguish between patients and controls.
2.7 Univariate Analyses
To understand the relationship of the predictors identified by the model and duration of disease, a Pearson’s correlation with each predictor was determined across the training group. Similarly, the correlation with age of each predictor was also calculated since age may be a significant confound, especially in the volume measures. A two sample t-test was used to compare the measures in the healthy controls to those in the TLE patents for each predictor identified by the model. A paired t-test was used to compare the predictor values between the ipsilateral and contralateral hemispheres of the patients, excluding the healthy controls.
2.8 Laterality Analyses
In order to determine whether the duration changes identified by the model were bilateral, the duration of disease for each subject was determined by using the opposite side predictors (i.e. contralateral for ipsilateral predictors) in the final model. The “contralateral” estimation of duration of disease was compared to the modeled estimate of duration of disease across all patients (not including the healthy controls) using a paired t-test.
Results
The initial modeling process using all subjects was unsuccessful in finding parameters that accurately predicted the duration of disease in a linear fashion across the entire duration range from 3 to 50 years. In that trial, we used 32 subjects in the training group (8 from Cohort 1; 24 from Cohort 2 including 12 controls) and 21 in the test group (4 from Cohort 1; 17 from Cohort 2 including 8 controls). The residuals of the estimation were highly linear and the mean squared error of the model was 13.9 years. We also found that the parameters identified in that model were significantly correlated with age. Across these 32 test subjects, the correlation between age and duration of TLE was highly significant (p<0.01).
We then performed the lasso linear regression on 35 subjects which had durations of disease in the range 10 years < duration < 35 years, based on the hypothesis that the impact of the initial genesis of the seizures may not be linear, and the longest duration subjects may have significant age related confounds. The training group included 25 subjects (4 from Cohort 1; 21 from Cohort 2 including 14 controls). The test group included 6 controls and 3 patients from Cohort 2 and 1 patient from Cohort 1. Note, that there were 18 subjects not included in either group with durations outside of our range of interest. The results presented throughout are from this analysis. There was no significant correlation between age and duration of TLE in the 25 training subjects in this analysis.
The final model to predict duration of TLE from 10 to 35 years used 6 parameters, including three functional connectivity measures involving the ipsilateral temporal lobe and three ipsilateral volumes. The predictor parameters and the β values for the final model equation to estimate duration of disease are given in Table 2. The root mean squared error (RMSE) of this model in the training data is 3.6 years (5.1 years for Cohort 1, 3.1 years for Cohort 2), while in the ten test subjects it is 3.3 years. Figure 1 shows the model estimated duration of disease vs. the known duration (with controls at zero). The training group subjects are given in blue, the test group in red, the short duration subjects (< 10 years) not used in the training group in green, and the long duration subjects (> 35 years) not used in the training group in orange. The model estimated duration of disease across the 25 training subjects is significantly correlated with the known duration of disease (p<0.001), and the estimation of duration for the TLE patients is greater than for the controls (p<0.001) [95% confidence interval = 10.7 16.3 years]. From Figure 1, it is clear that these parameters of the final model are not linearly related to duration in the longer duration patients.
Table 2.
Predictors of duration of disease in TLE determined by linear regression
| Predictor | weight β# | corr with duration (p)* | corr with age (p)* | t-test patients vs. controls (p,CI)* | t-test ipsi vs. contra (p)** |
|---|---|---|---|---|---|
| I hippocampus – C hippocampus (FC) | −0.5024 | 0.001 | 0.57 | 0.003 [1.6 7.4] | na |
| I hippocampus - precuneus (FC) | −0.8642 | <0.001 | 0.32 | <0.001 [2.6 7.4] | 0.004 [−5.0 −1.1] |
| I insula – mid cingulate (FC) | −0.3850 | <0.001 | 0.07 | <0.001 [2.4 7.0] | 0.11 [−4.1 0.4] |
| I thalamus (vol) | 0.0002 | 0.26 | 0.03 | 0.53 [−1079 575] | 0.66 [−320 502] |
| I hippocampus (vol) | −0.0026 | <0.001 | 0.47 | <0.001 [678 1725] | 0.006 [−1398 −289] |
| I pallidum (vol) | −0.0073 | 0.002 | 0.01 | 0.01 [59 450] | 0.24 [−274 79] |
I = ipsilateral to seizure focus; C = contralateral to seizure focus; FC = functional connectivity between the two regions; vol = volume in mm3; corr = Pearson’s correlation ;
denotes that the β is multiplied by the FC value (Z value) or the volume in mm3;
denotes two sample t-test with n = 25 (training group) used for this calculation;
denotes paired t-test with n = 11 (TLE only in training group) used for this calculation; 95% confidence interval of control-patients or ipsi-contra in []
Figure 1.
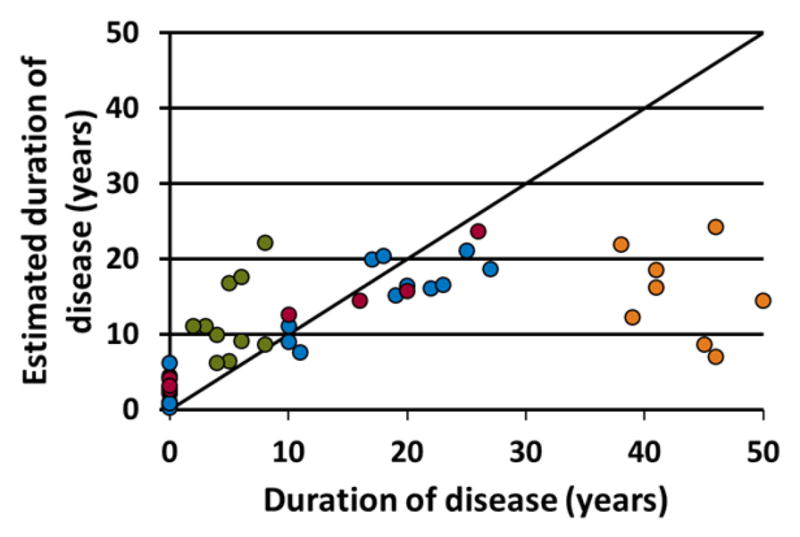
The duration of disease estimated by the linear model using the predictors and weights in Table 2 in relation to the known duration of disease. The blue points represent the 25 training subjects used to define the model. The red points are the 10 test subjects. The TLE patients with duration of disease less than 10 years (green) and greater than 35 years (orange) are also shown. These were not used to calculate the model. The healthy controls are shown at a duration of 0 years.
The results of the univariate analyses are provided in Table 2. All three functional connectivity predictors decreased linearly with increased duration of disease in the training group. The volumes of the ipsilateral hippocampus and pallidum decreased linearly with increasing duration, while the ipsilateral thalamus did not correlate significantly with duration. No predictors linearly correlated with age (p<0.01), as intended by the inclusion of age as one of the 49 potential predictors in the model, by adding the controls of the same ages in the training group, and by limiting the duration range from 10 to 35 years. All three of the functional connectivity predictors, as well as the volume of the ipsilateral hippocampus, were significantly lower in the TLE patients than in the healthy controls (p<0.01).
The duration estimate was also calculated using by substituting the contralateral values with no change in parameter for the ipsilateral to contralateral hippocampal functional connectivity. This contralateral estimate is significantly decreased compared to the estimated duration of disease using the ipsilateral parameters from the model (p<0.001) [95% confidence interval = 2.5 5.8 years]. When comparing the estimation with the contralateral values in the TLE patients to the estimation in the healthy controls, there was a significant increase in the patients (p<0.001) [95% confidence interval = 5.2 11.7 years]. The relationship between difference between the ipsilateral and contralateral estimates for each subject and the duration of disease is given in Figure 2. The same colors are used as described for Figure 1.
Figure 2.
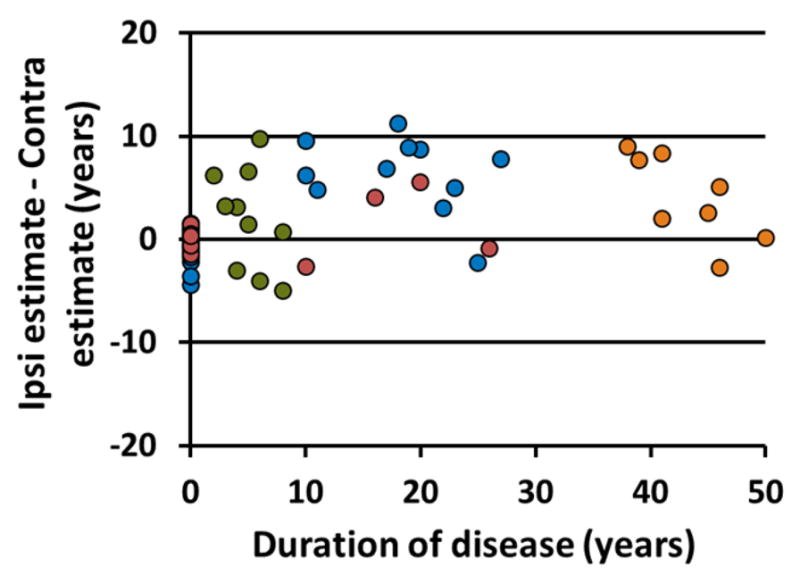
Difference between duration of disease estimate using ipsilateral parameters identified by the model and their contralateral homologues in relation to the known duration of disease. The blue points represent the 25 training subjects used to define the model. The red points are the 10 test subjects. The TLE patients with duration of disease less than 10 years (green) and greater than 35 years (orange) are also shown. These were not used to calculate the model. The healthy controls are shown at a duration of 0 years.
Discussion
In this study, lasso multivariate linear regression was used to determine a small set of volumetric and functional parameters that evolve linearly between 10 and 35 years of duration of TLE. Three functional connectivity measures were negatively correlated with duration: ipsilateral hippocampus to the contralateral hippocampus, ipsilateral hippocampus to the precuneus, and ipsilateral insula to the mid cingulate. The gray matter volumes of the ipsilateral hippocampus and pallidum were also negatively correlated with duration. The pallidum is less frequently associated with TLE, but there is evidence of decreased volumes ipsilateral to the seizure focus (Dreifuss et al., 2001), and for its involvement in the propagation of seizures out of the ipsilateral temporal lobe (Rektor et al., 2011).
It is not surprising that the ipsilateral hippocampus has been identified as both a volumetric and functional predictor of duration of TLE. This structure is known to play a critical role in the epileptogenic process and atrophy of this structure is well documented (Bernasconi et al., 2005; Labate et al., 2008). This atrophy has been used to correctly lateralize TLE with 94% classification accuracy (Farid et al., 2012). Decreases in ipsilateral hippocampal functional connectivity to the precuneus (Haneef et al., 2014; Pittau et al., 2012) and to the contralateral hippocampus have been reported in TLE (Maccotta et al., 2013; Pereira et al., 2010).
The ipsilateral thalamus was included in the model with a positive beta weight ten times smaller than that of the other volumes. The thalamus volume was not significantly correlated with duration, nor was it significantly different between the patients and controls. One possible reason for its positive beta weight is the inclusion of one patient with a duration of 23 years with a volume approximately 60% higher than the other patients. When including this subject, the correlation between duration and volume is not significant and positive (r = 0.23, p = 0.26), while without this subject the correlation is slightly negative (r = −0.03, p = 0.86). A decrease in thalamic volume related to duration of TLE has been reported (Pulsipher et al., 2007), while others only found a decrease in patients but no relationship to duration (Szabo et al., 2006). Our results were not consistent with these findings.
Increased connectivity between the ipsilateral hippocampus and insula (Fahoum et al., 2012; Maccotta et al., 2013), its electrographic involvement during ictal events (Blauwblomme et al., 2013; Isnard et al., 2000), and other neuroimaging studies (Chassoux et al., 2004; Kim et al., 2008) suggest that the insula is an integral part of the ipsilateral epileptogenic network with the hippocampus. The decreased functional connectivity between the insula and the mid cingulate, as well as the decrease in connectivity between the hippocampus and precuneus, may signify a network of propagation out of the temporal lobe during secondary generalization of TLE seizures (Blumenfeld et al., 2009; Fahoum et al., 2012; Yu and Blumenfeld, 2009).
We performed two different model validation procedures. The first is the Monte-Carlo cross validation process within the model estimation using the training group. This procedure is one way to predict the general applicability of the identified model. Second, we applied the final model estimated from the first process to a small independent test group. This group was smaller than expected due to the restricted duration range of the analyses. However, Figure 1 shows that the test group had similar accuracy as the training group across the durations of disease and showed a difference between the controls (at zero) and the patients. Furthermore, the RMSE between the training and test groups were similar.
To determine the effect of laterality in the model, the duration estimate was calculated using the contralateral measures of the same parameters. The contralateral estimate was reduced in the TLE patients (p<0.001), but greater than the controls (where the ipsilateral side was chosen arbitrarily) (p<0.001). Figure 2 shows that the decrease in the contralateral side (points above zero) is not dependent on duration (p = 0.54). At close examination we found that four of the seven points below zero on the plot were from subjects with left sided seizure foci. However, three other subjects in the 10–35 years duration group that had decreased estimate in the contralateral side were left sided TLE, as well as three in the greater than 35 years duration group and one in the less than 10 years duration group. These results suggest that the TLE affects both hemispheres of the brain in a similar manner, but the effect on the ipsilateral hemisphere may be more severe. This estimate may provide complementary information in determining laterality of TLE, but more subjects with both left and right TLE are needed to verify this finding.
The use of two different cohorts of patient for this study is both a limitation and an advantage. The limitation is that there are differences in noise between the two methods of functional acquisition and processing which will decrease the power in the model. The advantage of using two different cohorts is that the result is more generalizable across fMRI methods. We found a slightly larger RMSE in Cohort 1 compared to Cohort 2 (3.2 years vs. 5.1 years) which is not unexpected when considering more of the training subjects came from cohort 1. Similarly, the inclusion of both left and right TLE patients in the modeling process increases sample size and power, but also increases noise because left and right TLE are known to have unique effects on the brain, specifically that structural and functional alterations are more extensive in left TLE (Haneef et al., 2014; Kemmotsu et al., 2011; Li et al., 2012). By combining the two types we are able to detect the similarities between them, which may be why our model does not include contralateral measures expected to be more prominent in left TLE as opposed to right TLE. We have assumed unilateral TLE based on presurgical evaluations, but 5 of the 27 patients have no post-surgical seizure outcome information available at this time to confirm this assumption.
Another limitation of this study is the use of the years of duration as a marker for seizure burden. Since the frequency of seizures is not constant across subjects or across time in the subjects, the seizure burden is not directly linearly related to years of duration. Using the years of duration as an estimate confounds the effects of the seizures and of the pathophysiology of the disease itself. Future studies may attempt to separate these two effects. Interestingly, the volume loss in the ipsilateral hippocampus and pallidum was found not to be heritable in a population of TLE patients and their siblings (Alhusaini et al., 2013), supporting the idea that the effects are primarily driven by repeated seizures. The advantage of using duration of disease in this study is that the subjects had a wide range of durations from 3 to 50 years.
Conclusions
Linear regression modeling was used to compute a model of six functional and volumetric parameters that most accurately and efficiently predict duration of disease in TLE from a pool of 49 parameters. More specifically, a combination of parameters was identified that were significantly reduced in TLE patients after 10 years and continued to gradually decrease over the next 25 years duration, presumably due to repeated seizure activity. These parameters include reductions in functional connectivity from the ipsilateral temporal lobe to the contralateral temporal lobe, precuneus and mid cingulate, and decreases in volume of the ipsilateral hippocampus and pallidum. Overall, these findings suggest that TLE is associated with a gradual functional isolation and significant progressive structural atrophy of the ipsilateral temporal lobe over years of duration. Furthermore, these changes can also be detected in the contralateral hemisphere in these patients, but to a lesser a degree. Future work may focus on how various treatments can affect this trajectory, and how it relates to clinical and behavioral outcomes.
Highlights.
Gray matter volume and functional connectivity were related to duration of TLE.
Ipsilateral temporal lobe functional isolation increased with years of duration.
Ipsilateral temporal lobe volume gradually atrophied over years of duration.
The changes were also detected in the contralateral hemisphere to a lesser degree.
Acknowledgments
This work was supported in part by NIH R01 NS055822 and R01 NS075270. In addition, the authors are grateful to Robert Barry, Ph.D. for his assistance and programming of the RETROICOR physiological noise correction of the fMRI images.
Footnotes
Publisher's Disclaimer: This is a PDF file of an unedited manuscript that has been accepted for publication. As a service to our customers we are providing this early version of the manuscript. The manuscript will undergo copyediting, typesetting, and review of the resulting proof before it is published in its final citable form. Please note that during the production process errors may be discovered which could affect the content, and all legal disclaimers that apply to the journal pertain.
References
- Alhusaini S, Doherty CP, Scanlon C, Ronan L, Maguire S, Borgulya G, et al. A cross-sectional MRI study of brain regional atrophy and clinical characteristics of temporal lobe epilepsy with hippocampal sclerosis. Epilepsy Research. 2012;99:156–166. doi: 10.1016/j.eplepsyres.2011.11.005. [DOI] [PubMed] [Google Scholar]
- Alhusaini S, Scanlon C, Ronan L, Maguire S, Meaney JF, Fagan AJ, et al. Heritability of Subcortical Volumetric Traits in Mesial Temporal Lobe Epilepsy. Plos One. 2013;8:8. doi: 10.1371/journal.pone.0061880. [DOI] [PMC free article] [PubMed] [Google Scholar]
- Ashburner J, Friston KJ. Voxel-based morphometry - The methods. Neuroimage. 2000;11:805–821. doi: 10.1006/nimg.2000.0582. [DOI] [PubMed] [Google Scholar]
- Bernasconi N, Duchesne S, Janke A, Lerch J, Collins DL, Bernasconi A. Whole-brain voxel-based statistical analysis of gray alter and white matter in temporal lobe epilepsy. Neuroimage. 2004;23:717–723. doi: 10.1016/j.neuroimage.2004.06.015. [DOI] [PubMed] [Google Scholar]
- Bernasconi N, Natsume J, Bernasconi A. Progression in temporal lobe epilepsy -Differential atrophy in mesial temporal structures. Neurology. 2005;65:223–228. doi: 10.1212/01.wnl.0000169066.46912.fa. [DOI] [PubMed] [Google Scholar]
- Bernhardt BC, Worsley KJ, Kim H, Evans AC, Bernasconi A, Bernasconi N. Longitudinal and cross-sectional analysis of atrophy in pharmacoresistant temporal lobe epilepsy. Neurology. 2009;72:1747–1754. doi: 10.1212/01.wnl.0000345969.57574.f5. [DOI] [PMC free article] [PubMed] [Google Scholar]
- Bettus G, Guedj E, Joyeux F, Confort-Gouny S, Soulier E, Laguitton V, et al. Decreased basal fMRI functional connectivity in epileptogenic networks and contralateral compensatory mechanisms. Hum Brain Mapp. 2009;30:1580–91. doi: 10.1002/hbm.20625. [DOI] [PMC free article] [PubMed] [Google Scholar]
- Biswal B, Yetkin FZ, Haughton VM, Hyde JS. Functional connectivity in the motor cortex of resting human brain using echo-planar MRI. Magn Reson Med. 1995;34:537–41. doi: 10.1002/mrm.1910340409. [DOI] [PubMed] [Google Scholar]
- Blauwblomme T, David O, Minotti L, Job AS, Chassagnon S, Hoffman D, et al. Prognostic value of insular lobe involvement in temporal lobe epilepsy: A stereoelectroencephalographic study. Epilepsia. 2013;54:1658–1667. doi: 10.1111/epi.12260. [DOI] [PubMed] [Google Scholar]
- Blumenfeld H, Varghese GI, Purcaro MJ, Motelow JE, Enev M, McNally KA, et al. Cortical and subcortical networks in human secondarily generalized tonic-clonic seizures. Brain. 2009;132:999–1012. doi: 10.1093/brain/awp028. [DOI] [PMC free article] [PubMed] [Google Scholar]
- Burdenski T. Evaluating Univariate and Bivariate Normality Using Graphical Procedures. Evaluating Normality Multiple Linear Regression Viewpoints. 2000;26:15–28. [Google Scholar]
- Carroll MK, Cecchi GA, Rish I, Garg R, Rao AR. Prediction and interpretation of distributed neural activity with sparse models. Neuroimage. 2009;44:112–122. doi: 10.1016/j.neuroimage.2008.08.020. [DOI] [PubMed] [Google Scholar]
- Chassoux F, Semah F, Bouilleret V, Landre E, Devaux B, Turak B, et al. Metabolic changes and electro-clinical patterns in mesio-temporal lobe epilepsy: a correlative study. Brain. 2004;127:164–74. doi: 10.1093/brain/awh014. [DOI] [PubMed] [Google Scholar]
- Coan AC, Campos BM, Yasuda CL, Kubota BY, Bergo FPG, Guerreiro CAM, et al. Frequent Seizures Are Associated with a Network of Gray Matter Atrophy in Temporal Lobe Epilepsy with or without Hippocampal Sclerosis. Plos One. 2014;9:9. doi: 10.1371/journal.pone.0085843. [DOI] [PMC free article] [PubMed] [Google Scholar]
- Concato J, Feinstein AR, Holford TR. The risk of determining risk with multivariable models. Ann Intern Med. 1993;118:201–10. doi: 10.7326/0003-4819-118-3-199302010-00009. [DOI] [PubMed] [Google Scholar]
- Cordes D, Haughton VM, Arfanakis K, Carew JD, Turski PA, Moritz CH, et al. Frequencies contributing to functional connectivity in the cerebral cortex in “resting-state” data. AJNR Am J Neuroradiol. 2001;22:1326–33. [PMC free article] [PubMed] [Google Scholar]
- Dale AM, Fischl B, Sereno MI. Cortical surface-based analysis - I. Segmentation and surface reconstruction. Neuroimage. 1999;9:179–194. doi: 10.1006/nimg.1998.0395. [DOI] [PubMed] [Google Scholar]
- Dreifuss S, Vingerhoets FJG, Lazeyras F, Andino SG, Spinelli L, Delavelle J, et al. Volumetric measurements of subcortical nuclei in patients with temporal lobe epilepsy. Neurology. 2001;57:1636–1641. doi: 10.1212/wnl.57.9.1636. [DOI] [PubMed] [Google Scholar]
- Fahoum F, Lopes R, Pittau F, Dubeau F, Gotman J. Widespread epileptic networks in focal epilepsies: EEG-fMRI study. Epilepsia. 2012;53:1618–1627. doi: 10.1111/j.1528-1167.2012.03533.x. [DOI] [PMC free article] [PubMed] [Google Scholar]
- Farid N, Girard HM, Kemmotsu N, Smith ME, Magda SW, Lim WY, et al. Temporal Lobe Epilepsy: Quantitative MR Volumetry in Detection of Hippocampal Atrophy. Radiology. 2012;264:542–550. doi: 10.1148/radiol.12112638. [DOI] [PMC free article] [PubMed] [Google Scholar]
- Fischl B, van der Kouwe A, Destrieux C, Halgren E, Segonne F, Salat DH, et al. Automatically parcellating the human cerebral cortex. Cerebral Cortex. 2004;14:11–22. doi: 10.1093/cercor/bhg087. [DOI] [PubMed] [Google Scholar]
- Fisher RA. Frequency Distribution of the Values of the Correlation Coefficient in Samples from an Indefinitely Large Population. Biometrika. 1915;10:507–521. [Google Scholar]
- Glover GH, Li TQ, Ress D. Image-based method for retrospective correction of physiological motion effects in fMRI: RETROICOR. Magn Reson Med. 2000;44:162–7. doi: 10.1002/1522-2594(200007)44:1<162::aid-mrm23>3.0.co;2-e. [DOI] [PubMed] [Google Scholar]
- Haneef Z, Lenartowicz A, Yeh HJ, Levin HS, Engel J, Stern JM. Functional connectivity of hippocampal networks in temporal lobe epilepsy. Epilepsia. 2014;55:137–145. doi: 10.1111/epi.12476. [DOI] [PMC free article] [PubMed] [Google Scholar]
- Holmes MJ, Folley BS, Sonmezturk HH, Gore JC, Kang H, Abou-Khalil B, et al. Resting state functional connectivity of the hippocampus associated with neurocognitive function in left temporal lobe epilepsy. Human Brain Mapping. 2013a doi: 10.1002/hbm.22210. in press. [DOI] [PMC free article] [PubMed] [Google Scholar]
- Holmes MJ, Yang X, Landman BA, Ding Z, Kang H, Abou-Khalil B, et al. Functional networks in temporal-lobe epilepsy: a voxel-wise study of resting-state functional connectivity and gray-matter concentration. Brain Connect. 2013b;3:22–30. doi: 10.1089/brain.2012.0103. [DOI] [PMC free article] [PubMed] [Google Scholar]
- Isnard J, Guenot M, Ostrowsky K, Sindou M, Mauguiere F. The role of the insular cortex in temporal lobe epilepsy. Ann Neurol. 2000;48:614–23. [PubMed] [Google Scholar]
- Keller SS, Roberts N. Voxel-based morphometry of temporal lobe epilepsy: An introduction and review of the literature. Epilepsia. 2008;49:741–757. doi: 10.1111/j.1528-1167.2007.01485.x. [DOI] [PubMed] [Google Scholar]
- Kemmotsu N, Girard HM, Bernhardt BC, Bonilha L, Lin JJ, Tecoma ES, et al. MRI analysis in temporal lobe epilepsy: Cortical thinning and white matter disruptions are related to side of seizure onset. Epilepsia. 2011;52:2257–2266. doi: 10.1111/j.1528-1167.2011.03278.x. [DOI] [PMC free article] [PubMed] [Google Scholar]
- Kim BJ, Hong SB, Seo DW. Differences in ictal hyperperfusion of limbic-related structures between mesial temporal and neocortical epilepsy. Epilepsy Res. 2008;81:167–75. doi: 10.1016/j.eplepsyres.2008.05.010. [DOI] [PubMed] [Google Scholar]
- Labate A, Cerasa A, Gambardella A, Aguglia U, Quattrone A. Hippocampal and thalamic atrophy in mild temporal lobe epilepsy: a VBM study. Neurology. 2008;71:1094–101. doi: 10.1212/01.wnl.0000326898.05099.04. [DOI] [PubMed] [Google Scholar]
- Li JP, Zhang ZB, Shang HF. A meta-analysis of voxel-based morphometry studies on unilateral refractory temporal lobe epilepsy. Epilepsy Research. 2012;98:97–103. doi: 10.1016/j.eplepsyres.2011.10.002. [DOI] [PubMed] [Google Scholar]
- Maccotta L, He BJ, Snyder AZ, Eisenman LN, Benzinger TL, Ances BM, et al. Impaired and facilitated functional networks in temporal lobe epilepsy. Neuroimage Clin. 2013;2:862–72. doi: 10.1016/j.nicl.2013.06.011. [DOI] [PMC free article] [PubMed] [Google Scholar]
- McDonald CR, Hagler DJ, Ahmadi ME, Tecoma E, Iragui V, Dale AM, et al. Subcortical and cerebellar atrophy in mesial temporal lobe epilepsy revealed by automatic segmentation. Epilepsy Research. 2008;79:130–138. doi: 10.1016/j.eplepsyres.2008.01.006. [DOI] [PMC free article] [PubMed] [Google Scholar]
- Morgan VL, Abou-Khalil B, Rogers BP. Evolution of Functional Connectivity of Brain Networks and Their Dynamic Interaction in Temporal Lobe Epilepsy. Brain Connect. 2014 doi: 10.1089/brain.2014.0251. [DOI] [PMC free article] [PubMed] [Google Scholar]
- Obrig H, Neufang M, Wenzel R, Kohl M, Steinbrink J, Einhaupl K, et al. Spontaneous low frequency oscillations of cerebral hemodynamics and metabolism in human adults. Neuroimage. 2000;12:623–39. doi: 10.1006/nimg.2000.0657. [DOI] [PubMed] [Google Scholar]
- Ogawa S, Lee TM, Nayak AS, Glynn P. Oxygenation-sensitive contrast in magnetic-resonance image of rodent brain at high magnetic-fields. Magnetic Resonance in Medicine. 1990;14:68–78. doi: 10.1002/mrm.1910140108. [DOI] [PubMed] [Google Scholar]
- Pereira FRS, Alessio A, Sercheli MS, Pedro T, Bilevicius E, Rondina JM, et al. Asymmetrical hippocampal connectivity in mesial temporal lobe epilepsy: evidence from resting state fMRI. BMC Neuroscience. 2010;11:66. doi: 10.1186/1471-2202-11-66. [DOI] [PMC free article] [PubMed] [Google Scholar]
- Pittau F, Grova C, Moeller F, Dubeau F, Gotman J. Patterns of altered functional connectivity in mesial temporal lobe epilepsy. Epilepsia. 2012;53:1013–1023. doi: 10.1111/j.1528-1167.2012.03464.x. [DOI] [PMC free article] [PubMed] [Google Scholar]
- Pulsipher DT, Seidenberg M, Morton JJ, Geary E, Parrish J, Hermann B. MRI volume loss of subcortical structures in unilateral temporal lobe epilepsy. Epilepsy & Behavior. 2007;11:442–449. doi: 10.1016/j.yebeh.2007.08.007. [DOI] [PMC free article] [PubMed] [Google Scholar]
- Rektor I, Kuba R, Brazdil M, Halamek J, Jurak P. Ictal and peri-ictal oscillations in the human basal ganglia in temporal lobe epilepsy. Epilepsy & Behavior. 2011;20:512–517. doi: 10.1016/j.yebeh.2011.01.003. [DOI] [PubMed] [Google Scholar]
- Rogers BP, Morgan VL, Newton AT, Gore JC. Assessing functional connectivity in the human brain by fMRI. Magn Reson Imaging. 2007;25:1347–57. doi: 10.1016/j.mri.2007.03.007. [DOI] [PMC free article] [PubMed] [Google Scholar]
- Seidenberg M, Kelly KG, Parrish J, Geary E, Dow C, Rutecki T, et al. Ipsilateral and contralateral MRI volumetric abnormalities in chronic unilateral temporal lobe epilepsy and their clinical correlates. Epilepsia. 2005;46:420–430. doi: 10.1111/j.0013-9580.2005.27004.x. [DOI] [PubMed] [Google Scholar]
- Szabo CA, Lancaster JL, Lee S, Xiong JH, Cook C, Mayes BN, et al. MR imaging volumetry of subcortical structures and cerebellar hemispheres in temporal lobe epilepsy. American Journal of Neuroradiology. 2006;27:2155–2160. [PMC free article] [PubMed] [Google Scholar]
- Wiebe S, Blume WT, Girvin JP, Eliasziw M. A randomized, controlled trial of surgery for temporal-lobe epilepsy. N Engl J Med. 2001;345:311–8. doi: 10.1056/NEJM200108023450501. [DOI] [PubMed] [Google Scholar]
- Yu L, Blumenfeld H. Theories of impaired consciousness in epilepsy. Disorders of Consciousness. 2009;1157:48–60. doi: 10.1111/j.1749-6632.2009.04472.x. [DOI] [PMC free article] [PubMed] [Google Scholar]
- Zhang ZQ, Lu GM, Zhong Y, Tan QF, Liao W, Wang ZG, et al. Altered spontaneous neuronal activity of the default-mode network in mesial temporal lobe epilepsy. Brain Research. 2010;1323:152–160. doi: 10.1016/j.brainres.2010.01.042. [DOI] [PubMed] [Google Scholar]
- Zou H, Hastie T. Regularization and variable selection via the elastic net. Journal of the Royal Statistical Society Series B-Statistical Methodology. 2005;67:301–320. [Google Scholar]