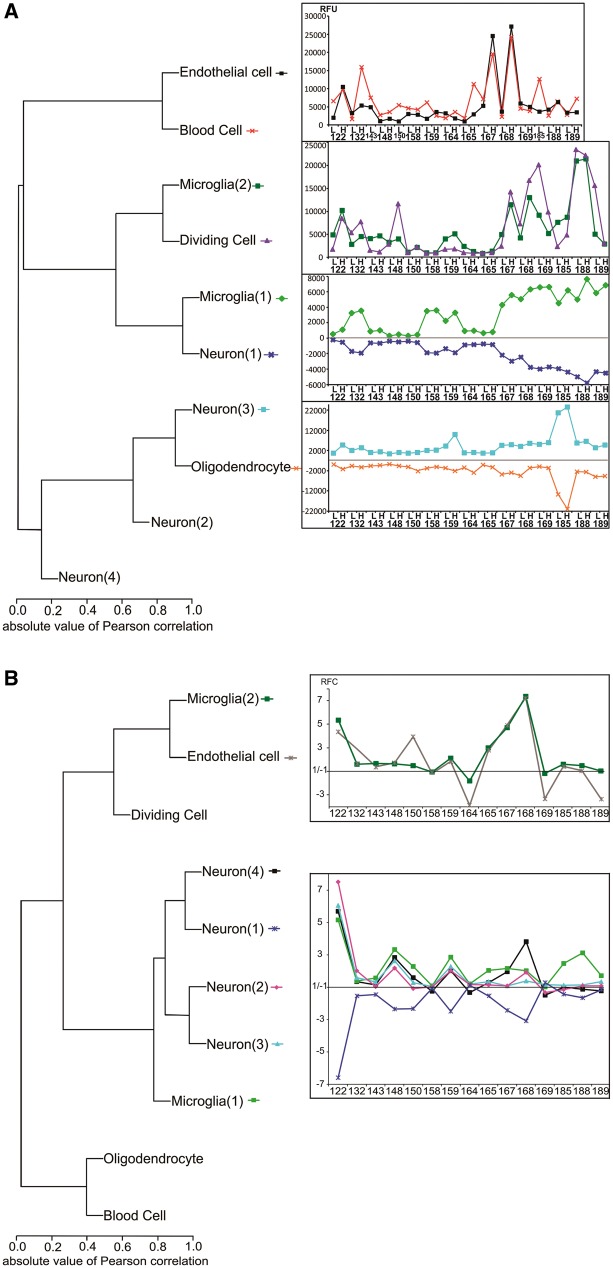
Figure 2.
Hierarchical clustering of assigned cell types predicts both parallel and reciprocal patterns of cellular changes in high-spiking human neocortex. (A) Hierarchical clustering of the predicted cell clusters using Pearson correlations were used to generate their corresponding profile from the average expression of genes within a given cluster. Dendrograms showing similar as well as reciprocal correlations between each cell cluster across patient samples are shown. For each patient sample, ‘L’ indicates low-spiking and ‘H’ high-spiking brain regions. To account for the downregulation of type 1 neurons and oligodendrocytes the values in low-spiking and high-spiking were inverted on the y-axis. (B) Hierarchical clustering of normalized fluorescence ratios between high and low spiking cell clusters segregated into two groups: (i) clustering of neuron types 1, 2, 3 and 4 with type 1 microglia; and (ii) clustering of endothelial cells and type 2 microglia. RFU = relative fluorescence unit; RFC = relative fold change. *This cluster has been computed after removing three samples (high-spiking regions from Patients 143, 150 and 185) because they showed aberrant blood contamination from surgery.

