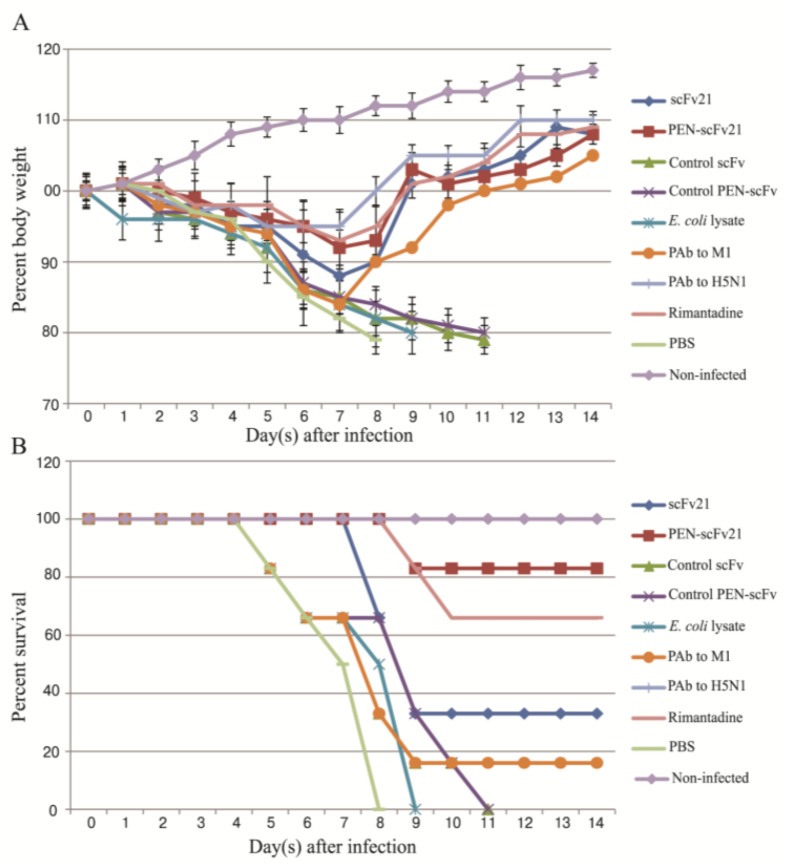
Figure 4.
Percent body weight (mean and SD) and survival of infected mice that received different treatments, i.e., scFv21, PEN-scFv21, control scFv, control PEN-scFv, E. coli lysate, PAb to M1, PAb to H5N1, rimantadine and PBS in comparison with the non-infected mice. (A) Percent body weight; (B) Percent survival.

