

Abstract
An obstacle detection task supported by “imperfect” automation was used with the goal of understanding the effects of automation error types and age on automation reliance. Sixty younger and sixty older adults interacted with a multi-task simulation of an agricultural vehicle (i.e. a virtual harvesting combine). The simulator included an obstacle detection task and a fully manual tracking task. A micro-level analysis provided insight into the way reliance patterns change over time. The results indicated that there are distinct patterns of reliance that develop as a function of error type. A prevalence of automation false alarms led participants to under-rely on the automation during alarm states while over relying on it during non-alarms states. Conversely, a prevalence of automation misses led participants to over-rely on automated alarms and under-rely on the automation during non-alarm states. Older adults adjusted their behavior according to the characteristics of the automation similarly to younger adults, although it took them longer to do so. The results of this study suggest the relationship between automation reliability and reliance depends on the prevalence of specific errors and on the state of the system. Understanding the effects of automation detection criterion settings on human-automation interaction can help designers of automated systems make predictions about human behavior and system performance as a function of the characteristics of the automation.
During unexpected circumstances, when automated systems are most likely to behave unreliably, an operator is still expected to act as a backup to detect failure events and act appropriately to avoid a system error. Therefore, when attempting to increase the performance of a human-automation system, increasing the reliability of the automated component is necessary but not sufficient. A crucial component to design of a successful human-automation system hinges on understanding and predicting human behavior in an automated environment. The objective of these studies was to understand the variables that influence reliance on automation: namely, error type, error distribution, age, and domain experience. While these factors have been investigated independently, they have yet to be weaved together into a cohesive research design. For instance, how does the dependence on different types of automation imperfections (e.g. miss vs. false alarms) vary as a function of age? Or is there a distinction between how novices versus individuals with domain experience interact with different types of automation imperfections? Most importantly, these factors investigated jointly benefit from a micro-level analysis enabling an understanding of how reliance is developed over time.
Distribution of Errors
To understand how individuals accumulate evidence about the automation’s reliability across time and how behavior is subsequently affected, it is critical to analyze this issue at a micro-level, where changes in behavior in small epochs of time can be observed. Ideally, all events—correct or incorrect—would be weighted equally, which would facilitate predictions about behavior associated with the use of automated decision support systems. However, it is likely that the weight assigned to each event changes as a function of experience with the system and the frequency of errors within a specific time. One reason why the weight assigned to each event can change is that the actual reliability of the system changes with each event and with time.
In studies investigating the effects of automation reliability on behavior (e.g., Bliss, Gilson & Deaton, 1995; Maltz & Shinar, 2004; Parasuraman, Molloy & Singh, 1993; Rovira, Zinni & Parasuraman, 2002; Sanchez, Fisk & Rogers, 2004; St. John & Manes, 2002; Vries, Midden & Bouwhuis, 2003; Wiegmann, Rich & Zhang, 2001), reliability was manipulated by changing the overall error rate of the automation. However, none of the aforementioned studies analyzed behavior as a function of the distribution of automation errors across the experimental session. Differences in reliance on automation may be a result of initial instructions and practice with imperfect support tools (Wickens & Xu, 2002). Therefore, we investigated performance with errors distributed in the first half, second half, and throughout the experiment. We were interested if after some exposure to the automation, if varying the distribution of automation errors across time would lead to differences.
Wickens and Xu (2002) argued that the first automation failure results in a more pronounced drop of trust and reliance on the automation than subsequent failures. Limited evidence supports the existence of the “first failure effect” and its impact on human-automation interaction (for evidence of the first failure effect see Molloy & Parasuraman, 1996; Rovira, McGarry, & Parasuraman, 2007; for evidence against it see Wickens, Helleberg & Xu, 2002). Nonetheless, the first failure effect suggests that the location of errors in time is an important component in human-automation interaction. Therefore, we were curious, if following exposure to imperfect automation would the introduction of an exception error (an automation error of a different type then previously experienced) induce the first failure effect? Therefore, a more detailed description of the types of automation errors will be provided
Type of Automation Error
A limited amount of research has specifically compared the differential effects of false alarms and misses on human behavior and overall system performance. Gupta, Bisantz and Singh (2001) compared the effects of false alarms and misses of an adverse condition warning system in a driving simulator. The threshold used to generate an auditory alarm was manipulated to either generate a high or a low number of false alarms relative to the number of misses. True alarms were meant to notify the driver of upcoming skids. It is worth noting that a false alarm in this study was defined as an alarm that sounded much sooner than necessary, whereas a miss was defined as an alarm that sounded, but was too late to allow operators to react in a safe and timely fashion. Therefore, from a Signal Detection Theory (SDT; Green & Swets, 1966) perspective there were no true automation false alarms or misses, rather, false alarms were early alarms and misses were late alarms. A pure automation false alarm would have consisted of a skid warning in the absence of conditions that would have led to a skid, and a pure automation miss would have consisted of a failure by the automation to provide a warning in the presence of skidding conditions. The results of Gupta et al. (2001) suggest that the condition with a higher false alarm (early) rate led to lower levels of subjective trust on the automation than the condition with a high miss (late alarm) rate. This finding is consistent with the suggestion that the nuisance associated with false alarms leads to lower levels of subjective trust relative to misses (Breznitz, 1984).
In another driving study, Cotte, Meyer, and Coughlin (2001) manipulated the criterion of a collision detection system, while holding the sensitivity of the system constant. In this study, misses by the automation meant no alarm was generated in the presence of an obstacle, whereas false alarms occurred when the alarm became active in the absence of an obstacle. In the condition with high false alarm rates, the average driving speed was significantly faster than in the high miss rate condition. This difference in driving speed increased throughout the experimental session. These results suggest that drivers in the high false alarm rate condition became aware that while the system was likely to generate false alarms it would not miss much; therefore, they could increase their driving speed with a high degree of confidence that if an obstacle appeared the system would not miss it. Conversely, the slower driving behavior by participants in the high miss rate condition suggests that they adopted a more conservative behavior as a function of the automation’s criterion.
Because the actual and perceived costs of false alarms and misses can vary greatly, it is worth noting that neither Gupta et al. (2001) nor Cotte et al. (2001) provided participants with an explicit payoff structure associated with the task. The payoff structure could considerably influence the effect that each error type has on behavior. For example, if the cost of an error is high (e.g., missile detection system), even with a high false alarm rate operators will likely verify all alarms instead of responding to some and ignoring others. Conversely, if there is not a high cost associated with errors (e.g., browsing to a “non-secure” website), operators might be more likely to ignore most alarms, whether true or false. Contrary to the findings of Gupta et al. and Cotte et al., Maltz and Shinar (2004) found that false alarms of collision avoidance systems do cause drivers to slow down unnecessarily, whereas high miss rates do not demonstrate a significant change in driving behavior.
In a study that did equate the outcome cost of false alarms and misses, Lehto, Papastavrou, Ranney, and Simmons (2000) used a decision aid that notified drivers when it was safe to pass a vehicle. Participants were rewarded $0.20 for successfully passing and were penalized $0.10 for unsafe passing attempts and missed passing opportunities. Their results indicated that a high false alarm rate was more detrimental to performance (measured in monetary earnings) than a system with no false alarms and a few misses. However, in this study, the criterion of the system was confounded by the sensitivity of the decision aid, which means the condition with no false alarms had a higher level of reliability than the condition with the high false alarm rate (~90% and ~70%, respectively). This disparity in the sensitivity of the decision aid across conditions makes any conclusions about differences in behavior as a function of error type difficult to discern. Furthermore, direct measures of reliance and subjective trust were not reported.
In a study by Dixon and Wickens (2003), error type was manipulated in an unmanned aerial vehicle (UAV) simulation. In this multi-task environment, participants were required to detect system failures (visible in a gauges display) with the assistance of an automated alarm while performing a tracking task and a target search task. Their experiment included conditions in which the automation was 100% reliable, 67% reliable (all misses), 67% reliable (all false alarms), and a control group with no automation. In this study, the 100% reliable automation improved performance across all tasks relative to the no automation condition. For the 67% reliable conditions, detection of system failures was worse in the false alarm condition than in the miss condition, suggesting that participants experiencing all false alarms began to ignore most of the alarms therefore missing a considerable number of system failures.
Dixon and Wickens (2003) also found that in the miss condition, performance in one of the concurrent tasks (identifying targets of opportunity) was significantly lower than in the false alarm condition. This effect of error type on concurrent task performance suggests that participants in the miss condition were paying more attention to the gauges and neglected some of the concurrent tasks. It also suggests that, because the participants in the miss condition had to monitor the gauges more often, the level of workload in this condition might have been higher.
In an extension of the 2003 study, Dixon and Wickens (2004) used a similar task. They included a mostly misses condition (3 misses, 1 false alarm), a mostly false alarms condition (3 false alarms, 1 misses) and a balanced condition (1 miss, 1 false alarm). One of the more compelling findings in this study was that the average reaction time to respond to alarms was significantly lower in the mostly miss condition than in the mostly false alarms condition. This difference suggests that participants in the mostly misses condition reacted to alarms without verifying whether they were going to make the right choice or not, whereas participants in the mostly false alarms condition verified the alarm before correcting the failure. Again, these results suggest a difference in the way operators monitor an automated aid as a function of prevalence of automation error type.
The subjective trust ratings in the Dixon and Wickens (2004) study did not differ as a function of prevalence of automation error type and were fairly close to the actual reliability of the automation. However, in this study participants were informed a priori about the range of reliability levels and about the criterion setting of the automation. This information, in part, may have influenced participants’ behavior and subjective assessments. Furthermore, the authors did not report whether the different patterns of behavior as a result of error type were evident from the onset of the experiment or if they developed as a result of experience.
The efforts of Dixon and Wickens (2003; 2004) suggest that each type of automation error affects the way attention is allocated in multi-task environments where verification information is available. However, the measures used in their studies did not directly assess the monitoring behavior associated with the automation-supported task. Rather, assumptions about where attention was allocated were made by examining the performance across various tasks. A similar criticism can be made of the driving simulator experiments, where inferences about the allocation of attention were made by examining speed control, but no direct evidence of different monitoring behaviors as a function of error type was offered (e.g., Cotte et al., 2001; Gupta et al., 2001; Maltz & Shinar, 2004).
Age-Related Factors in Human-Automation Interaction
The pervasive use of technology in a variety of everyday tasks as well as the workplace demonstrates the need from both a safety and practical perspective to understand how older adults interact with automation. Additionally, as a result of the aging of the Baby Boomers, the proportion of the population in the U.S. aged 65 or older is projected to increase from roughly 12% in 2000 to 19% in 2030 (CDC, 2003). While changes in cognition that result from normal cognitive aging have been examined extensively in research that compares performance between young and older adults on basic psychological tasks in the lab, there is far less known about older adult interaction with automation. Age related performance declines in divided attention, task switching, processing speeds, and working memory (Craik & Salthouse, 1992; McDowd & Shaw, 2000) may have implications for older adult interaction with automation. For instance, does memory decrement impact older adults ability to accurately update their knowledge of the automation’s reliability?
Alternatively, some have suggested that the acceptance and likelihood of using new technologies decreases with age (Kantowitz et al., 1993). More recently, research has demonstrated that older adults tend to have a positive attitude towards technology but underutilize smart technology because they lack perceived need, lack knowledge of devices, and perceive the cost to be prohibitive (Mann, Belchior, Tomita, & Kemp, 2007). This occurs even when older adults likely need assistive technologies. Understanding how automation usage differs as a function of age is critical towards ensuring that older adults benefit from support of technology.
In a study of visual detection in a luggage screening task, McCarley, Wiegmann, Wickens, and Kramer (2003) found that younger adults benefited from an automated aid by increasing their sensitivity relative to the non-automated condition. However, older adults’ detection sensitivity did not increase with the presence of the automated aid. Interestingly, the perceived reliability estimates did not differ as a function of age. This study showed that even when both younger and older adults’ perceived reliability estimates were similar, there were still differences in how the two groups used the automation. Most recently, McBride, Rogers, and Fisk (2010) investigated the role of age in a dual task environment with automation support. They found that when the automation was incorrect, older adults demonstrated higher dependence on the automation and rated their trust in automation higher than younger adults. Overall, there is evidence for age-related differences in behavior toward automation that may go beyond perceived trustworthiness and memory decrement of the aid’s reliability (McCarley, Wiegmann, Wickens, & Kramer, 2003). McBride, Rogers, & Fisk (2010) suggested that older adults may need greater support to identify automation errors and may benefit from extended practice with automation.
Domain Experience
Understanding the effects of type of automation errors on operators with years of domain experience as compared to college students (or older adults) completing an unfamiliar laboratory task is important because potentially different levels of dependence may exist as a function of domain experience. Experience may affect how individuals set their automation reliance criterion and how they gather information about the reliability of the automation over time. For example, Riley (1996) showed that pilots were more likely to rely on an automated aid than undergraduate students, even when the aid had proved to be unreliable. Riley concluded that some portion of the pilots’ experience biased them in favor of using the automation.
Recent work has specifically investigated the differential effects of types of automation errors with air traffic controllers with years of experience separating traffic. Wickens et al. (2009) investigated naturalistic traffic data from en route air traffic control facilities and found that the greater the false alarm rate in a center, the less air traffic controllers tended to respond; however they did not find a relationship between conflict alert rate and less safe separation performance (Wickens et al., 2009). This is in contrast to findings by Rovira & Parasuraman (2010) that found with an imperfect automated conflict probe (supporting the primary task of conflict detection) performance declined with both miss (25% conflicts detected) and false alarm automation (50% conflicts detected). Wickens et al. (2009) provides several reasons for not finding operator distrust in automation as a result of excessive and unnecessary alerts including controllers’ perceiving some false alerts as “acceptable” because of conservative algorithms (Lees & Lee, 2007), cultural differences in acceptance among centers, and the relative little evidence for the differences in performance due to types of automation imperfections when the primary task is automated.
Overview of Research
Research in the field of human-automation interaction has provided us with a greater understanding of the complex relationship between system variables and human behavior; however, there remain a number of unanswered questions. The objective of this research was to investigate the attributes of automation in the context of individual differences (e.g. age and experience) between operators. As the percentage of older adults in the U.S. grows it is more likely that this segment of the population will be exposed to technology and it is unclear how they will respond to types of automation imperfections over time. Additionally, it is unclear the effects of domain experience with types of automation errors on primary task performance, therefore a micro-level analysis may lead to a better understanding of how experts interact with types of automation imperfections across time. Therefore, we tested young adults and older adults with no experience operating agricultural vehicles or farming (experiment 1) as well as those who had significant experience in this domain (experiment 2). The experimental platform is a virtual harvesting combine. A harvesting combine is a farm machine used to harvest different types of crops.
Experiment 1
Experiment 1 was designed to investigate how automation error type, distribution of errors, and age-related effects impact human-automation interaction. A multi-task simulation environment composed of an automation-assisted obstacle detection task and a manual tracking task was used. The key measure in this experiment was whether participants chose to rely on the automation to detect obstacles throughout the experiment, or whether they chose to “look out the window” of the simulator, thus not relying on the automated obstacle detection feature. The distribution of the automation errors was varied; it was expected that the reliance behavior of participants would change as a result. It was also expected that participants would develop patterns of behavior as a function of error type. In the event of an automation miss, the operator should become less reliant and pay closer attention to the raw data (e.g., out the window view), resulting in better obstacle avoidance performance. However, performance with false alarm automation should result in either a delayed response or no response to the automated alert (Breznitz, 1984).
Method
Participants
Sixty younger adults (aged 18–24, M = 19.5, SD = 1.6) and sixty older adults (aged 65–75, M = 69.6, SD = 3.5) participated in this study. Younger adults outperformed older adults in Paper Folding (Ekstrom, French, Harman & Dermen, 1976), Digit Symbol Substitution (Wechsler, 1981), and Reverse Digit Span (Wechsler, 1981) whereas older adults had significantly higher scores in the Shipley Vocabulary test (Shipley, 1986). Table 1 shows small, yet insignificant differences in general cognitive ability between the manipulated groups. The younger adults were recruited from introductory psychology courses at the Georgia Institute of Technology and were given course credit for their participation. The older adults were paid $25 for two hours of participation and were recruited from the Atlanta metropolitan area.
Table 1.
Demographic and Ability Data for Participants in Experiment 1
|
|
|||||||||||
|---|---|---|---|---|---|---|---|---|---|---|---|
| Age | Paper Folding Task*1 | Shipley Vocabulary Test*2 | Digit-symbol Substitution*3 | Reverse Digit Span*4 | |||||||
|
| |||||||||||
| Mean | SD | Mean | SD | Mean | SD | Mean | SD | Mean | SD | ||
| Throughout Condition | Younger Adults | ||||||||||
| False Alarms | 19.6 | 2.2 | 11.3 | 2.2 | 31.7 | 4.5 | 74.9 | 7.4 | 7.0 | 1.8 | |
| Misses | 19.1 | 1.3 | 11.1 | 1.7 | 30.9 | 4.2 | 72.0 | 6.7 | 7.1 | 1.6 | |
|
| |||||||||||
| Older Adults | |||||||||||
| False Alarms | 69.5 | 3.2 | 7.6 | 1.7 | 33.8 | 3.1 | 59.0 | 9.3 | 5.2 | 0.9 | |
| Misses | 69.3 | 4.5 | 8.1 | 1.9 | 33.8 | 6.4 | 52.8 | 14.9 | 4.3 | 1.7 | |
|
| |||||||||||
| First-half Condition | Younger Adults | ||||||||||
| False Alarms | 19.5 | 1.4 | 10.1 | 1.9 | 29.8 | 2.8 | 76.4 | 8.7 | 7.3 | 1.6 | |
| Misses | 19.4 | 1.4 | 11.4 | 1.4 | 28.6 | 3.6 | 75.8 | 9.2 | 7.1 | 2.1 | |
|
| |||||||||||
| Older Adults | |||||||||||
| False Alarms | 70.3 | 4.0 | 8.1 | 2.1 | 34.7 | 4.3 | 53.8 | 8.0 | 5.3 | 0.8 | |
| Misses | 71.3 | 2.8 | 7.3 | 1.9 | 34.5 | 2.4 | 60.0 | 11.5 | 5.0 | 1.2 | |
|
| |||||||||||
| Condition Second-half | Younger Adults | ||||||||||
| False Alarms | 19.7 | 1.9 | 10.2 | 1.9 | 29.5 | 3.4 | 74.8 | 7.7 | 6.7 | 1.8 | |
| Misses | 19.8 | 1.3 | 10.2 | 2.1 | 29.8 | 5.5 | 70.6 | 8.8 | 6.3 | 2.0 | |
|
| |||||||||||
| Older Adult | |||||||||||
| False Alarms | 67.7 | 2.5 | 9.0 | 1.9 | 34.0 | 3.1 | 49.4 | 12.7 | 5.2 | 1.2 | |
| Misses | 69.6 | 3.3 | 8.8 | 1.8 | 34.3 | 5.5 | 48.1 | 14.5 | 4.9 | 1.1 | |
Number of correct items (maximum 20);
Number of correct items (maximum 40);
Number of completed items (maximum 100);
Number of digits recalled in the correct order (maximum 14)
Design
Experiment 1 was a 2 (age: younger adults and older adults) × 2 (error type: false alarms and misses) × 3 (distribution of errors: throughout, first half, and second half) factorial design. A completely between-subjects design was employed with a total of 10 participants per twelve experimental groups. Every group was exposed to 11 automation errors (10 similar errors and one exception error). The experimental session lasted 60 minutes. The exception error occurred after all the similar errors had occurred, at the 58th minute. In the throughout condition, the 10 similar errors were quasi-randomly distributed within the first 57 minutes. In the first half condition, errors were quasi-randomly distributed within the first 27 minutes of the task and the exception error occurred at minute 28. In the second half condition, the 10 similar errors were quasi-randomly distributed between minute 30 and minute 57, and the exception error occurred at minute 58. The distribution of errors during the first 30 minutes of the first half condition was identical to the distribution of errors during the last 30 minutes of the second half condition.
Apparatus and Task Simulation
The experiment utilized IBM-compatible computers (3.2 GHz, 4.1 GB RAM) connected to 19 inch cathode-ray tube displays. Refresh rate was set at 85 Hz. The input device was a standard QWERTY keyboard. Except for the keys needed to interact with the combine simulator, all keys were removed. The simulator was coded using Macromedia Flash. See Figure 1.
Figure 1.

Screenshot of simulator interface
The simulator incorporated two main tasks, a collision avoidance task and a tracking task. The collision avoidance task was supported by an “imperfect” automated collision avoidance system and the tracking task was performed manually. The simulator display was divided into three separate windows, an outside view, a collision avoidance window, and a tracking task window. There were a total of six keys mapped onto specific functions in the system. The up, down, left, and right arrow keys were used to perform the tracking task. The spacebar was used to view the outside window and the enter key was used to avoid obstacles. The system only allowed one key to function at a time. For example, if the spacebar was held down to view the outside window, no other key would activate its respective function. This functionality of the simulator provided a clear indicator of where participants had allocated their attention.
Collision Avoidance Task
The top window represented the outside view from the perspective of an operator sitting in the cab of an agricultural vehicle. Obstacles (deer) were visible in the outside view window. The outside view remained hidden until the spacebar was pressed and it remained visible until the spacebar was released. The bottom left window contained the automated collision avoidance system. Within this window, there was an automated collision avoidance indicator that indicated the presence of a deer by turning from white to red and generating an “AVOID” warning and remained red for 15 seconds. During automation false alarms, the indicator also turned red for 15 seconds, but of course there was no deer in the top window. For automation misses, a deer appeared in the top window for 15 seconds, but the indicator did not turn red. During periods of correct rejection by the automation, the indicator remained white and no objects appeared in the top window.
When a deer appeared in the top window, participants were responsible for pressing the enter key. When the enter-key was pressed, the vehicle would automatically steer around the deer, although there was no way to actually witness the action of steering around the deer because pressing enter meant that the spacebar had been released, which blocked the outside view. No more than one deer ever appeared at once. The objective of the collision avoidance task was to complete as much of the task without penalty due to an “avoidance error.” Any avoidance error resulted in the loss of “one acre of crop.” This is a key point in this experiment. In many systems, the consequences of false alarms and misses do not have an equal cost. However, in this experiment, all errors associated with the automation aided task resulted in the same loss. Participants received immediate feedback about all actions/inactions associated with the collision avoidance task.
In addition to immediate feedback, participants also received cumulative feedback about their performance via the “acres lost to avoidance error” counter at the bottom of the lower left window. Any time an error was made, an acre was added in this counter. Avoidance errors occurred as a result of the following actions/inactions:
Failing to press enter within 15 seconds of a deer entering the vehicle’s direct path. This scenario could occur from either ignoring a true alarm or failing to detect a deer during a miss by the collision avoidance system. The immediate feedback as a result of failing to press enter within 15 seconds of the appearance of a deer was “COLLISION.”
Pressing enter during a false alarm by the automation. The immediate feedback for this action was “COLLISION.” Participants were told that false alarms were generated when the collision avoidance system detected an obstacle that was near its direct path but mistook the obstacle to be in its direct path. Pressing enter during a false alarm resulted in a collision because the vehicle unnecessarily steered away from its path into the obstacle.
Pressing enter during a correct rejection by the automation. If the vehicle was directed off-path unnecessarily (no deer present) and no alarm from the collision avoidance system, a message saying “UNNECESSARY MANUEVER, 1 ACRE LOST” appeared. This penalty was implemented to prevent participants from randomly pressing enter in the absence of alarms.
If participants pressed enter within 15 seconds of when a deer appeared, a message saying “OBSTACLE AVOIDED” was displayed. To ensure task motivation, feedback messages appeared over the top window and remained visible for 15 seconds, irrespective of whether the spacebar was pressed or not. Participants were also told that for every 15 seconds that the spacebar was pressed they would lose an acre.
During the experimental session, there were a total of 240 events. Events lasted 15 seconds each and were comprised of correct detections, correct rejections, false alarms, and misses by the automation. The overall reliability of the automation, calculated by dividing 11 automation errors over 240 total events, was 95.4%. Of the 240 events, 179 were correct rejections, 50 were correct detections, 10 were either false alarms or misses, and 1 was either a false alarm or a miss
Tracking Task
The tracking task was located in the bottom right window. The objective of this task was to ensure participants were performing well. Specifically participants needed to prevent the filled square from reaching the edge of the box. Any time the filled square overlapped with any of the dashed lines, it changed from green to red. The square was controlled with the up, down, left, or right keys. The square randomly deviated from the center in four directions (up, down, left, right), but never in more than one direction at a time. The time it took for the square to go from the center of the box to the edge ranged from 1200 ms to1400 ms. Once the square began to deviate from the center, its speed was constant. Upon movement of the square in a specific direction (e.g., up), the key pointing to the opposite direction (e.g., down) needed to be pressed once to return it to the center position. Once the square returned to the center position a random amount of time ranging from 1 to 2 seconds elapsed before it began moving again. Participants were told that for every 15 seconds the square overlapped with the edge of the box they would lose an acre due to a “tracking error”. The 15 seconds that it took to lose an acre accrued cumulatively. Cumulative performance feedback for this task was provided by presenting the number of acres that had been lost because of “tracking error.”
Procedure
After providing consent, participants completed a demographics form followed by four basic cognitive ability tests. These were used to ensure there were no pre-existing differences between the experimental groups. Next, participants received instructions and training with the virtual harvesting combine. Participants were told the collision avoidance system was “very reliable, but not perfect.” Screen shots of the four different states of the system (correct detections, correct rejections, false alarms, and misses) were presented and the consequences of pressing or not pressing enter for each scenario were reviewed in detail. Participants received training on the collision avoidance task for five minutes without the tracking task followed by five minutes with both tasks (tracking and collision avoidance). Participants received a short break upon completion of the training session.
The goal was to investigate operator reliance on automation; therefore each spacebar press per event was measured. A spacebar press represented a lack of reliance on the automation. We defined reliance in this study as “willingness of the operator to accept the advice of the automation without double-checking alternate sources of information.” Some participants pressed two or three times to “make sure” they had correctly surveyed the outside window, however only the first spacebar press per event was measured. Two subcategories were calculated: (a) sum of first spacebar presses during alarms and (b) sum of first spacebar presses during non-alarms. Each should vary as a function of type of automation error; the former should be reduced with an increase in false alarms indicating a reduced response to the automated alert. Whereas with an automation miss error type, the operator should be less reliant on the automation increasing the number of spacebar presses during non alarms in order to survey the outside window.
Results – Experiment 1
Behavior changed over time as a function of error type and distribution of errors. Figures 2 – 9 illustrate the percentage of participants who did not rely on the automation as a function of error type and the state of the automation (alarm and non-alarm periods). The x-axis in Figures 2 – 9 represents each of the 15-second 240 time bins. The y-axis represents the percentage of participants who pressed the spacebar during each of the 240 time bins (x-axes). For example, 30% of participants pressing the spacebar meant that 3 out of 10 pressed it.
Figure 2.
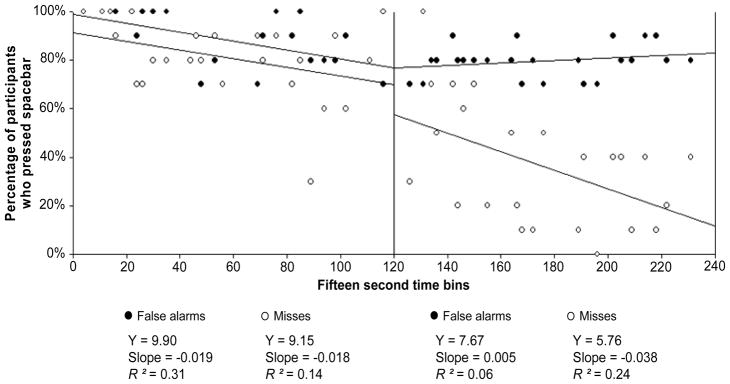
Percentage of younger adults who pressed the spacebar (y-axis) across each 15 second time bin (x-axis) as a function of Error Type. Each point represents the percentage of younger adults who pressed the spacebar during alarms in the throughout condition.
Figure 9.
Percentage of older adults who pressed the spacebar (y-axis) across each 15 second time bin (x-axis) as a function of Error Type. Each point represents the percentage of older adults who pressed the spacebar during non-alarms in the throughout condition.
A best fit regression line was plotted for each error type condition during the first 30 minutes (event bins 1 – 120) and during the last 30 minutes (bins 121 – 240) of the experiment. In the figures that illustrate the number of participants who pressed the spacebar during alarms there are a total of 50 time bins in which data points are plotted (50 points for each false alarms and misses). In the figures that illustrate the number of participants who pressed the spacebar during non-alarms there are a total of 180 time bins in which data points are plotted (false alarms and misses).
Because there were 10 participants in each experimental group, a value of 100% on the y-axis means that 10 of 10 participants pressed the spacebar during a specific time bin. The non-parametric Kruskal-Wallis test was used to analyze effects of error type on the percentage of participants who relied on the automation during alarms and non-alarms. These analyses were performed for both the first and the last 30 minutes of the experiment.
Effects of Error Type on Reliance
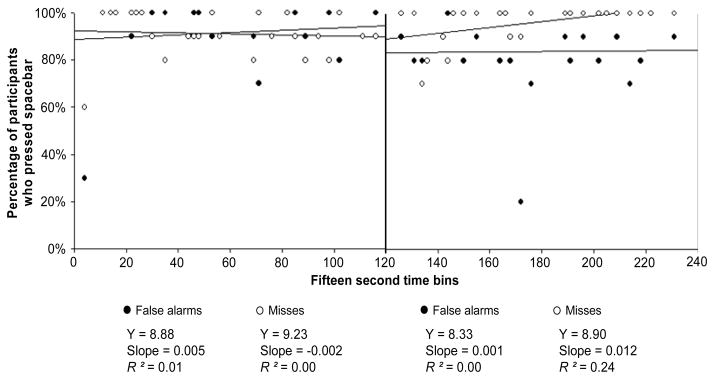
Figure 2 illustrates the percentage of younger adults who pressed the spacebar during alarms and Figure 3 during non-alarms. Both figures illustrate data from the condition in which all of the automation errors were distributed throughout the experiment. As expected, reliance on the automation differed as a function of error type and the state of the automation. During alarms (Figure 2), participants in both the false alarms and misses conditions had similar levels of non-reliance for the first 30 minutes of the experiment, χ2 = 2.17, η2 = .04, p > .05. However, during the last 30 minutes, distinct patterns of behavior emerged.
Figure 3.
Percentage of younger adults who pressed the spacebar (y-axis) across each 15 second time bin (x-axis) as a function of Error Type (throughout condition). Each point represents the percentage of younger adults who pressed the spacebar during non-alarms in the throughout condition.
Participants in the misses condition began to rely more on the automation than participants in the false alarms condition, χ2 = 30.16, η2 = .62, p < .05. This difference suggests that after approximately 30 minutes, most participants in the miss condition began to adjust their behavior in accordance to the criterion of the automation. Participants in the misses condition realized it was not necessary to frequently check the validity of the alarms by pressing the spacebar to view the outside window because potential errors by the automation up to that point had consisted of only misses and automated alarms, and up to that point had been perfectly reliable. However, most participants in the false alarms condition continued to frequently press the spacebar during alarms. Clearly, the criterion of an automated system can have an important impact on the psychological meaning of an alarm.
The percentage of younger adults who pressed the spacebar during non-alarms is illustrated in Figure 3. The pattern of behavior as a function of error type observed during non-alarms was the opposite of the behavior observed during alarms. Interestingly, the different patterns of behavior as a function of error type emerged during the first 30 minutes of the experiment, χ2 = 19.25, η2 = .11, p < .05, and remained during the last 30 minutes, χ2 = 1108.08, η2 = .60, p < .05.
Effects of Distribution of Errors on Reliance
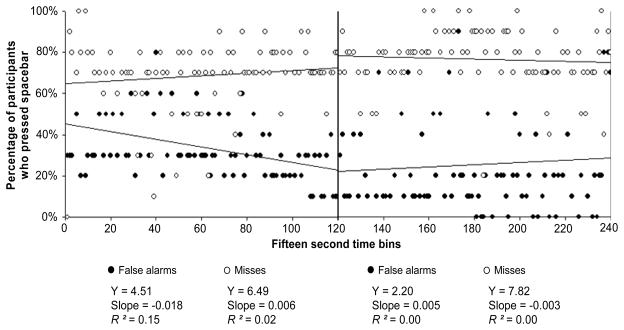
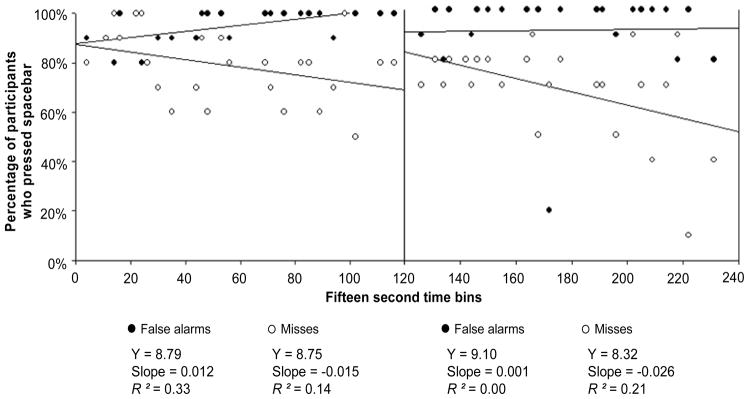
Figures 4 and 5 illustrate data from the condition in which all of the automation errors were distributed within the first half of the experiment. Figure 4 illustrates the percentage of younger adults who relied on the automation during alarm periods and Figure 5 during non-alarm periods. Interestingly, the pattern of data illustrated in Figure 4 closely resembles the pattern in Figure 2 (throughout condition). During alarms, most participants in both the false alarms and misses conditions did not rely on the automation during the first 30 minutes of the experiment, χ2 = .70, η2 = .01, p > .05. However, during the last 30 minutes, more participants in the misses condition began to rely on the automated alarms than in the false alarms condition, χ2 = 14.76, η2 = .30, p < .05. Because of the greater concentration of errors by the automation during the first half of the experiment, it was expected that the distinct patterns of behavior as a function of error type would have emerged earlier than in the condition in which the errors were distributed throughout the experiment. Instead, the different patterns did not emerge until the second half of the experiment, when the automation was perfect.
Figure 4.

Percentage of younger adults who pressed the spacebar (y-axis) across each 15 second time bin (x-axis) as a function of Error Type. Each point represents the percentage of younger adults who pressed the spacebar during alarms in the first half condition.
Figure 5.

Percentage of younger adults who pressed the spacebar (y-axis) across each 15 second time bin (x-axis) as a function of Error Type. Each point represents the percentage of younger adults who pressed the spacebar during non-alarms in the First Half Condition.
The results illustrated in Figure 4 suggest that a greater concentration of automation errors, at least to the degree, in which it was changed with the distribution of errors manipulation, does not significantly impact the effects that error types have on the reliance behavior during alarms. The emergence of different patterns of behavior during the last 30 minutes of the experiment as a function of error type does suggest that once behavior is altered to better match the characteristics of the automation there is a lasting effect, even in the presence of perfect automation.
Surprisingly, the pattern of behavior of the participants in the false alarms condition during the last 30 minutes of the experiment (Figure 4) does not suggest a strong trend toward reliance on the automation. The results of Lee and Moray (1992) and Riley (1996) show that operators are likely to trust and rely on automation shortly after an error occurs. However, the current results suggest this tendency toward reliance is not evident when operators have learned through experience that the automation has a tendency to generate false alarms and are faced with the decision to rely or not rely on automated alarms.
Figure 5 illustrates the reliance data for non-alarm periods (first half condition). The pattern of data observed in the first 30 minutes of Figure 5 resembles the pattern observed in the first 30 minutes of Figure 3, which was the throughout condition. During the first 30 minutes, more participants in the false alarms condition began to rely on the automation than in the misses condition, χ2 = 98.87, η2 = .56, p < .05. The similarity between the trends observed in Figures 3 and 5 suggests that the concentration of errors did not affect the rate at which reliance changed as a function of error type during non-alarms. However, during the last 30 minutes, when the automation was perfect, the negative slope of the best fit line for the misses condition indicates a trend toward the recovery of trust in the automation, manifested through reliance (Figure 5). This trend toward reliance by participants in the misses condition provides some evidence that when transitioning from unreliable to perfect automation, the recovery of trust is more likely to be observed first in the reliance behavior during non-alarms and by those who are interacting with a system laden with misses. Even with the trend toward reliance by participants in the misses group during the last 30 minutes, the different patterns of reliance remained different as a function of error type, χ2 = 109.71, η2 = .61, p < .05.
Figure 6 illustrates the percentage of younger adults who relied on the automation during alarm periods and Figure 7 during non-alarm periods within the second half condition. The first 30 minutes graphed in Figures 6 and 7 provide an illustration of how reliance changes across time with perfect automation. As expected, the negative slopes of all four lines in Figures 6 and 7 indicate an increase in the percentage of participants who relied on the automation across time. It is worth noting that while error type did not have a significant effect on the percentage of participants who relied on alarms during the first 30 minutes, more participants in the false alarms condition pressed the spacebar during the first 30 minutes during non-alarms, χ2 = 20.54, η2 = .12, p < .05. This difference as a function of error type was not expected during the first 30 minutes, when the automation was perfect for all groups.
Figure 6.
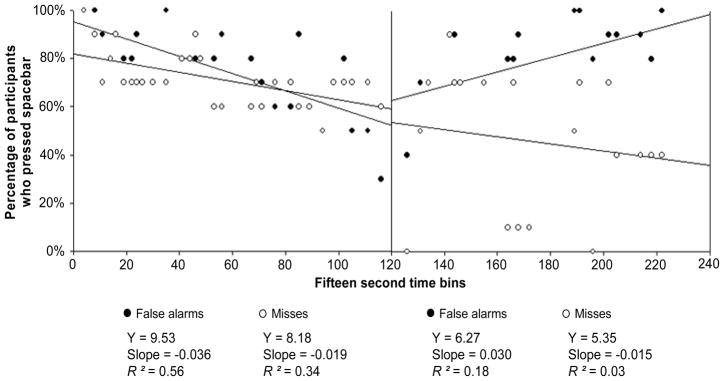
Percentage of younger adults who pressed the spacebar (y-axis) across each 15 second time bin (x-axis) as a function of Error Type. Each point represents the percentage of younger adults who pressed the spacebar during alarms in the Second Half Condition.
Figure 7.

Percentage of younger adults who pressed the spacebar (y-axis) across each 15 second time bin (x-axis) as a function of Error Type. Each point represents the percentage of younger adults who pressed the spacebar during non-alarms in the second half condition.
Age-related Effects on Reliance
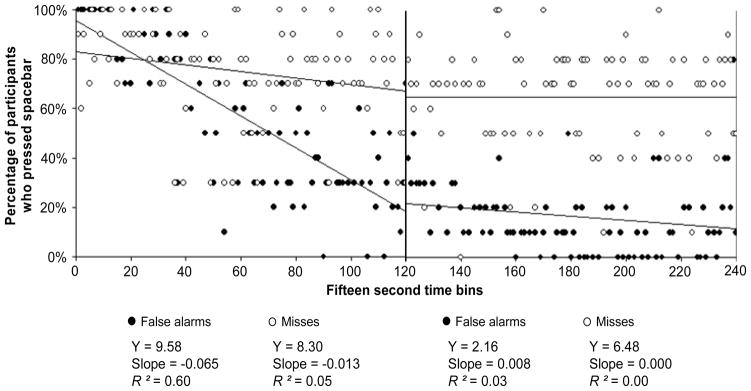
Figures 8 and 9 illustrate the percentage of older adults in the throughout condition, who pressed the spacebar during alarms and during non-alarms, respectively.1 During alarms, neither the older participants in the misses nor those in the false alarms condition relied on the automated alarms consistently (Figure 8). During the first 30 minutes there was no difference in the percentage of participants who relied on the alarms as a function of error type, χ2 = .26, η2 = .01, p > .05. However, during the last 30 minutes, more older participants in the misses condition pressed the spacebar than in the false alarms condition, χ2 = 11.45, η2 = .23, p < .05. The percentage of participants in the false alarms condition who pressed the spacebar during alarms in the last 30 minutes was consistently at or above 80% (Figure 8). Therefore, the data show a majority of older participants did not rely on alarms throughout the entire experiment, for both error conditions.
Figure 8.
Percentage of older adults who pressed the spacebar (y-axis) across each 15 second time bin (x-axis) as a function of Error Type. Each point represents the percentage of older adults who pressed the spacebar during alarms in the throughout condition.
During non-alarms, the older adults in the false alarms condition relied more on the automation than those in the misses condition within the first 30 minutes, χ2 = 92.1, η2 = .53, p < .05, and within the last 30 minutes, χ2 = 106.21, η2 = .59, p < .05 (Figure 9). This pattern was similar to the one observed for the younger adult group, which suggests that, at least for non-alarms, older adults did adjust their behavior according to the detection criterion of the automation. Also, older adults demonstrated willingness to rely on an automated system that had proven, at times, to be unreliable.
Tracking Task Performance
One of the benefits of receiving support from an automated system is that it can reduce the workload for a specific task while freeing up cognitive and physical resources. In a multitask environment, these resources can be allocated to performing concurrent tasks (Wickens & Xu, 2002). Therefore, human performance in tasks without automation support is often an indicator of reliance on the automation. If operators trust and rely on automation, performance on concurrent tasks should be higher than if operators have to constantly use time and resources to verify the validity of the support provided by the automation.
The main measure of performance for the tracking task was the “number of acres lost due to tracking error.” This measure was calculated by adding the total amount of time that the square was left on the edge of the box and dividing it by 15. Participants in the miss conditions committed significantly more errors than participants in the false alarm conditions, F(1, 108) = 7.6, η2 = .07, p < .05. Furthermore, older adults performed significantly worse than younger adults, F(1, 108) = 63.9, η2 = .37, p < .05.
Discussion – Experiment 1
Does Error Type Affect Reliance on Automation?
Different patterns of reliance emerged as a function of error type. Clearly, the detection criterion of an automated system has an impact on reliance behavior. When the unreliability of a system consisted primarily of automation misses, reliance behavior was adjusted accordingly to frequently monitor alternate sources of information while the automation is idle (during non-alarms). However, a prevalence of automation misses led to non-reliance on the automation during idle states, but also encouraged reliance on automated alarms. Conversely, when the system was laden with false alarms, non-reliance behavior became prevalent in the presence of automated alarms. In this situation, the appearance of an alarm became a proxy to check alternate sources of information with the goal of validating the alarm.
The pattern of behavior observed as a function of error type provided an important insight into the relationship between automation reliability and human behavior. The goal of various research efforts has been to understand how different levels of reliability affect trust-related behaviors, such as reliance (e.g., Moray, Inagaki, & Itoh, 2000; Parasuraman et al., 1993; Sanchez et al., 2004; Wiegmann et al., 2001). The results of the current investigation showed that reliance on automation was not simply shaped by the automation’s reliability (the percentage of errors it makes), but also by its characteristics, specifically the prevalence of each error type. These results imply that in a system in which most automation errors consist of false alarms, reliance on the automation is likely to be high, as long as the automation is not generating an alarm. Conversely, when the automation is providing support information in the form of an alarm, reliance on the automation is likely to be low. This contrast in behavior, which is dependent on the state of the system, highlights the complexity of the construct of trust in automation and has important implications.
Changes in behavior as a result of automation errors do not appear to be random. Instead, changes in behavior resemble systematic responses to the characteristics of the automation in an effort to collaborate more effectively with it. The prevalence of each type of automation error has important effects on attention allocation. The current data also suggest that it is critical to set realistic expectations when defining the role of operators in any system that requires collaboration with automation. In a system in which false alarms are prevalent, the operator may be driven to frequently check the validity of the alarms. Therefore, operators should not be expected to attend to many other stimuli during alarms.
Does it Matter When Errors Occur?
Interestingly, a higher concentration of errors in the first half of the experiment did not lead to an earlier development of different patterns of reliance as a function of error type as was expected. For younger and older adults, in both the first half and throughout conditions, the different patterns of behavior emerged in the last 30 minutes of the experiment. One possible limitation is that this could be a result of fatigue or the vigilance decrement because participants worked for 60 minutes without any breaks. However, in the second half condition in which participants interacted with perfect automation for the first 30 minutes, the different patterns of behavior as a function of error type emerged shortly after the appearance of errors.
The earlier emergence of different reliance patterns during the last 30 minutes of the second half condition highlights the effect that familiarity with a system has on human–automation interaction. Wickens and Xu (2002) suggested that experience with a system is an important factor in the effects that different automation specific variables, specifically errors by the automation, have on behavior. The results of this investigation suggest that when operators are allowed to build trust in an automated system, the development of different reliance patterns as a function of error type, especially during alarms, occurs faster than if operators are exposed to errors early in their interaction with the automation.
The effects of distribution of errors on reliance and trust observed in this investigation further demonstrate the complex relationship between automation reliability and reliance. Specifically, these results suggest that when investigating the relationship between automation reliability and operator reliance, it is critical to consider when automation errors occur. The impact of each error on objective behaviors, such as reliance, and subjective perceptions, such as trust, depends on the amount of experience and familiarity operators have with automation. The implication of these findings to future research efforts in the field of human-automation interaction is that the term “overall reliability” is not sufficient to describe the effect that the error rate of the automation has on behavior. Perhaps when referring to the error rate of the automation, a term such as “consistency of the automation” might be better suited than “reliability of the automation.” In addition to defining the consistency of the automation, it is also critical to describe and consider how errors are distributed throughout the experimental session.
Does Age Matter in Human-Automation Interaction?
Older adults relied less on automated alarms than younger adults. However, it appears that this age-related difference is not due to an aversion to using automation. The reluctance to rely on the automation during alarms, relative to non-alarms suggests that older adults have a more conservative approach (e.g., Walker, Philben, & Fisk, 1997) when dealing with a system that has proven to be faulty at times. This conservative approach is only evident with reliance on alarms. However, the unwillingness of older adults to rely on alarms is considerably mitigated when they are given sufficient time and experience to build their trust in the automation.
The different patterns of reliance as a function of age are more likely to be a product of age-related differences in the development of appropriate trust in the automation. Because it takes older adults longer to discern the detection criterion of the automation, it also takes them longer to adjust their reliance behavior. This finding is consistent with the results of Sit and Fisk (1999), which showed that older adults take longer to modify their biases, especially with tasks that require “higher-order, strategic processing” (p. 26).
In summary, it appears that an aversion toward technology by older adults is not the main factor driving age-related differences in human-automation interaction. The evidence from this investigation suggests that although it does take older adults longer (more trials) to adjust their behavior in accordance with the characteristics of the automation, they eventually do adjust. Once older adults adjust their behavior, the age-related differences in reliance on the automation are mitigated.
Experiment 2
The purpose of this experiment was to investigate the effects of domain experience on automation reliance behavior. The key motivation for this study was to investigate the reliance behavior of a different population with a relevant set of experiences related to farming.
Method
Participants
Twenty younger adults (aged 19–29, M = 23.2, SD = 2.9, all males) participated in this experiment; they all had experience operating agricultural vehicles, which included tractors and harvesting combines, (See Table 2 for demographic information). Combines are highly automated currently; hence, the participants had experience with automation, but not the particular automation used in this study. Participants were recruited from the Iowa/Illinois regions and were given a hat for their voluntary participation.
Table 2.
Demographic and Ability Data for Experiment 2 Participants
| Age | Paper Folding Task*1 | Shipley Vocabulary Test*2 | Digit-symbol Substitution*3 | Reverse Digit Span*4 | ||||||
|---|---|---|---|---|---|---|---|---|---|---|
|
| ||||||||||
| Mean | SD | Mean | SD | Mean | SD | Mean | SD | Mean | SD | |
| False Alarms | 23.5 | 2.6 | 9.3 | 2.1 | 29.1 | 3.1 | 62.8 | 9.8 | 5.8 | 1.5 |
| Misses | 22.8 | 3.3 | 9.5 | 2.0 | 28.5 | 3.0 | 62.5 | 9.6 | 6.7 | 1.3 |
Number of correct items (maximum 20);
Number of correct items (maximum 40);
Number of completed items (maximum 100);
Number of digits recalled in the correct order (maximum 14)
Materials and Procedure
The materials and procedure for experiment 2 were identical to experiment 1. The only difference was that the only manipulation in this experiment was the automation error type: false alarms and misses. The distribution of automation errors was identical to the throughout condition from experiment 1.
Results – Experiment 2
The results of this experiment were analyzed as a function of error type, and were compared to the younger adult population from experiment 1, specifically those in the throughout condition. Again, the objective was to understand if there were any domain-driven differences in behavior toward automation as a function of domain-experience and error type.
Comparisons to Participants without Domain Experience
Figures 10 and 11 illustrate the percentage of farmers who pressed the spacebar during alarms and during non-alarms, respectively. Figure 10 illustrates that most farmers (70% or more) in the misses condition continued to double check the validity of all alarms throughout the experiment, while the younger adult non-farmers (in Experiment 1), did rely on alerts in the misses condition. One explanation for the different patterns of reliance on alarms as a function of agricultural experience is that farmers are accustomed to interacting with automated systems that are generally robust, which means that the automated systems seldom make errors, unless they are caused by a permanent malfunction. Therefore, any error by the automation might have been perceived by the farmers as a sign that the collision avoidance system was permanently damaged and therefore they were less willing to rely on the automated alarms. Another factor that could have contributed to this difference in behavior as a function of agricultural experience is that the perception of the cost of an error might have been inherently higher for farmers. The collision of an agricultural vehicle with any object usually has a very high cost associated with it. Not only is the equipment expensive, but it usually means that the vehicle is disabled to some capacity during harvest or planting season, when time is of the essence.
Figure 10.
Percentage of farmers who pressed the spacebar (y-axis) across each 15 second time bin (x-axis) as a function of Error Type. Each point represents the percentage of farmers who pressed the spacebar during alarms in the throughout condition.
Figure 11.

Percentage of farmers who pressed the spacebar (y-axis) across each 15 second time bin (x-axis) as a function of Error Type. Each point represents the percentage of farmers who pressed the spacebar during non-alarms in the throughout condition.
The reliance data from the non-alarm periods (Figure 11) show that different patterns of behavior did emerge as a function of error type, especially during the last 30 minutes, χ2 = 66.6, η2 = .37, p < .05. This behavior suggests that the farmers were willing to rely on a faulty automated system during non-alarms. The results from experiment 2 are consistent with the behavior observed in the younger adults’ non-farmer participants (experiment 1), where most participants were more reluctant to rely on automated alarms than they were to rely on automation during non-alarms.
Interestingly, the slopes of both lines during the first 30 minutes in Figure 11 (during non-alarms) suggest a trend toward reliance by farmers in both the false alarms and misses conditions. This pattern toward reliance was not observed for the younger adults in experiment 1. The trend toward reliance of non-alarms by the farmers could be a product of prior experience. Most automated systems in agricultural vehicles have a loose criterion setting, which means that if the system does generate an error it is more likely to be a false alarm (A. Greer, personal communication, February, 2005). Therefore, farmers are not used to unreliable events being in the form of automation misses, which is a possible reason why there is a trend toward reliance during non-alarms within the first 30 minutes of the experiment. However, with some exposure to the system, the different patterns of reliance became clearer (see the last 30 minutes in Figure 11). As expected, most participants in the false alarms condition continued the trend toward reliance on the automation, while those in the misses condition began to verify its validity with increased frequency.
Detection of the Exception Error for Experiments 1 & 2
The last automation error in each experimental condition was the opposite of the rest of the errors. The main purpose for including the exception error was to contribute to the understanding of the effects that the prevalence of each error type have on the probability of “catching” an automation error. If reliance on the automation is affected by the prevalence of an error type in the way in which the data of this investigation have shown, then in the event that an uncommon automation error occurs, the probability of a collision should be higher than if operator non-reliance behavior was simply random. The combined results from experiments 1 and 2 showed that 123 out of 140 participants failed to detect the exception error by the automation, which means only 12.1% of the exception errors were detected and did not result in a collision. This percentage was considerably lower than the percentage of the rest of the automation errors that were detected (54%).
The considerably lower detection rate of the exception error, relative to the rest of the errors, provides more evidence that behavior is adjusted based on the criterion of the automation. This finding has an important practical implication. Once behavior is changed due to the prevalence of a particular error, there is a lower probability that operators will detect an uncommon automation error. For example, in a system in which false alarms are prevalent, operators will likely have adjusted their behavior such that reliance on the automation during non-alarm periods is high. Therefore, in the event of an automation miss, it is not likely that operators will serve an effective backup role to the automation.
Discussion – Experiment 2
Does Domain Experience Matter in Human-Automation Interaction?
The most notable domain experience-related difference observed was the unwillingness of most farmers to rely on the automated alarms. One explanation for this domain experience-related difference in reliance is that there may be differences in the preconceived meaning of an automation error by the farmers. Farmers might view any automation error as a permanent malfunction. This difference in the way errors are perceived can lead to a more cautious approach in the reliance on alarms. This finding highlights the importance of prior expectations of the automation and reliance on it. It appears that there is a negative relationship between prior expectations of the automation and perceived reliability. As expectations of the automation are higher, any error will have a stronger negative impact on perceived reliability.
The tendency of farmers to not rely on the automation as much as the younger adults in Experiment 1 was not consistent with the results of Riley (1996). The results of his experiment showed that pilots, who were the experimental group with more automation experience, were more likely to rely on faulty automation than non-pilots (college undergraduates). Riley’s explanation for this finding was that the costs associated with errors in the experimental task were considerably less than the costs of an error in the flight deck. Furthermore, the automation supported task was distinguishing letters from numbers. Perhaps this task did not invoke the tendencies and biases of pilots associated with the use of automation. Given the apparent lack of ecological validity of the experimental task, it is not surprising that pilots’ experience with automation in the flight deck did not transfer into their interaction with the automation in the experiment.
General Discussion
Do Humans Adjust Optimally to Automation Error Type?
The patterns of behavior that emerged as a function of Error Type suggest that operators adjust their behavior in an attempt to collaborate more effectively with the automation. In essence, behavior is calibrated according to the capabilities and limitations of the automation in an attempt to increase overall system performance. The identification of this self-adjustment in reliance makes an important contribution to the field of human-automation interaction, specifically when attempting to determine appropriate trust/reliance.
Appropriate trust and appropriate reliance are terms used to describe a match between the perceived capabilities of the automation and the actual capabilities of the automation (Lee & Moray, 1994; Lee & See, 2004). For example, if a collision avoidance system has a high false alarm rate during rainy conditions then appropriate reliance would consist of frequently checking the validity of automated alarms when it is raining, while relying on the automated alarms when it is not raining. The present results indicate that behavior is adjusted as a function of the types of errors by the automation, which suggests that operators can and do gather information that helps them increase the instances of appropriate reliance on the automation. This trend toward appropriate reliance indicates that individuals are constantly trying to adjust their behavior to achieve equilibrium between overall system performance and workload.
The Meaning of Alarms
Another important finding of this investigation was the reluctance to rely on the automation during alarms relative to non-alarm periods. For example, in the first 30 minutes of the experiment, younger adults (first half and throughout conditions) were more reluctant to rely on the automation during alarms than they were to rely on it during non-alarms. Even in the second half condition, where the automation was perfect for 30 minutes, the trend toward reliance on the automation was greater during non-alarm periods than during alarms. This behavior suggests that the different ways in which automation can provide support, via alarms and non-alarms, affect the way people gather evidence about the reliability of the automation and the manner in which they adjust their behavior accordingly. Presumably, because of their salience, alarms prompt an increased tendency toward non-reliance relative to non-alarms.
Conclusion
A critical paradoxical problem concerning human-automation interaction across a variety of domains is that highly reliable automation, while desirable in terms of improving overall system performance, can negatively affect human performance (evident by poor monitoring). To resolve this problem, and to facilitate successful human-automation interaction, requires ensuring that the congruency between the operator’s system representation and the design parameters of the automation remain high. The findings of this investigation showed that people can and do gather information about the automation that helps them adjust their behavior to best collaborate with it. In general, the acquired patterns of behavior as a function of the characteristics of the automation indicate people strive for optimal system performance.
Knowing the effects of specific variables on human-automation interaction can help designers of automated systems make predictions about human behavior and system performance as a function of the characteristics of the automation. For example, based on the detection criterion of the automation, human operators are likely to develop distinct patterns of reliance. These distinct behavior patterns can be used to make predictions about the allocation of attention and workload during different states of the automation. Of course, the current findings regarding the effects of error type should not be used as the sole basis by which the detection criterion of an automated system is set. This decision must be made with knowledge of other important parameters specific to any system, such as the cost of errors.
Acknowledgments
This research was supported in part by contributions from Deere & Company. Special thanks to Jerry R. Duncan for his guidance and advice of this research. This work was also supported in part by the National Institute of Aging Training Grant R01 AG15019 and by a grant from the National Institutes of Health (National Institute on Aging) Grant P01 AG17211 under the auspices of the Center for Research and Education on Aging and Technology Enhancement (CREATE; www.create-center.org).
Footnotes
The throughout condition provided a representative data set of age-related effects as a function of error type; therefore, in the interest of space, the first-half and second-half distribution of error conditions are not presented. The pattern of those data resemble those of the younger adults’, with the exception that the patterns of behavior as a function of error type took longer to emerge.
References
- Bliss J. An investigation of alarm related accidents and incidents in aviation. International Journal of Aviation Psychology. 2003;13:249–268. [Google Scholar]
- Bliss JP, Gilson RD, Deaton JE. Human probability matching behaviour in response to alarms of varying reliability. Ergonomics. 1995;38:2300–2312. doi: 10.1080/00140139508925269. [DOI] [PubMed] [Google Scholar]
- Breznitz S. Cry wolf: The psychology of false alarms. Hillsdale, NJ: LEA; 1984. [Google Scholar]
- Center for Disease Control. 2003 http://www.cdc.gov/mmwr/preview/mmwrhtml/mm.5206a2.htm Retrieved June 6, 2011.
- Cotte N, Meyer J, Coughlin JF. Older and younger drivers’ reliance on collision warning systems. Proceedings of the Human Factors Society, 45th annual meeting; Santa Monica, CA: Human Factors and Ergonomics Society; 2001. pp. 277–280. [Google Scholar]
- Craik FIM, Salthouse TA, editors. Handbook of Aging and Cognition. Hillsdale, N.J: Lawrence Erlbaum Associates; 1992. [Google Scholar]
- Dixon SR, Wickens CD. Technical Report AHFD-03-17/MAAD-03-2. Savoy, IL: University of Illinois, Aviation Human Factors Division; 2003. Imperfect automation in unmanned aerial vehicle flight control. [Google Scholar]
- Dixon SR, Wickens CD. Technical Report AHFD-04-05/MAAD-04-1. Savoy, IL: University of Illinois, Aviation Human Factors Division; 2004. Reliability in automated aids for unmanned aerial vehicle flight control: Evaluating a model of automation dependence in high workload. [DOI] [PubMed] [Google Scholar]
- Ekstrom RB, French JW, Harman HH, Dermen D. Letter Sets. Princeton, NJ: Educational Testing Service; 1976. Manual for Kit of Factor-Referenced Cognitive Tests; p. VZ-2.p. 174.p. 176.p. 179. [Google Scholar]
- Green DM, Sweets JA. Signal Detection Theory and psychophysics. New York: Wiley; 1966. [Google Scholar]
- Gupta N, Bisantz AM, Singh T. Investigation of factors affecting driver performance using adverse condition warning systems. Proceedings of the 45th Annual Meeting of the Human Factors Society; Santa Monica, CA: Human Factors and Ergonomics Society; 2001. pp. 1699–1703. [Google Scholar]
- Johnson DJ, Sanchez J, Fisk AD, Rogers WA. Type of automation failure: The effects on trust and reliance in automation. Proceedings of the 48th Annual Meeting of the Human Factors and Ergonomics Society; Santa Monica, CA: Human Factors and Ergonomics Society; 2004. [Google Scholar]
- Johnsson J. US pilots can fly until 65 Bush signs bill raising retirement age, ends debate dating to 1950s. 2007 http://www.leftseat.com/age60.htm Retrieved June 6, 2011.
- Kantowitz BH, Becker CA, Barlow ST. Assessing driver acceptance of IVHS components. Proceedings of the Human Factors and Ergonomics Society 37th Annual Meeting; Santa Monica, CA: Human Factors and Ergonomics Society; 1993. pp. 1062–1066. [Google Scholar]
- Lee JD, Moray N. Trust, control strategies, and allocation of function in human-machine systems. Ergonomics. 1992;35:1243–1270. doi: 10.1080/00140139208967392. [DOI] [PubMed] [Google Scholar]
- Lee JD, Moray N. Trust, self-confidence and operator’s adaptation to automation. International Journal of Human Computer Studies. 1994;40:153–184. [Google Scholar]
- Lee JD, See KA. Trust in automation: Designing for appropriate reliance. Human Factors. 2004;46:50–80. doi: 10.1518/hfes.46.1.50_30392. [DOI] [PubMed] [Google Scholar]
- Lees MN, Lee JD. The influence of distraction and driving context on driver response to imperfect collision warning systems. Ergonomics. 2007;50:1264–1286. doi: 10.1080/00140130701318749. [DOI] [PubMed] [Google Scholar]
- Lehto MR, Papastavrou JD, Ranney TA, Simmons LA. An experimental comparison of conservative versus optimal collision avoidance warning system thresholds. Safety Science. 2000;36:185–209. [Google Scholar]
- Maltz M, Shinar D. Imperfect in-vehicle collision avoidance warning systems can aid drivers. Human Factors. 2004;46:357–366. doi: 10.1518/hfes.46.2.357.37348. [DOI] [PubMed] [Google Scholar]
- Mann W, OTR C, Belchior, Tomita P, Machiko R, Kemp BJ. Older Adults’ Perception and Use of PDAs, Home Automation System, and Home Health Monitoring System. Topics in Geriatric Rehabilitation. 2007;23:35–46. [Google Scholar]
- McBride SE, Rogers WA, Fisk AD. Using an Automated System: Do Younger and Older Adults Differentially Depend?. Proceedings of the Human Factors and Ergonomics Society 54th Annual Meeting; Santa Monica, CA: Human Factors and Ergonomics Society; 2010. pp. 175–179. [Google Scholar]
- McCarley JS, Wiegmann DA, Wickens CD, Kramer AF. Effects of age on utilization and perceived reliability of an automated decision-making aid for luggage screening. Proceedings of the Human Factors and Ergonomics Society 47th Annual Meeting; Santa Monica, CA: Human Factors and Ergonomics Society; 2003. [Google Scholar]
- McDowd JM, Shaw RJ. Attention and aging: a functional perspective. In: Craik FIM, Salthouse TA, editors. The Handbook of Aging and Cognition. Mahwah, NJ: Lawrence Erlbaum Associates; 2000. pp. 221–292. [Google Scholar]
- Molloy R, Parasuraman R. Monitoring an automated system for a single failure: Vigilance and task complexity effects. Human Factors. 1996;38:311–322. doi: 10.1518/001872096778827279. [DOI] [PubMed] [Google Scholar]
- Moray N, Inagaki T, Itoh M. Adaptive automation, trust, and self-confidence in fault management of time-critical tasks. Journal of Experimental Psychology: Applied. 2000;6:44–58. doi: 10.1037//1076-898x.6.1.44. [DOI] [PubMed] [Google Scholar]
- O’Donnell RD, Eggemeier FT. Workload assessment methodology. In: Boff KR, Kauffman L, Thomas J, editors. Handbook of perception and human performance: Volume II. Cognitive processes and performance. New York: John Wiley; 1986. [Google Scholar]
- Parasuraman R, Molloy R, Singh I. Performance consequences of automation-induced “complacency. The International Journal of Aviation Psychology. 1993;3:1–23. [Google Scholar]
- Riley V. Operator reliance on automation: theory and data. In: Parasuraman R, Mouloua M, editors. Automation and human performance. Mahwah, NJ: Lawrence Erlbaum Associates; 1996. pp. 19–36. [Google Scholar]
- Rovira E, Zinni M, Parasuraman R. Effects of information and decision automation on multi-task performance. Proceedings of the Human Factors & Ergonomics Society 46th Annual Meeting; Santa Monica, CA: Human Factors and Ergonomics Society; 2002. pp. 327–331. [Google Scholar]
- Rovira E, McGarry K, Parasuraman R. Effects of imperfect automation on decision-making in a simulated command and control task. Human Factors. 2007;49(1):76–87. doi: 10.1518/001872007779598082. [DOI] [PubMed] [Google Scholar]
- Rovira E, Parasuraman R. Transitioning to Future Air Traffic management: Effects of Imperfect Automation on OCntroller Attention and Performance. Human Factors. 2010;52:411–425. doi: 10.1177/0018720810375692. [DOI] [PubMed] [Google Scholar]
- Sanchez J. Unpublished Doctoral Dissertation. Georgia Institute of Technology; Georgia: 2006. Factors that affect trust and reliance on an automated aid. [Google Scholar]
- Sanchez J, Fisk AD, Rogers WA. Reliability and age-related effects on trust and reliance of a decision support aid. Proceedings of the 48th Annual Meeting of the Human Factors Society; Santa Monica, CA: Human Factors and Ergonomics Society; 2004. pp. 586–589. [Google Scholar]
- Shipley WC. Shipley Institute of Living Scale. Los Angeles: Western Psychological Services; 1986. [Google Scholar]
- Sit RA, Fisk AD. Age-related performance in a multiple-task environment. Human Factors. 1999;41:26–34. doi: 10.1518/001872099779577345. [DOI] [PubMed] [Google Scholar]
- St John M, Manes DI. Making unreliable automation useful. Proceedings of the Human Factors and Ergonomics Society 46th Annual Meeting; Santa Monica, CA: Human Factors and Ergonomics Society; 2002. pp. 332–336. [Google Scholar]
- Vries P, Midden C, Bouwhuis D. The effects of errors on system trust, self-confidence, and the allocation of control in route planning. International Journal of Human-Computer Studies. 2003;58:719–735. [Google Scholar]
- Walker N, Philbin DA, Fisk AD. Age-related differences in movement control: Adjusting submovement structure to optimize performance. Journal of Gerontology: Psychological Sciences. 1997;52:40–52. doi: 10.1093/geronb/52b.1.p40. [DOI] [PubMed] [Google Scholar]
- Wechsler D. Manual for the Wechsler Adult Intelligence Scale – Revised. New York: Psychological Corp; 1981. [Google Scholar]
- Wickens CD, Helleberg J, Xu X. Pilot maneuver choice and workload in free flight. Human Factors. 2002;44:171–188. doi: 10.1518/0018720024497943. [DOI] [PubMed] [Google Scholar]
- Wickens CD, Rice S, Keller D, Hutchins S, Hughes J, Clayton K. False alerts in air traffic control conflict alerting system: Is there a “cry wolf” effect? Human Factors. 2009;51:446–462. doi: 10.1177/0018720809344720. [DOI] [PubMed] [Google Scholar]
- Wickens CD, Xu X. Institute of Aviation Tech. Report AHFD-02-14 / MAAD-02-2. Savoy: University of Illinois, Aviation Research Lab; 2002. Automation trust, reliability and attention. [Google Scholar]
- Wiegmann DA, Rich A, Zhang H. Automated diagnostic aids: the effects of aid reliability on users’ trust and reliance. Theoretical Issues in Ergonomic Science. 2001;2:352–367. [Google Scholar]