

Abstract
Objectives: This study is to determine if green tea (Camellia sinensis) extracts (GTE) affects adipogenesis and further investigate the related molecular mechanisms. Methods: Patients with metabolic syndrome were recruited in this study. Of them, 70 patients received GTE and 64 received water to serve as the control group. The human serum adiponectin, visfatin, and leptin concentrations were determined by enzyme-linked immunosorbent assay. Adipogenesis of 3T3-L1 preadipocytes was induced with reagents and then the cells were treated with GTE. The lipids were stained with Oil Red O for analysis of adipogenesis of 3T3-L1 preadipocytes. The 3T3-L1 preadipocytes were treated with increasing concentrations (0.2-0.5%, w/v) of GTE for 2 days and the cell viability was determined by MTT assay. Reverse transcription real-time PCR and immunoblotting assays were performed to determine RNA and protein levels of relative molecules. Results: GTE increases the serum concentrations of adiponectin but decreases visfatin levels in patients received GTE. The leptin concentrations in serum were not significantly affected. The GTE reduces the adipogenesis-induced lipid accumulation in 3T3-L1 preadipocytes. GTE decreases the mRNA and protein expression of adipogenic transcription factors C/EBPα and PPARγ in 3T3-L1 cells. Expression levels of the adipocyte-specific genes encoding adipocyte protein 2, lipoprotein lipase, and glucose transporter 4 were also decreased by GTE. Furthermore, it was found that GTE reduces phosphorylation of Akt during adipocyte differentiation. Conclusions: GTE reduces adipogenesis by decreasing expression of transcription factors C/EBPα and PPARγ by reduction of phosphorylation of Akt during adipocyte differentiation.
Keywords: Green tea extracts, adipogenesis, transcription factor, C/EBPα, PPARγ
Introduction
Insulin resistance syndrome is a severe public health problem in the world and affects people in many countries. Insulin resistance syndrome consists of a group of health problems that are related with increased risk of type 2 diabetes, glucose intolerance, hyperlipidemia, hypertension, atherosclerosis, chronic kidney disease [1-5]. Obesity is also a major factor in the development of insulin resistance syndrome, especially abdominal obesity. Obesity promotes insulin resistance and weight loss improves the body’s ability to utilize insulin.
The adipose tissue, which is closely related to insulin resistance syndrome, is a kind of loose connective tissues composed mostly of adipocytes that are derived from preadipocytes [6,7]. Adipose tissue is a major endocrine organ, because adipose tissue can secrete hormones such as leptin, resistin, estrogen and the cytokines including tumor necrosis factor-α [8,9]. In addition, the adipose tissue can affect the other organs of the endocrine systems of the body, contributing to obesity from multiple aspects.
Several adipocyte marker genes, such as peroxisome proliferator-activated receptor γ (PPARγ), are involved in obesity development [10,11]. PPARγ is a transcriptional factor belonging to the ligand-activated nuclear receptor superfamily. PPARγ regulates the expression of a large number of genes involved in adipocyte differentiation, lipid, carbohydrate metabolism, and adipokine synthesis [11]. Thus, PPARγ is implicated in various metabolic diseases, including obesity, insulin resistance, dyslipidemia, and hypertension [12]. PPARγ affects obesity-induced inflammation and insulin resistance syndrome by regulating adipokines, which are produced and released by adipose tissues.
The basic-leucine zipper transcription factor family, CCAAT/enhancer-binding proteins (C/EBP), plays major roles in cellular differentiation and functions, metabolism, and growth [13,14]. Members of the C/EBP family, such as C/EBPα, -β, and -δ have been found to regulate the expression of many immunoglobulins, cytokines, chemokines, and growth factors. It has been recently found that co-expression of PPARγ and C/EBPα synergistically activates expression of many key metabolic adipocyte genes [15].
Although the molecular mechanisms are not clear, some compounds of natural resources have important medical applications. For example, salicylate, an active breakdown ingredient of aspirin, is a compound originally found in willow tree bark and has been used for medicinal roles since ancient times. Until recently, Hawley et al. revealed that salicylate functions by activating the cellular metabolic regulator adenosine monophosphate-activated protein kinase, and thus stimulating utilization of fat in mice [16,17]. It is recently reported that green tea (Camellia sinensis) extracts (GTE) play a potential novel role as an anti-obesity and anti-inflammatory agent [18-21]. GTE is found to be able to reduce inflammation and central leptin resistance in a diet-induced obese mice model [18]. It may also be effective for cancer [20] and liver functions [21]. In this study, a mouse obesity model is established and the concentrations of adiponectin, visfatin, and leptin were investigated. The effect of GTE on expression of PPARγ and C/EBPα has been investigated using this animal model.
Materials and methods
Patients
One hundred and thirty-nine patients with metabolic syndrome were recruited at Qingdao University, China. The baseline characteristics of these patients are listed in Table 1. Patients who had conditions such as diabetes, liver or renal disorders, cancers, heart diseases, anemia, or pregnant, or who were smokers or alcohol consumers, were excluded from the study. Written informed consent was obtained from all individuals in this study. The study was approved by the ethics review board of Qingdao University, China.
Table 1.
Information of patients in the control group and GTE group (mean + SD)
| Parameters | Control group (n = 64) | GTE group (n = 70) |
|---|---|---|
| Age | 44.1 ± 7.1 | 43.8 ± 5.8 |
| BMI (kg/m2) | 23.5 ± 3.9 | 24.9 ± 3.6 |
| WC (cm) | 85.9 ± 9.8 | 84.5 ± 8.9 |
| HC (cm) | 99.8 ± 8.8 | 99.3 ± 7.1 |
| DBP (mmHg) | 74.4 ± 8.4 | 75.2 ± 16.8 |
| SBP (mmHg) | 127.6 ± 11.2 | 126.0 ± 13.2 |
| FPG (mmol/L) | 6.16 ± 2.04 | 6.69 ± 1.09 |
| TC (mmol/L) | 3.69 ± 0.76 | 3.71 ± 0.54 |
| TG (mmol/L) | 1.89 ± 0.51 | 1.97 ± 0.91 |
| HDL-C (mmol/L) | 1.41 ± 0.78 | 1.37 ± 0.93 |
| LDL-C (mmol/L) | 2.12 ± 0.87 | 2.19 ± 0.83 |
Note: BMI, body mass index; WC, waistline; HC, hip line; DBP, diastolic bloodpressure; SBP, systolic blood pressure; FPG, fasting plasma glucose; TC, total cholesterol; TG, triglerid; HDL-C, high-density lipoprotein cholesterol; LDL-C,low-density lipoprotein cholesterol.
Preparation of GTE
The decaffeinated GTE capsules (formerly: polyphenols capsules, 90 tablets, RINAWALE, Switzerland) were purchased from Qingdao, China (2 capsules/time/day). Each capsule contains 500 mg of GTE providing 400 mg of catechins. Other ingredients included in the capsule were vegetable celluloses, magnesium stearate and silica.
Reagents
Superscript II, calf serum (CS), and DMEM were purchased from GIBCO/BRL (Carlsbad, CA, USA). Fetal bovine serum (FBS) was purchased from Biowest (Nuailles, France). Oil Red O was purchased from Wako Pure Chemical Industries (Osaka, Japan). Cell culture flasks and dishes were from Falcon (Becton-Dickinson, Franklin Lakes, NJ, USA). DNase and RNeasy Protect Kit were purchased from Qiagen (Valencia, CA, USA).
Specimen collection
Venous blood (5 mL for each person) was collected. Polyethylene sulfate test was carried out to determine low density lipoprotein cholesterol (LDL-C) levels. Enzymatic assay test was used to measure the triglyceride (TG) and high density lipoprotein cholesterol (HDL-C) readings. Cholesterol oxidase test was performed to test the total cholesterol (TC).
Enzyme-linked immunosorbent assay (ELISA)
The human serum adiponectin, visfatin, and leptin concentrations were determined by ELISA kit purchased from Shanghai Xitang Biotechnology Company (Shanghai, China). The optical density of each well was determined by a microplate reader at a wave length of 450 nm. Standard curve was drawing to calculate the concentration of each sample.
Adipogenesis induction of 3T3-L1 preadipocytes and treatments with GTE
The 3T3-L1 preadipocytes (Bogu Biotech Co., Shanghai, China) were cultured in Dulbecco’s modified Eagle’s medium supplemented with 10% (v/v) calf serum and antibiotics (1% penicillin, 1% streptomycin) in a humidified atmosphere of 5% CO2 at 37°C. When becoming subconfluent, the cells were harvested with 0.025% trypsin and 0.01% EDTA, and plated in 24-well dishes for Oil Red O staining. The cells were induced with a mixture (MDI) of 0.5 mM 1-methyl-3-isobutylxanthine, 0.25 mM dexamethasone, 167 nM insulin, and 100 mM indomethacin in medium. The cells were treated with medium, which served as the control or GTE (0.2-0.5%, w/v, GTE capsules, RINAWALE, Switzerland) at 37°C for 2 days. After an additional 1 day culture, lipids were stained with Oil Red O, the dye was extracted with isopropyl alcohol and its absorbance was measured at 540 nm [22].
3-(4, 5-dimethylthiazol-2-yl)-2, 5-diphenyltetrozolium bromide (MTT) assay
The 3T3-L1 preadipocytes were induced with MDI in medium with or without the presence of GTE (0.2-0.5%, w/v) at 37°C for 2 days. At the end of each experiment, cells were incubated with 0.5 mg/ml MTT for 4 h at 37°C. The MTT kit (Life Technologies, USA) was used according to the manufacturer’s manual. The absorbance was determined at 540 nm using a Synergy HT microplate reader (Molecular Devices, Sunnyvale, USA). Viability of treated cells was determined relative to the control cells treated with medium (relative viability).
Quantitative real-time PCR
Extraction of RNA was performed using an RNeasy Protect Kit followed by DNase treatment according to the manufacturer’s instructions. The RNA was transcribed to cDNA using Superscript II according to the manufacturer’s instructions. The products were detected by fluorescence measurement. Quantification of cDNA for each selected gene was conducted by real-time PCR using a LightCycler. The cycle threshold values (Ct values) were calculated by Lightcycler software v.3.5. The expression level of each target gene is shown as the amount relative to GAPDH. These analyses were performed in triplicates for each sample using cells from different conditions. Primers used in this study are listed in Table 2.
Table 2.
Primers used in this study
| Primers | Sequences |
|---|---|
| GAPDH | 5’-GTAATGCACCCAGAGGTATG |
| GAPDH | 5’-CACCAATCTCATGCGGAACT |
| C/EBPα-F | 5’-GACGTTAGCGACACTTCCCT |
| C/EBPα-R | 5’-TGGAGTCGATTATTCCAGTC |
| PPARγ-F | 5’-ATCAATGTGCATACGCAC |
| PPARγ-R | 5’-TTCCGGTGCTATGCAGAG |
Immunoblotting assays
Cells were pelleted by centrifugation, washed twice with PBS. Total proteins were harvested from cells, separated on 10% SDS/PAGE gels, and then subjected to immunoblot analyses. The primary antibodies against C/EBPα, PPARγ, and β-actin were purchased from Santa Cruz, USA (anti-C/EBPα, cat # sc-365318, 1:200; anti-PPARγ, cat # sc-7273, 1:200; anti-β-actin, cat # sc-130301, 1:10,000; anti-ap2, cat # sc-113722, 1:200; anti-LPL, cat # sc-373759, 1:200; anti-Glut4, cat # sc-53566, 1:200; p-AKT, cat # sc-7985, 1:200; anti-Akt, cat # sc-5298, 1:200). The secondary antibodies used in this study were goat anti-mouse IgG-HRP (Cat # sc-2005, 1:10,000, Santa Cruz, USA) or goat anti-rabbit IgG-HRP (Cat # sc-2004, 1:10,000, Santa Cruz, USA). The bound antibodies were detected using the ECL system (Pierce Biotechnology, USA). The immunoblot experiments were repeated at least 3 times. Image quantifications were performed using ImageQuant software. The values are presented as the means ± SD. * P < 0.05, C/EBPα protein levels when compared with the condition with MDI but without GTE. & P < 0.05, PPARγ protein levels when compared with the condition with MDI but without GTE.
Statistical analyses
The experimental data are expressed as mean ± SD. Statistical software (SPSS10.0, Chicago, USA) was used for independent sample t tests, followed by one-way variance analyses. In the analyses, P < 0.05 was considered statistically significant differences.
Results
GTE has not significantly affected the baseline characteristics of these patients
A total of 139 patients were enrolled in this study but 5 of them had not completed the study. Therefore, 134 patients with a mean age of 43.6 ± 6.5 years were investigated (Table 1). Of them, 70 patients received GTE and 64 received water to serve as the control group (Table 1). Values of traditional parameters remained unaltered by GTE for all participants in both groups. No significant differences were noted in baseline characteristics between these two groups in 12 weeks (Table 1).
GTE alters the serum concentrations of adiponectin and visfatin in patients
The concentrations of adiponectin, visfatin, and leptin in patients of both the control group and GTE group were determined by ELISA (Table 3). Pair wise comparisons showed that an increase of serum adiponectin level in the GTE group versus the control group was observed at 12 weeks of the study (P < 0.05, Table 3). The GTE group showed a decrease in visfatin serum levels (P < 0.05) compared to the control group at 12 weeks of the study (P < 0.05, Table 3). GTE supplementation did not significantly affect serum levels of leptin in patients. However, the subcutaneous levels of adiponectin, visfatin, and leptin were not significantly changed between these two groups. These results suggest that GTE decreases the serum concentrations of adiponectin and visfatin in patients.
Table 3.
Levels of cytokines in the GTE and control groups (mean + SD)
| Parameters | Control group (n = 64) | GTE group (n = 70) |
|---|---|---|
| Serum adiponectin (ng/ml) | 1.29 ± 0.25 | 1.69 ± 0.26* |
| Serum visfatin (ng/ml) | 1.37 ± 0.23 | 1.02 ± 0.39* |
| Serum leptin (ng/ml) | 2.54 ± 0.16 | 2.62 ± 0.28 |
| Adiponectin (subcutaneous) | 0.85 ± 0.26 | 0.84 ± 0.15 |
| Visfatin (subcutaneous) | 0.61 ± 0.21 | 0.60 ± 0.33 |
| Leptin (subcutaneous) | 1.42 ± 0.17 | 1.39 ± 0.28 |
P < 0.05, when compared with the control group.
GTE reduces the adipogenesis-induced lipid accumulation in 3T3-L1 preadipocytes
The 3T3-L1 cell line, which was derived from the 3T3-Swiss albino mouse, is often used to study adipogenesis in vitro. The 3T3-L1 cells can differentiate into adipocytes during culture in the presence of MDI. To examine the effect of GTE on adipogenesis, 3T3-L1 preadipocytes were treated with increasing concentrations (0.2-0.5%, w/v) of GTE for 2 days starting from the time of induction of adipogenesis by MDI. For the control group, the cells were cultured in the presence of 0.5% 1, 3-butylene glycol and treated with medium only. The lipid droplets stained with Oil Red O in all conditions were detectible at 3 days after the induction. The amount of accumulated lipids were measured in terms of the absorbance of Oil Red O extracted from stained cells in the experimental groups (0.2-0.5% GTE, w/v) in comparison with the control group treated with 0.5% 1,3-butylene glycol (Figure 1A). As shown in Figure 1A, GTE obviously decreased accumulation of lipid droplets. Furthermore, 0.3-0.5% (w/v) of GTE can significantly reduce the amount of accumulated lipids (P < 0.05) when compared with the untreated cells. These results suggest that GTE reduces the adipogenesis-induced lipid accumulation in 3T3-L1 preadipocytes.
Figure 1.
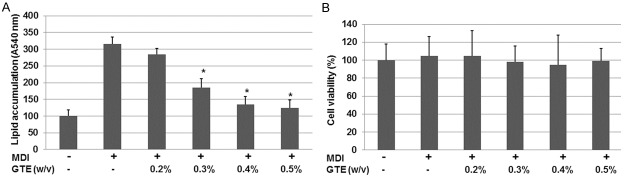
Effects of GTE on the adipogenesis-induced accumulation of lipids and expression of adipocyte-related adiponectin genes in 3T3-L1 preadipocytes. A. Adipogenesis was induced 2 days after the cells reached subconfluence by replacing the regular DMEM medium with induction medium containing MDI or 0.5% (w/v) 1, 3-butylene glycol (control). GTE at increasing concentrations or 0.5% (w/v) or medium was added into the medium. Accumulated lipids were stained with Oil Red O. The amounts of accumulated lipid were measured in terms of the absorbance of Oil Red O extracted from stained cells. Results are expressed as means ± SD of 3 repeats in each group. *P < 0.05, when compared with the control group. B. The effect of GTE on cell viability of 3T3-L1 preadipocytes. 3T3-L1 preadipocytes were treated with GTE (0.2-0.5%, w/v) for 2 days. Cell viability after treatment with GTE was determined by the MTT assay. The values are presented as the means ± SD. The data shown are representative of at least three independent experiments.
To determine if GTE significantly affects cell viability of 3T3-L1 cells, the cells were treated with increasing concentrations (0.2-0.5%, w/v) of GTE for 2 days starting from the time of adipogenesis induction by MDI. Then, the cell viability was determined by MTT. As shown in Figure 1B, these results suggested that GTE does not decrease the cell viability detectibly.
GTE decreases the mRNA expression of adipogenic transcription factors C/EBPα and PPARγ in 3T3-L1 cells
To examine the effect of GTE on adipogenic transcription factors C/EBPα and PPARγ, 3T3-L1 preadipocytes were treated with increasing concentrations (0.2-0.5%, w/v) of GTE for 6 days starting from the time of induction of adipogenesis by MDI. For the control group, the cells were cultured in the presence of 0.5% 1, 3-butylene glycol but treated with medium only. The gene expression of C/EBPα and PPARγ in the early phase of adipogenesis was examined by cDNA reverse transcription followed by real-time PCR detection.
As shown in Figure 2, DMI significantly triggered the mRNA expression of C/EBPα and PPARγ genes. Upon treatments with various concentrations of GTE (0.2%, 0.3%, 0.4%, and 0.5%, w/v), the mRNA levels were reduced significantly. When compared with the untreated cells, the C/EBPα mRNA levels were reduced to 65.4% of the untreated level (P < 0.05). When compared with the untreated cells, the PPARγ mRNA levels were reduced to 55.6% of the untreated level (P < 0.05). When the concentration of GTE was increased to 0.5%, the inhibitory effects on C/EBPα and PPARγ mRNA levels were even more obviously. These results suggest that GTE decreases mRNA expression of adipogenesis transcription factors C/EBPα and PPARγ.
Figure 2.
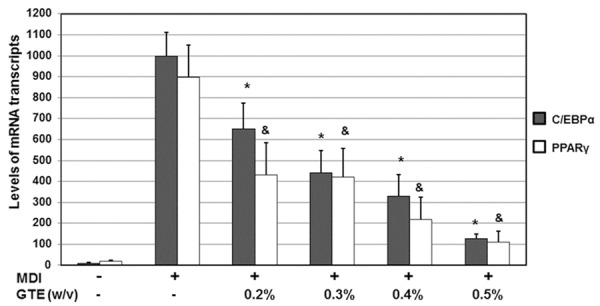
Effects of GTE on the mRNA levels of adipocyte-specific transcription factors in 3T3-L1 adipocytes. 3T3-L1 preadipocytes were differentiated into adipocytes in MDI medium in the absence or presence of increasing concentrations of BPE for 6 days. The total RNAs were isolated from cells. The gene expression analysis was performed by RT-PCR. All of the gene transcripts were normalized using GAPDH as an internal control. All of the experiments were conducted in three independent experiments. The values are presented as the means ± SD. *P < 0.05, C/EBPα mRNA levels when compared with the condition with MDI but without GTE. &P < 0.05, PPARγ mRNA levels when compared with the condition with MDI but without GTE.
GTE decreases the protein expression levels of C/EBPα and PPARγ in 3T3-L1 cells
To examine the effect of GTE on protein levels of C/EBPα and PPARγ, 3T3-L1 preadipocytes were treated with increasing concentrations (0.2-0.5%, w/v) of GTE for 6 days starting from the time of induction of adipogenesis by MDI. The total proteins were extracted and the expression levels of C/EBPα and PPARγ were determined by using immunoblot analysis. The cellular β-actin protein was used as a loading control. The mean normalized level of C/EBPα and PPARγ protein bands relative to that of β-actin band from the same condition was all calculated and subjected to statistical analyses.
As shown in Figure 3A and 3B, DMI significantly triggered the expression of C/EBPα and PPARγ proteins. Representative blots were shown in Figure 3A. Upon treatments with various concentrations of GTE (0.2%, 0.3%, 0.4%, and 0.5%, w/v), the protein levels were reduced significantly. When compared with the untreated cells, the C/EBPα protein levels were reduced to 50.1% of the untreated level (P < 0.05). When compared with the untreated cells, the PPARγ mRNA levels were reduced to 30.6% of the untreated level (P < 0.05). When the concentration of GTE was increased to 0.5%, the inhibitory effects on C/EBPα and PPARγ protein levels were even more obviously. These results suggest that GTE decreases protein expression of adipogenesis transcription factors C/EBPα and PPARγ.
Figure 3.

Effects of GTE on the protein levels of adipocyte-specific transcription factors in 3T3-L1 adipocytes. 3T3-L1 preadipocytes were differentiated into adipocytes in MDI medium in the absence or presence of increasing concentrations of BPE for 6 days. The total proteins were isolated from cells. The protein expression analysis was performed by western blot analyses. All of proteins were normalized using β-actin as a loading control. All of the experiments were conducted in three independent experiments. The values are presented as the means ± SD. *P < 0.05, C/EBPα protein levels when compared with the condition with MDI but without GTE. &P < 0.05, PPARγ protein levels when compared with the condition with MDI but without GTE.
Expression levels of adipocyte-specific genes encoding adipocyte protein 2 (aP2), lipoprotein lipase (LPL), and glucose transporter 4 (Glut4), which are regulated by C/EBPα and PPARγ, were also decreased by GTE
Adipocyte protein 2 (aP2), lipoprotein lipase (LPL), and glucose transporter 4 (Glut4) are three proteins regulated by C/EBPα and PPARγ. To further investigate the effects of GTE on C/EBPα and PPARγ, expression of these three proteins were also determined. 3T3-L1 preadipocytes were treated with 0.3% or 0.5% (w/v) GTE for 6 days starting from the time of induction of adipogenesis by MDI. The total proteins were isolated and the expression levels of aP2, LPL, and Glut4 were determined by immunoblot analyses. The cellular β-actin protein was used as a loading control. The mean normalized level of aP2, LPL, and Glut4 proteins relative to those of β-actin bands from the same condition was all calculated and subjected to statistical analyses. As shown in Figure 4, the expression levels of aP2, LPL, and Glut4 were all decreased by more than 50% when treated with 0.5% (w/v) GTE for 6 days. These results suggest that GTE reduces expression of the adipocyte-specific genes.
Figure 4.

Effects of GTE on expression of adipocyte-related aP2, LPL, and Glut4. 3T3-L1 preadipocytes were differentiated into adipocytes in MDI medium and treated with BPE (0%, 0.3%, or 0.5% (w/v) for 6 days. The total proteins were isolated from cells. The protein expression analysis was performed by western blot analyses. All of proteins were normalized using β-actin as the loading control. All of the experiments were conducted in three independent experiments. The values are presented as the means ± SD. *P < 0.05, aP2 protein levels when compared with the condition with MDI but without GTE. &P < 0.05, LPL protein levels when compared with the condition with MDI but without GTE. #P < 0.05, Glut4 protein levels when compared with the condition with MDI but without GTE.
GTE reduces phosphorylation of Akt during adipocyte differentiation
Akt is a protein playing important roles in lipid metabolism of the insulin pathway in the process of adipocyte differentiation. To study the molecular mechanisms underlying the GTE-induced effects, the effects of GTE on the levels of phosphorylation of Akt during adipocyte differentiation of 3T3-L1 cells was determined. The 3T3-L1 cells were treated with 0.3% or 0.5% (w/v) GTE for 6 days starting from the time of induction of adipogenesis by MDI. As shown in Figure 5, the phosphorylation of Akt was significantly reduced upon treatment with GTE. However, the expression levels of total Akt proteins had not changed when compared with the controls (Figure 5). These results suggest that GTE reduces phosphorylation of Akt during adipocyte differentiation.
Figure 5.

Effects of GTE on phosphorylation of Akt during Adipocyte Differentiation. 3T3-L1 preadipocytes were differentiated into adipocytes in MDI medium and treated with BPE (0%, 0.3%, or 0.5% (w/v)) for 6 days. The total proteins were isolated from cells. The protein expression analysis was performed by western blot analyses. β-actin was used as the loading control. The values are given as means ± SD. *P < 0.05, the levels of phosphorylated Akt protein when compared with the condition with MDI but without GTE. All of the experiments were conducted in three independent experiments.
Discussion
In this study, we found that GTE can increase the serum concentrations of adiponectin but decrease visfatin serum levels in patients who received GTE treatments. The cell viability experiments revealed that GTE can reduce the adipogenesis-induced lipid accumulation in 3T3-L1 preadipocytes. Further studies of the underlying mechanisms indicated that GTE decreases the mRNA and protein expression of adipogenic transcription factors C/EBPα and PPARγ in 3T3-L1 cells. The changes in C/EBPα and PPARγ expression levels then affect levels of the down-stream gene products. The levels of adipocyte protein 2, lipoprotein lipase, and glucose transporter 4 were indeed decreased by GTE. Furthermore, it was found that GTE reduces phosphorylation of Akt during adipocyte differentiation.
Akt is an important signaling factor in a large number of molecular pathways [23,24]. Akt plays important roles in lipid metabolism of the insulin pathway in the process of adipocyte differentiation [25-28]. A glucagon-like peptide was found to be able to regulate 3T3-L1 adipogenesis [25]. Moreover, the Akt signaling pathway is believed to be possibly involved in this process [25]. Therefore, the differentiated adipocytes may have a positive effect inhibiting or attenuating insulin resistance and obesity [25]. In this study, we found that GTE reduces phosphorylation of Akt during adipocyte differentiation. However, the increased phosphorylation of Akt at the plasma membrane, low-density membranes, and cytosol was found in 3T3-L1 adipocytes by a mechanism possibly related to activation of the mammalian target of rapamycin pathway, which then acutely inhibits insulin signaling to Akt in human adipocytes [27].
In this study, we investigate the effects of GTE on adipogenesis. Mechanisms underlying the effects of several compounds with natural resources were recently reported. The anti-adipogenic activity of citrus aurantium flavonoids was mediated by inhibition of Akt activation and GSK3β phosphorylation [29]. Such effect down-regulates expression of some genes involved in lipid accumulation and lipid metabolism, thus inhibiting differentiation of adipocytes [29]. The curry compound curcumin was found to significantly attenuate the effects of high fat diet on glucose disposal, body weight, and fat gain, and development of insulin resistance [30]. It has been discovered that the beneficial effects of curcumin during high fat diet consumption is mediated by attenuation of lipogenic gene expression in the liver and the inflammatory responses in adipose tissues [30]. The results in this study enrich our understanding of usefulness of compounds with natural resources in the medicine field.
Acknowledgements
This work was supported by the National Natural Science Funds of China grant (No. 81170762).
Disclosure of conflict of interest
None.
References
- 1.Horiakwa C, Yoshimura Y, Kamada C, Tanaka S, Tanaka S, Hanyu O, Araki A, Ito H, Tanaka A, Ohashi Y, Akanuma Y, Yamada N, Sone H. Dietary sodium intake and incidence of diabetes complications in Japanese patients with type 2 diabetes: Analysis of the Japan Diabetes Complications Study (JDCS) J Clin Endocrinol Metab. 2014;99:3635–43. doi: 10.1210/jc.2013-4315. [DOI] [PubMed] [Google Scholar]
- 2.Wang S, Fang F, Jin WB, Wang X, Zheng DW. Assessment of serum arginase I as a type 2 diabetes mellitus diagnosis biomarker in patients. Exp Ther Med. 2014;8:585–590. doi: 10.3892/etm.2014.1768. [DOI] [PMC free article] [PubMed] [Google Scholar]
- 3.McFarlane AC. The long-term costs of traumatic stress: intertwined physical and psychological consequences. World Psychiatry. 2010;9:3–10. doi: 10.1002/j.2051-5545.2010.tb00254.x. [DOI] [PMC free article] [PubMed] [Google Scholar]
- 4.Musso G, Gambino R, Tabibian JH, Ekstedt M, Kechagias S, Hamaguchi M, Hultcrantz R, Hagström H, Yoon SK, Charatcharoenwitthaya P, George J, Barrera F, Hafliðadóttir S, Björnsson ES, Armstrong MJ, Hopkins LJ, Gao X, Francque S, Verrijken A, Yilmaz Y, Lindor KD, Charlton M, Haring R, Lerch MM, Rettig R, Völzke H, Ryu S, Li G, Wong LL, Machado M, Cortez-Pinto H, Yasui K, Cassader M. Association of non-alcoholic fatty liver disease with chronic kidney disease: a systematic review and Meta-analysis. PLoS Med. 2014;11:e1001680. doi: 10.1371/journal.pmed.1001680. [DOI] [PMC free article] [PubMed] [Google Scholar]
- 5.Kalra PR, García-Moll X, Zamorano J, Kalra PA, Fox KM, Ford I, Ferrari R, Tardif JC, Tendera M, Greenlaw N, Steg PG CLARIFY Investigators. Impact of chronic kidney disease on use of evidence-based therapy in stable coronary artery disease: a prospective analysis of 22,272 patients. PLoS One. 2014;9:e102335. doi: 10.1371/journal.pone.0102335. [DOI] [PMC free article] [PubMed] [Google Scholar]
- 6.Moon MH, Jeong JK, Lee YJ, Seol JW, Park SY. Sphingosine-1-phosphate inhibits the adipogenic differentiation of 3T3-L1 preadipocytes. Int J Mol Med. 2014;34:1153–1158. doi: 10.3892/ijmm.2014.1856. [DOI] [PubMed] [Google Scholar]
- 7.Krautbauer S, Eisinger K, Hader Y, Buechler C. Free fatty acids and IL-6 induce adipocyte galectin-3 which is increased in white and brown adipose tissues of obese mice. Cytokine. 2014;69:263–71. doi: 10.1016/j.cyto.2014.06.016. [DOI] [PubMed] [Google Scholar]
- 8.Robati RM, Partovi-Kia M, Haghighatkhah HR, Younespour S, Abdollahimajd F. Increased serum leptin and resistin levels and increased carotid intima-media wall thickness in patients with psoriasis: Is psoriasis associated with atherosclerosis? J Am Acad Dermatol. 2014;71:642–648. doi: 10.1016/j.jaad.2014.06.006. [DOI] [PubMed] [Google Scholar]
- 9.Bansal S, Chopra K. Distinct role of estrogen receptor-alpha and beta on postmenopausal diabetes-induced vascular dysfunction. Gen Comp Endocrinol. 2014;206C:51–59. doi: 10.1016/j.ygcen.2014.06.013. [DOI] [PubMed] [Google Scholar]
- 10.Ji S, Yang R, Lu C, Qiu Z, Yan C, Zhao Z. Differential expression of PPARγ, FASN, and ACADM genes in various adipose tissues and longissimus dorsi muscle from Yanbian yellow cattle and Yan yellow cattle. Asian-Australas J Anim Sci. 2014;27:10–18. doi: 10.5713/ajas.2013.13422. [DOI] [PMC free article] [PubMed] [Google Scholar]
- 11.Richard AJ, Burris TP, Sanchez-Infantes D, Wang Y, Ribnicky DM, Stephens JM. Artemisia extracts activate PPARγ, promote adipogenesis, and enhance insulin sensitivity in adipose tissue of obese mice. Nutrition. 2014;30:S31–36. doi: 10.1016/j.nut.2014.02.013. [DOI] [PMC free article] [PubMed] [Google Scholar]
- 12.Wilding JP. PPAR agonists for the treatment of cardiovascular disease in patients with diabetes. Diabetes Obes Metab. 2012;14:973–982. doi: 10.1111/j.1463-1326.2012.01601.x. [DOI] [PubMed] [Google Scholar]
- 13.Ren W, Guo J, Jiang F, Lu J, Ding Y, Li A, Liang X, Jia W. CCAAT/enhancer-binding protein α is a crucial regulator of human fat mass and obesity associated gene transcription and expression. Biomed Res Int. 2014;2014:406909. doi: 10.1155/2014/406909. [DOI] [PMC free article] [PubMed] [Google Scholar]
- 14.Grant RW, Nguyen KY, Ravussin A, Albarado D, Youm YH, Dixit VD. Inactivation of C/ebp homologous protein driven immune-metabolic interactions exacerbate obesity and adipose tissue leukocytosis. J Biol Chem. 2014;289:14045–14055. doi: 10.1074/jbc.M113.545921. [DOI] [PMC free article] [PubMed] [Google Scholar]
- 15.Jung HA, Jung HJ, Jeong HY, Kwon HJ, Ali MY, Choi JS. Phlorotannins isolated from the edible brown alga Ecklonia stolonifera exert anti-adipogenic activity on 3T3-L1 adipocytes by downregulating C/EBPα and PPARγ. Fitoterapia. 2014;92:260–269. doi: 10.1016/j.fitote.2013.12.003. [DOI] [PubMed] [Google Scholar]
- 16.Hawley SA, Fullerton MD, Ross FA, Schertzer JD, Chevtzoff C, Walker KJ, Peggie MW, Zibrova D, Green KA, Mustard KJ, Kemp BE, Sakamoto K, Steinberg GR, Hardie DG. The ancient drug salicylate directly activates AMP-activated protein kinase. Science. 2012;336:918–922. doi: 10.1126/science.1215327. [DOI] [PMC free article] [PubMed] [Google Scholar]
- 17.Shaw RJ, Cantley LC. Cell biology. Ancient sensor for ancient drug. Science. 2012;336:813–814. doi: 10.1126/science.1223140. [DOI] [PubMed] [Google Scholar]
- 18.Yu Y, Wu Y, Szabo A, Wu Z, Wang H, Li D, Huang XF. Teasaponin reduces inflammation and central leptin resistance in diet-induced obese male mice. Endocrinology. 2013;154:3130–3140. doi: 10.1210/en.2013-1218. [DOI] [PubMed] [Google Scholar]
- 19.Zhou CJ, Huang S, Liu JQ, Qiu SQ, Xie FY, Song HP, Li YS, Hou SZ, Lai XP. Sweet tea leaves extract improves leptin resistance in diet-induced obese rats. J Ethnopharmacol. 2013;145:386–392. doi: 10.1016/j.jep.2012.09.057. [DOI] [PubMed] [Google Scholar]
- 20.Lambert JD. Does tea prevent cancer? Evidence from laboratory and human intervention studies. Am J Clin Nutr. 2013;98:1667S–1675S. doi: 10.3945/ajcn.113.059352. [DOI] [PubMed] [Google Scholar]
- 21.Saleh IG, Ali Z, Abe N, Wilson FD, Hamada FM, Abd-Ellah MF, Walker LA, Khan IA, Ashfaq MK. Effect of green tea and its polyphenols on mouse liver. Fitoterapia. 2013;90:151–159. doi: 10.1016/j.fitote.2013.07.014. [DOI] [PubMed] [Google Scholar]
- 22.Ramirez-Zacarias JL, Castro-Munozledo F, Kuri-Harcuch W. Quantitation of adipose conversion and triglycerides by staining intracytoplasmic lipids with Oil red O. Histochemistry. 1992;97:493–497. doi: 10.1007/BF00316069. [DOI] [PubMed] [Google Scholar]
- 23.Blume-Jensen P, Hunter T. Oncogenic kinase signalling. Nature. 2001;411:355–365. doi: 10.1038/35077225. [DOI] [PubMed] [Google Scholar]
- 24.Yuan J, Yankner BA. Apoptosis in the nervous system. Nature. 2000;407:802–809. doi: 10.1038/35037739. [DOI] [PubMed] [Google Scholar]
- 25.Yang J, Ren J, Song J, Liu F, Wu C, Wang X, Gong L, Li W, Xiao F, Yan F, Hou X, Chen L. Glucagon-like peptide 1 regulates adipogenesis in 3T3-L1 preadipocytes. Int J Mol Med. 2013;31:1429–1435. doi: 10.3892/ijmm.2013.1350. [DOI] [PubMed] [Google Scholar]
- 26.Pang W, Wang Y, Wei N, Xu R, Xiong Y, Wang P, Shen Q, Yang G. Sirt1 inhibits akt2-mediated porcine adipogenesis potentially by direct protein-protein interaction. PLoS One. 2013;8:e71576. doi: 10.1371/journal.pone.0071576. [DOI] [PMC free article] [PubMed] [Google Scholar]
- 27.Tremblay F, Gagnon A, Veilleux A, Sorisky A, Marette A. Activation of the mammalian target of rapamycin pathway acutely inhibits insulin signaling to Akt and glucose transport in 3T3-L1 and human adipocytes. Endocrinology. 2005;146:1328–1337. doi: 10.1210/en.2004-0777. [DOI] [PubMed] [Google Scholar]
- 28.Arribas M, Valverde AM, Benito M. Role of IRS-3 in the insulin signaling of IRS-1-deficient brown adipocytes. J Biol Chem. 2003;278:45189–45199. doi: 10.1074/jbc.M301185200. [DOI] [PubMed] [Google Scholar]
- 29.Kim GS, Park HJ, Woo JH, Kim MK, Koh PO, Min W, Ko YG, Kim CH, Won CK, Cho JH. Citrus aurantium flavonoids inhibit adipogenesis through the Akt signaling pathway in 3T3-L1 cells. BMC Complement Altern Med. 2012;12:31. doi: 10.1186/1472-6882-12-31. [DOI] [PMC free article] [PubMed] [Google Scholar]
- 30.Shao W, Yu Z, Chiang Y, Yang Y, Chai T, Foltz W, Lu H, Fantus IG, Jin T. Curcumin prevents high fat diet induced insulin resistance and obesity via attenuating lipogenesis in liver and inflammatory pathway in adipocytes. PLoS One. 2012;7:e28784. doi: 10.1371/journal.pone.0028784. [DOI] [PMC free article] [PubMed] [Google Scholar]