

Abstract
Background
The development of novel targeted cancer therapies and/or diagnostic tools is dependent upon an understanding of the differential expression of molecular targets between normal tissues and tumors. Many of these potential targets are cell-surface receptors; however, our knowledge of the cell-surface proteins upregulated in pancreatic tumors is limited, thus impeding the development of targeted therapies for pancreatic cancer. To develop new diagnostic and therapeutic tools to specifically target pancreatic tumors, we sought to identify cell-surface proteins that may serve as potential tumor-specfic targets.
Methods
Membrane glycoproteins on the pancreatic cancer cell lines BxPC-3 were labeled with the bifunctional linker biocytin hydrazide. Following proteolytic digestion, biotinylated glycopeptides were captured with streptavidin-coupled beads then released by PNGaseF-mediated endoglycosidase cleavage and identified by liquid chromatography-tandem mass spectrometry (MS). A protein identified by the cell-surface glycoprotein capture procedure, CD109, was evaluated by western analysis of lysates of pancreatic cancer cell lines and by immunohistochemistry in sections of pancreatic ductal adenocarcinoma and non- neoplastic pancreatic tissues.
Results
MS/MS analysis of glycopeptides captured from BxPC-3 cells revealed 18 proteins predicted or known to be associated with the plasma membrane, including CD109, which has not been reported in pancreatic cancer. Western analysis of CD109 in lysates prepared from pancreatic cancer cell lines revealed it was expressed in 6 of 8 cell lines, with a high level of expression in BxPC-3, MIAPaCa-2, and Panc-1 cells. Immunohistochemical analyses of human pancreatic tissues indicate CD109 is significantly overexpressed in pancreatic tumors compared to normal pancreas.
Conclusions
The selective capture of glycopeptides from the surface of pancreatic cancer cell lines can reveal novel cell-surface glycoproteins expressed in pancreatic ductal adenocarcinomas.
Keywords: Pancreatic cancer, Glycoproteins, Proteomic profiling
Introduction
Pancreatic cancer is the fourth most common cause of cancer-related deaths in the United States [1], and is projected to be the second leading cause of cancer-related death by 2030 [2]. For over a decade, gemcitabine has been the standard of care for chemotherapy-based treatment of patients with locally advanced and metastatic pancreatic cancer, however, most studies have demonstrated low response rates and little impact on patient survival [3]. Based on the poor performance of current therapeutic modalities for pancreatic cancer, it is evident that new approaches for the treatment of this deadly neoplasm would have a major impact.
Targeted therapies are now a component of treatment for many types of cancer, including breast cancer and lymphoma. Targeted therapies may be used to 1) block the proliferation of cancer cells by interfering with specific molecules required for tumor development and growth, 2) enhance antibody-dependent cellular and complement-dependent cytotoxicity, or 3) facilitate delivery of novel nanoparticle conjugates specifically to tumor cells. Some of these targeting molecules may be present in normal tissues, but they are often mutated or overexpressed in tumors. Currently, our knowledge of the cell-surface proteins upregulated in pancreatic tumors is limited; thus impeding the development of similar targeted therapies for pancreatic cancer.
Since MS-based proteomics permit sensitive identification and quantification of large numbers of peptides or proteins, novel approaches have been developed to identify the cell- surface proteome by quantitative MS, including lectin-based methods, cell surface shaving, two-phase separation, and antibody-mediated membrane enrichment [4]. Recently, a novel method has been described for the selective isolation of N-linked glycoproteins for the analysis of the cell-surface glycoproteome, termed cell-surface capture (CSC) [4-6]. Since a compendium of such molecular targets is vital for the development of novel targeted therapies, in this study we have used the cell-surface capture procedure to specifically identify glycoproteins residing on the cell surface of a pancreatic cancer cell line, BxPC-3, and validated the identification of a cell-surface protein, CD109, in human pancreatic ductal adenocarcinoma (PDAC) tissues by immunohistochemistry (IHC).
Materials and Methods
Cell culture
Pancreatic cancer cell lines AsPC-1, BxPC-3, Capan-1, CFPAC-1, MIAPaCa-2, and Panc-1 were obtained from the American Type Culture Collection (ATCC, Manassas, VA). A818-4 cells were kindly provided by Professor Holger Kalthoff (Institute for Experimental Cancer Research, UKSH-Campus Kiel, Kiel, Germany) and Suit-2 cells [7] were obtained from Dr. Michael Hollingsworth (Eppley Institute, University of Nebraska Medical Center, Omaha, NE). All cells were maintained in Dulbecco's Modified Eagle's Medium (Mediatech, Manassas, VA) supplemented with 10% fetal bovine serum (Atlanta Biologicals, Norcross, GA) at 37°C in a 5% CO2/air environment.
Cell-surface glycoprotein capture
For cell-surface glycoprotein capture, BxPC-3 cells were cultured in twenty 10-cm dishes to yield ∼108 cells. The cells were harvested by scraping in phosphate-buffered saline (PBS), collected by centrifugation, and washed twice with labeling buffer (PBS, pH 6.5, 0.1% fetal bovine serum). To oxidize the carbohydrate moieties on the cell-surface proteins, the cells were suspended in 1.6 mM sodium meta-periodate (Fisher Scientific, Palantine, IL) in PBS, pH 6.5, and incubated in the dark for 15 min at 4°C. The cells were collected by centrifugation and washed twice with labeling buffer to remove residual sodium meta-periodate and dead cells.
The cell-surface proteins were then labeled by suspending the cells in labeling buffer containing 5 mM of the bi-functional linker biocytin hydrazide (Biotium, Hayward, CA) and incubating for 1 h at 4°C on a rotator. The labeled cells were collected by centrifugation and washed twice with labeling buffer to remove unreacted biocytin hydrazide and dead cells. The cells were then lysed by suspending the cell pellet in ice-cold hypotonic buffer (10 mM Tris-HCl, pH 7.5, 0.5 mM MgCl2) and disrupting the cells with a glass Dounce homogenizer. After adding an equal volume of membrane prep buffer (280 mM sucrose, 50 mM MES, pH 6, 450 mM NaCl, 10 mM MgCl2) to the lysates, nuclei and intact cells were removed by centrifugation at 2,500 g at 4°C for 10 min.
The homogenization procedure was repeated with the pellet and the supernatants containing the membrane fraction were combined and centrifuged at 150,000 at 4°C for 1 h. The resulting pellet was incubated with 25 mM Na2CO3, pH 11, for 30 min on ice, and then the ultracentrifugation was repeated. The labeled membrane preparation was suspended in 50 mM ammonium bicarbonate containing 0.1% of the surfactant RapiGest SF (Waters, Milford, MA) with the aid of a sonicator. The protein concentration was determined using a bicinchoninic acid (BCA) assay (Sigma-Aldrich, St. Louis, MO). Proteins were reduced with 5 mM Tris(2-carboxyethyl)phosphine hydrochloride (Sigma-Aldrich, St. Louis, MO) and alkylated with 10 mM iodoacetamide (Sigma-Aldrich, St. Louis, MO) for 30 min in the dark at 25°C. The proteins were digested for 4 h with Lys-C (1:100) (EMD Biosciences, La Jolla, CA) and subsequently with Mass Spectrometry Grade Trypsin Gold (1:20) (Promega, Madison, WI) overnight. The peptide mixture was boiled for 10 min to inactivate the proteases and protease inhibitors (Roche Complete protease inhibitor cocktail, Indianapolis, IN) were added. The biotinylated glycopeptides were captured by incubating with UltraLink Streptavidin Plus beads (Pierce, Rockford, IL), equilibrated with 50 mM ammonium bicarbonate, for 1 h on a rotator. The glycopeptides captured on the streptavidin beads were washed successively with 0.5% Triton-100 in 50 mM ammonium bicarbonate, 50 mM ammonium bicarbonate, 5 M NaCl, 100 mM sodium carbonate, pH 11, and 100 mM ammonium bicarbonate. The washed beads were incubated in 100 mM ammonium bicarbonate containing 22,500 units of PNGaseF (New England Biolabs, Beverly, MA) overnight at 37°C on a rotator to release the N-linked glycopeptides. The supernatant was collected and the beads were washed once with 50 mM ammonium bicarbonate. The combined supernatants were concentrated and desalted using UltraMicroSpin columns containing C18 resin (Nest Group, Southborough, MA). The resin was washed with 50 mM ammonium bicarbonate/0.1% TFA and the retained peptides were eluted with 70% acetonitrile/0.1% TFA.
LC-MS/MS
The eluate from the C18 column was dried in a SpeedVac and resolubilized in 0.1% formic acid (Pierce, Rockford, IL). Tryptic peptides were separated by reverse phase Jupiter Proteo resin (Phenomenex, Torrance, CA) on a 100×0.075 mm column using a nano2D HPLC system (Eksigent, Framingham, MA). Peptides were eluted using a 45 min gradient from 97:3 to 35:65 buffer A:B ratio [buffer A=0.1% formic acid, 0.5% acetonitrile; buffer B=0.1% formic acid, 75% acetonitrile]. Eluted peptides were ionized by electrospray (2.0 kV) followed by MS/MS analysis using collision induced dissociation on an LTQ XL mass spectrometer (Thermo Scientific, Waltham, MA). MS data were acquired over a range of 375 to 1500 m/z. MS/MS data were then acquired for the top 7 peaks from each MS scan using a normalized collision energy of 35.0. Proteins were identified from MS/MS spectra by database searching using the Mascot Server 2.4 search engine (Matrix Science, Boston, MA, on-site license) with a peptide mass tolerance of 2.0 Da, fragment mass tolerance of ± 0.5 Da, a maximum of 2 missed tryptic cleavages, and fixed carbamidomethylation of cysteine modification and variable deamidation, acetylation, and oxidation modifications. The Mascot results were uploaded into Scaffold 4.3.4 (Proteome Software, Portland, OR) for viewing the proteins and peptide information. A peptide threshold of 20% with protein threshold of 95% and a minimum of one peptide were used as the cutoff values, and spectral counts were exported into an Excel spreadsheet for analysis.
Western blot
Confluent monolayers of pancreatic cancer cell lines were harvested by scraping, washed with PBS, and collected by centrifugation. Cell pellets were suspended in RIPA buffer (1 mM EDTA, 1% NP-40, 0.5% deoxycholate, 0.1% SDS in PBS) containing Complete protease inhibitor cocktail (Roche, Indianapolis, IN). The cell lysates were sonicated on ice and centrifuged at 13,000 rpm to remove any cell debris and the protein concentration of each lysate was determined by BCA assay. Equal amounts of each sample (40 μg of total protein) were separated by gel electrophoresis using 4-12% gradient Bis-Tris NuPage gels (Life Technologies, Carlsbad, CA) and transferred to a PVDF membrane. The membrane was blocked with a 5% non-fat milk solution in PBS, pH 7.4, containing 0.1% Tween-20 (PBST) then incubated overnight at 4°C with anti-human CD109 antibody (AF4385, R&D Systems, Minneapolis, MN) diluted 1:2,000 with 2% non-fat milk/PBST. After washing with PBST, proteins were visualized by chemiluminescence using ECL plus reagent (GE Healthcare, Piscataway, NJ) and a ChemiDoc XRS image documentation system and Quantity One analysis software (Bio-Rad, Hercules, CA).
Immunohistochemistry
Formalin-fixed, paraffin-embedded tissue blocks from 11 non-malignant pancreas and 18 PDAC tissues were prepared for immunohistochemical analysis. Representative hematoxylin and eosin-stained sections from each tissue were evaluated by microscopic analysis. Sections (4 μm) were deparaffinized and rehydrated in xylene followed by graded ethanol. Antigen retrieval was performed in a pressure cooker using 10 mM citrate, pH 6.0, for 20 minutes. Endogenous peroxidase activity was quenched by hydrogen peroxide treatment followed by serum-free protein block (DakoCytomation, Carpinteria, CA). Sections were incubated with a sheep anti-CD109 antibody (AF4385, R&D Systems, Minneapolis, MN), diluted 1:800 in antibody diluent (DakoCytomation, Carpinteria, CA), overnight at 4°C Immunoreactive staining was detected using a DAKO LSAB+ peroxidase system followed by hematoxylin counterstain. The staining intensity for the CD109 protein and the percentage of positive cells was scored by a pathologist (C-YF), and a composite score was calculated as follows. The staining intensity for the CD109 protein was assigned a score from 0 to 3 based on staining, with 0 indicating no staining; 1+, weakly positive; 2+, moderately positive; and 3+, strongly positive. The percentage of positive cells was scored as: 0, no positive cells; 1+, 1-25% positive cells; 2+, 26-50% positive cells; 3+, 51-75% positive cells; 4+, >75% positive cells. The composite score was calculated as the product of the staining-intensity score and the positive-percentage score, and thus ranged from 0 to 12. Staining with composite scores < 3 was categorized as Low, staining with composite scores 3-5 was categorized as moderate, while staining ≥ 6 was categorized as high. Images were captured with an Olympus BX41 microscope equipped with a SPOT RT color CCD camera and SPOT Advanced imaging software (Ver 5.1, SPOT Imaging Solutions, Sterling Heights, MI).
Statistical analysis
The PDAC and Normal samples were compared statistically at a P<0.05 significance level for the group difference in composite IHC scores via two-sided Wilcoxon test, a generalization of the Mann-Whitney U test. All statistical analysis employed Prism 6 (GraphPad software, La Jolla, CA).
Results
Identification of cell-surface lycoproteins
To identify cell-surface glycoproteins on pancreatic cancer cells, we employed the CSC procedure with a pancreatic cell line, BxPC-3. MS/MS analysis of peptides from the labeled cell- surface proteins revealed 84 potential cell-surface proteins identified with >95% confidence. Table 1 summarizes the 25 proteins with at least two spectral counts that were identified from the BxPC-3 cells. Eighteen of the 25 proteins are predicted or known to be associated with the plasma membrane and organized as a single-pass, multi-pass, or GPI-linked membrane protein. Each of these 18 proteins is also predicted to be N-linked glycosylated, which is consistent with post-translational glycosylation during their transit through the Golgi apparatus toward their residence on the cell surface. Furthermore, as expected for glycoproteins labeled with biocytin in the CSC procedure, most of the peptides identified by MS from these proteins contain an NXS/T T motif. The remaining seven proteins identified all lack an N-linked glycosylation motif and are not predicted to be N-linked glycoproteins; and thus, likely represent contaminating proteins retained during the purification procedure.
Table 1.
Summary of proteins identified by cell-surface capture.
| UniProt ID | Gene Symbol | Name | Locationa | Membrane Organizationb | N-linkedc | NXS/Td | Spectral Count |
|---|---|---|---|---|---|---|---|
| P05556 | ITGB1 | Integrin beta-1 | PM | Type I | Y | 7/7 | 7 |
| Q6YHK3 | CD109 | CD109 antigen | PM | GPI | Y | 6/6 | 6 |
| P05362 | ICAM1 | Intercellular adhesion molecule 1 | PM | Type I | Y | 4/5 | 5 |
| P06731 | CEACAM5 | Carcinoembryonic antigen- related cell adhesion molecule 5 | PM | GPI | Y | 3/5 | 5 |
| P09758 | TACSTD2 | Tumor-associated calcium signal transducer 2 | PM | Type I | Y | 3/3 | 3 |
| P13726 | F3 | Tissue factor | PM | Type I | Y | 3/3 | 3 |
| P35527 | KRT9 | Keratin, type I cytoskeletal 9 | Extracellular | 0/3 | 3 | ||
| P35613 | BSG | Basigin | PM | Type I | Y | 2/2 | 2 |
| Q14126 | DSG2 | Desmoglein-2 | PM | Type I | Y | 2/2 | 2 |
| Q08722 | CD47 | Leukocyte surface antigen CD47 | PM | Multi-pass | Y | 2/2 | 2 |
| P17301 | ITGA2 | Integrin alpha-2 | PM | Type I | Y | 2/2 | 2 |
| P08473 | MME | Neprilysin, CD10 | PM | Type II | Y | 2/2 | 2 |
| P04156 | PRNP | Major prion protein | PM | GPI | Y | 2/2 | 2 |
| Q15758 | SLC1A5 | Neutral amino acid transporter B(0) | PM | Multi-pass | Y | 2/2 | 2 |
| P26006 | ITGA3 | Integrin alpha-3 | PM | Type I | Y | 2/2 | 2 |
| Q9Y639 | NPTN | Neuroplastin | PM | Type I | Y | 2/2 | 2 |
| P06756 | ITGAV | Integrin alpha-V | PM | Type I | Y | 2/2 | 2 |
| Q9H0X4 | ITFG3 | Integrin alpha FG-GAP repeat containing 3 | PM | Type II | Y | 2/2 | 2 |
| P08195 | SLC3A2 | 4F2 cell-surface antigen heavy chain | PM | Type II | Y | 1/2 | 2 |
| Q9Y2I7 | PIKFYVE | 1-phosphatidylinositol 3-phosphate 5-kinase | Endo | N | 0/2 | 2 | |
| Q86XA9 | HEATR5A | HEAT repeat-containing protein 5A | N | 0/2 | 2 | ||
| Q8IVF2 | AHNAK2 | Protein AHNAK2 | Nucleus | N | 0/2 | 2 | |
| P04264 | KRT1 | Keratin, type II cytoskeletal 1 | PM | N | 0/2 | 2 | |
| P33778 | HIST1H2BB | Histone H2B type 1-B | Nucleus | N | 0/2 | 2 | |
| Q92529 | SHC3 | SHC-transforming protein 3 | Cytosol | N | 0/2 | 2 |
PM–Plasma membrane, Endo–Endosomal membrane
Type I – Type I membrane protein, Type II–Type II membrane protein, Multi-pass–Multi-pass membrane protein, GPI–Glycosylphosphatidylinositol-anchored membrane protein
Protein predicted to have N-linked glycosylation
Number of peptides identified with NXS/T glycosylation motif/Number of peptides identified
The protein identified with the highest spectral count, integrin beta-1, has been previously reported to be overexpressed in PDAC in numerous studies at both the mRNA [8-10] and protein [11-14] levels. The protein with the second highest spectral count, CD109, is a GPI- linked glycoprotein that is typically found on the cell surface of platelets, activated T-cells, and endothelial cells [15]. It has also been reported to be expressed in squamous cell carcinomas [16] and basal-like breast carcinoma [17]. Consistent with the selective capture of glycoproteins after labeling oxidized sugars with a hydrazide-activated biocytin, five unique CD109 peptides were identified that all possess an NXSS/T glycosylation sequence (Table 2). Similar to our findings, peptides corresponding to CD109 were also identified in a screen of proteins secreted from a pancreatic cancer-derived (Panc-1) and nonneoplastic pancreatic ductal cell line (HPDE) [12], but expression of CD109 in pancreatic tumors has not previously been verified.
Table 2.
CD109 peptides identified by MS/MS.
| Sequencea | Mascot Ion Score | Start Position | Stop Position | Modifications |
|---|---|---|---|---|
| (K)TASNLTVSVLEAEGVFEK(G) | 52.12 | 65 | 82 | |
| (K)TASNLTVSVLEAEGVFEK(G) | 25.9 | 65 | 82 | |
| (R)TQDEILFSNSTR(L) | 28.94 | 110 | 121 | Deamidated (+1) |
| (R)NYTEYWSGSNSGNQK(M) | 67.41 | 397 | 411 | Deamidated (+1) |
| (K)INYTVPQSGTFK(I) | 28.25 | 418 | 429 | |
| (K)QNSTMFSLTPENSWTPK(A) | 70.75 | 512 | 528 | Deamidated (+1) Oxidation (+16) |
Deamidated asparagine and oxidized methionine residues in bold, N-glycosylation motif underlined, amino acids in parentheses indicate residues preceding and following trypsin cleavage
CD109 is expressed in multiple pancreatic cancer cell lines
To further evaluate the expression of CD109 in pancreatic cancer, western analysis was performed on lysates prepared from 8 pancreatic cancer cell lines using a CD109 antibody (Figure 1). CD109 expression was detected in 6 of the 8 cell lines (75%), with a high level in 3 of the 8 (38%) cell lines, including BxPC-3 cells; thus, verifying the success of the MS-based glycoprotein profiling strategy. As expected, this cell-surface protein is expressed in variable levels in different cells, confirming that the use of multiple pancreatic cancer cell lines to assess cell-surface protein expression is essential for the characterization of the pancreatic cancer cell- surface glycoproteome.
Figure 1. Western analysis of CD109 in pancreatic cancer cell lysates.
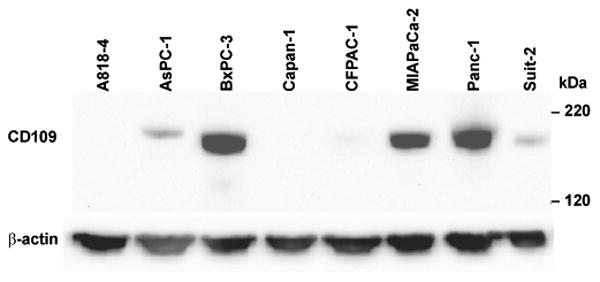
Whole-cell lysates prepared from 8 pancreatic cancer cell lines were separated by SDS-PAGE, transferred to PVDF membrane, and probed with antibodies directed against CD109 (upper panel) or β-actin (lower panel) as a loading control.
CD109 is overexpressed in pancreatic ductal adenocarcinomas
We examined the cell-surface glycoproteome of BxPC-3 cells, which were established from a biopsy specimen of primary pancreatic adenocarcinoma [18], as a surrogate for human tumors. To determine whether the CD109 protein identified in the CSC procedure of BxPC-3 cells was 1) expressed in pancreatic tumors and 2) upregulated in tumors compared with normal pancreas, IHC was performed on a panel of 18 tissues sections with PDAC and 11 sections with normal pancreas tissue. As depicted in Figure 2, variable CD109 protein expression was observed in the invasive carcinoma cells, ranging from weak (panel A), moderate (panel B), to strong staining (panel C). The positive staining reaction was observed primarily along the cytoplasmic membrane and in the cytoplasm of the carcinoma cells (Figure 2A, B and C). By contrast, most normal ductal components within PDAC and in normal pancreatic tissue showed either completely negative stain for the CD109 protein (Figure 2D) or rare cases showing only focal and weak immunoreactivity for the protein. The antibody appears to be very specific for the ductal epithelia of cancer cells because it did not react with other pancreatic tissue components, such as blood vessels, stromal fibrous tissues, pancreatic acini, adipose tissue and inflammatory cells. A total of 3 of 11 (22%) of normal pancreatic tissue showed focal and weak immunostaining for CD109 (Figure 3). Moderate-to-high CD109 expression was detected in 4 of 18 (22%) and 7 of 18 (39%) PDAC specimens, respectively (Figure 3). Thus, a majority (11 of 18; 61%) of the PDAC showed significantly higher expression of CD109 compared to normal ducts in normal pancreatic tissue. The varied expression of CD109 observed in the pancreatic cancer cell lines (Figure 1) is thus very similar to the protein expression detected in human tumor specimens. Although high levels of CD109 have been reported in glioblastoma and squamous cell carcinoma cell lines [16], to our knowledge our findings represent the first description of the upregulation of CD109 in pancreatic cancer.
Figure 2. Expression of CD109 in Pancreatic Adenocarcinoma.
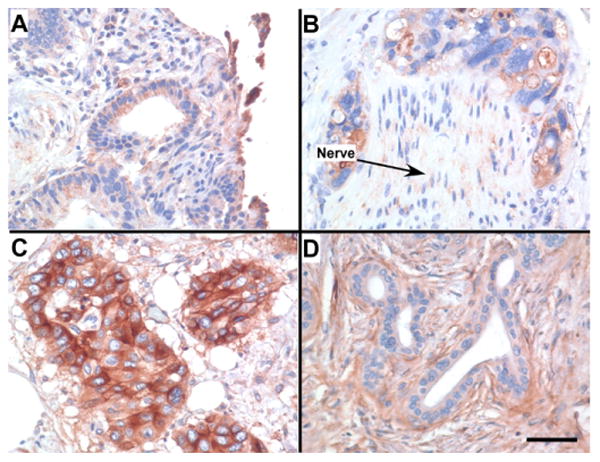
Invasive carcinoma cells were semi-quantitatively analyzed to assign the levels of CD109 protein expression as weak (A;+), moderate (B; 2+) and strong (C; 3+). Normal ducts from the same tumor as seen in C were stained negatively (D; -) for the CD109 protein. Perineural invasion by the tumor is seen in B (arrow). Scale bar=5 μm.
Figure 3. CD109 is significantly overexpressed in pancreatic ductal adenocarcinoma compared to normal pancreas tissue.
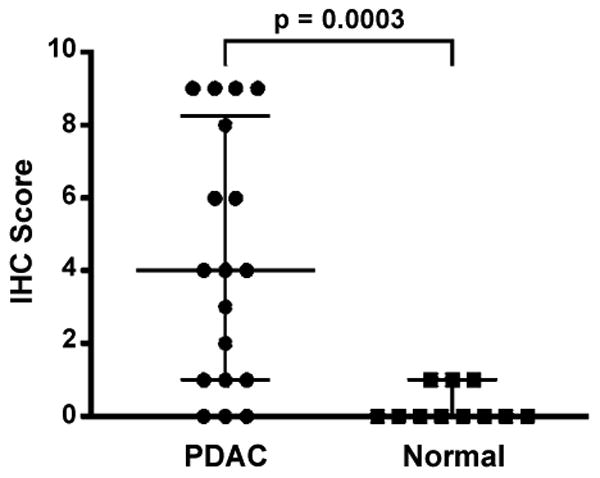
Intensity and distribution of staining for CD109 was evaluated in sections of pancreatic ductal adenocarcinoma (PDAC, n=18) and normal pancreas (n=11) tissue samples (see Methods). The composite IHC score determined for each sample is depicted along with the median score and interquartile range for each group (horizontal bars). The score difference between the groups was assessed for statistical significance at P<0.05 via two-sided Wilcoxon test.
Discussion
Numerous gene profiling studies, including our own [19], have been performed to identify genes differentially expressed in pancreatic tumors and cell lines [8,20-35]. Although these studies have increased our understanding of molecular pathways activated or suppressed in pancreatic adenocarcinomas, transcription analyses do not necessarily correlate with protein abundance, and thus provide only an indirect measure of alterations in protein levels [36]. Furthermore, the ability to identify cell-surface resident proteins in these studies is indirect and highly dependent upon the quality of the gene annotation data associated with the bioinformatic analyses, and may not adequately reflect the proteins displayed on the cell surface. Recently, advances in mass spectrometry (MS)-based methods have provided a direct means to profile cell-surface proteins; thus, we utilized a cell-surface capture procedure to selectively isolate and identify N-linked glycoproteins on the cell surface of a pancreatic cancer cell line which was used as a surrogate for human pancreatic ductal adenocarcinoma.
MS analysis of glycopeptides captured from the surface of BxPC-3 cells revealed the presence of glycoproteins previously associated with pancreatic cancer (e.g., integrin beta-1, intercellular adhesion molecule 1) as well as novel pancreatic cancer cell-surface proteins (e.g., CD109). The majority of the glycoproteins identified (72%) are predicted to reside on the cell surface (e.g., type I or type II membrane proteins) and have N-linked glycosylation sequences, which highlights the ability of the CSC procedure to specifically enrich for glycoproteins.
Since the expression of CD109 has not been thoroughly investigated in pancreatic cancer previously, we examined its expression in lysates of 8 pancreatic cancer cell lines by western analysis. Consistent with its MS-based identification in BxPC-3 cells following CSC, a high level of CD109 expression was observed in the BxPC-3 cell lysate. Variable levels of expression were observed in other pancreatic cancer cell lines, including a lack of expression in A818-4 and Capan-1 cells. This indicates that multiple cell lines must be used to generate a comprehensive catalog of cell-surface proteins expressed in pancreatic cancer.
Since immortalized cancer cell lines only serve as surrogates for human tumors, we examined CD109 expression in a series of human PDAC tumor and normal pancreas tissue sections by IHC. These studies indicated that CD109 is significantly overexpressed in the invasive carcinoma cells of the PDAC specimens compared to normal pancreatic tissue. Similar to the pancreatic cancer cell lines, variable CD109 protein expression was also observed in the pancreatic tumors, which is expected based on the genetic heterogeneity demonstrated among individual PDAC tumors [37]. These findings suggest that potential therapeutic targets revealed by cell-surface glycoprotein profiling may only serve a subset of patients and underscores that personalized therapeutic interventions will likely be required to target tumor-specific glycoproteins.
Overall, these results confirm that the CSC procedure was highly effective in identifying novel cell-surface proteins in pancreatic cancer and that the profiling the glycoproteome can provide valuable insights into the proteins upregulated on the surface of pancreatic tumors that may serve as targets for the development of novel diagnostic tools and/or therapies for this devastating disease.
Acknowledgments
This work was supported in part by the Department of Veterans Affairs, Veterans Health Administration, Office of Research and Development, Biomedical Laboratory Research and Development, VA Merit Award 01BX000828 (RSH), the National Institutes of Health grants R01GM106024 (AJT), R33CA173264 (AJT), UL1RR029884, P30GM103450, P20GM103625, and P20GM103429, and the UAMS Proteomics Core Facility. The authors thank Drs. Kalthoff and Hollingsworth for kindly providing pancreatic cancer cell lines used in this study.
Abbreviations
- BCA
Bicinchoninic Acid
- CSC
Cell-Surface Capture
- IHC
Immunohistochemistry
- MS
Mass Spectrometry
- PBS
Phosphate-Buffered Saline
- PDAC
Pancreatic Ductal Adenocarcinoma
References
- 1.Siegel R, Ma J, Zou Z, Jemal A. Cancer statistics, 2014. CA Cancer J Clin. 2014;64:9–29. doi: 10.3322/caac.21208. [DOI] [PubMed] [Google Scholar]
- 2.Rahib L, Smith BD, Aizenberg R, Rosenzweig AB, Fleshman JM, et al. Projecting cancer incidence and deaths to 2030: the unexpected burden of thyroid, liver, and pancreas cancers in the United States. Cancer Res. 2014;74:2913–2921. doi: 10.1158/0008-5472.CAN-14-0155. [DOI] [PubMed] [Google Scholar]
- 3.Shore S, Raraty MG, Ghaneh P, Neoptolemos JP. Review article: chemotherapy for pancreatic cancer. Aliment Pharmacol Ther. 2003;18:1049–1069. doi: 10.1111/j.1365-2036.2003.01781.x. [DOI] [PubMed] [Google Scholar]
- 4.Wollscheid B, Bausch-Fluck D, Henderson C, O'Brien R, Bibel M, et al. Mass-spectrometric identification and relative quantification of N-linked cell surface glycoproteins. Nat Biotechnol. 2009;27:378–386. doi: 10.1038/nbt.1532. [DOI] [PMC free article] [PubMed] [Google Scholar]
- 5.Gundry RL, Raginski K, Tarasova Y, Tchernyshyov I, Bausch-Fluck D, et al. The mouse C2C12 myoblast cell surface N-linked glycoproteome: identification, glycosite occupancy, and membrane orientation. Mol Cell Proteomics. 2009;8:2555–2569. doi: 10.1074/mcp.M900195-MCP200. [DOI] [PMC free article] [PubMed] [Google Scholar]
- 6.Schiess R, Mueller LN, Schmidt A, Mueller M, Wollscheid B, et al. Analysis of cell surface proteome changes via label-free, quantitative mass spectrometry. Mol Cell Proteomics. 2009;8:624–638. doi: 10.1074/mcp.M800172-MCP200. [DOI] [PMC free article] [PubMed] [Google Scholar]
- 7.Iwamura T, Katsuki T, Ide K. Establishment and characterization of a human pancreatic cancer cell line (SUIT-2) producing carcinoembryonic antigen and carbohydrate antigen 19-9. Jpn J Cancer Res. 1987;78:54–62. [PubMed] [Google Scholar]
- 8.Iacobuzio-Donahue CA, Maitra A, Olsen M, Lowe AW, van Heek NT, et al. Exploration of global gene expression patterns in pancreatic adenocarcinoma using cDNA microarrays. Am J Pathol. 2003;162:1151–1162. doi: 10.1016/S0002-9440(10)63911-9. [DOI] [PMC free article] [PubMed] [Google Scholar]
- 9.Zhou G, Chiu D, Qin D, Niu L, Cai J, et al. Detection and clinical significance of CD44v6 and integrin-β1 in pancreatic cancer patients using a triplex real-time RT-PCR assay. Appl Biochem Biotechnol. 2012;167:2257–2268. doi: 10.1007/s12010-012-9752-2. [DOI] [PubMed] [Google Scholar]
- 10.Van den Broeck A, Vankelecom H, Van Eijsden R, Govaere O, Topal B. Molecular markers associated with outcome and metastasis in human pancreatic cancer. J Exp Clin Cancer Res. 2012;31:68. doi: 10.1186/1756-9966-31-68. [DOI] [PMC free article] [PubMed] [Google Scholar]
- 11.Chen R, Brentnall TA, Pan S, Cooke K, Moyes KW, et al. Quantitative proteomics analysis reveals that proteins differentially expressed in chronic pancreatitis are also frequently involved in pancreatic cancer. Mol Cell Proteomics. 2007;6:1331–1342. doi: 10.1074/mcp.M700072-MCP200. [DOI] [PubMed] [Google Scholar]
- 12.Gronborg M, Kristiansen TZ, Iwahori A, Chang R, Reddy R, et al. Biomarker Discovery from Pancreatic Cancer Secretome Using a Differential Proteomic Approach. Mol Cell Proteomics. 2006;5:157–171. doi: 10.1074/mcp.M500178-MCP200. [DOI] [PubMed] [Google Scholar]
- 13.Crnogorac-Jurcevic T, Gangeswaran R, Bhakta V, Capurso G, Lattimore S, et al. Proteomic analysis of chronic pancreatitis and pancreatic adenocarcinoma. Gastroenterology. 2005;129:1454–1463. doi: 10.1053/j.gastro.2005.08.012. [DOI] [PubMed] [Google Scholar]
- 14.Gesierich S, Paret C, Hildebrand D, Weitz J, Zgraggen K, et al. Colocalization of the tetraspanins, CO-029 and CD15, with integrins in human pancreatic adenocarcinoma: impact on cell motility. Clin Cancer Res. 2005;11:2840–2852. doi: 10.1158/1078-0432.CCR-04-1935. [DOI] [PubMed] [Google Scholar]
- 15.Lin M, Sutherland DR, Horsfall W, Totty N, Yeo E, et al. Cell surface antigen CD109 is a novel member of the alpha(2) macroglobulin/C3, C4, C5 family of thioester-containing proteins. Blood. 2002;99:1683–1691. doi: 10.1182/blood.v99.5.1683. [DOI] [PubMed] [Google Scholar]
- 16.Hashimoto M, Ichihara M, Watanabe T, Kawai K, Koshikawa K, et al. Expression of CD109 in human cancer. Oncogene. 2004;23:3716–3720. doi: 10.1038/sj.onc.1207418. [DOI] [PubMed] [Google Scholar]
- 17.Hasegawa M, Moritani S, Murakumo Y, Sato T, Hagiwara S, et al. CD109 expression in basal-like breast carcinoma. Pathol Int. 2008;58:288–294. doi: 10.1111/j.1440-1827.2008.02225.x. [DOI] [PubMed] [Google Scholar]
- 18.Tan MH, Nowak NJ, Loor R, Ochi H, Sandberg AA, et al. Characterization of a new primary human pancreatic tumor line. Cancer Invest. 1986;4:15–23. doi: 10.3109/07357908609039823. [DOI] [PubMed] [Google Scholar]
- 19.Johnson SK, Dennis RA, Barone GW, Lamps LW, Haun RS. Differential Expression of Insulin Growth Factor Binding Protein 5 in Pancreatic Adenocarcinomas: Identification Using DNA Microarray. Mol Carcinog. 2006;45:814–827. doi: 10.1002/mc.20203. [DOI] [PubMed] [Google Scholar]
- 20.Iacobuzio-Donahue CA, Maitra A, Shen-Ong GL, van Heek T, Ashfaq R, et al. Discovery of novel tumor markers of pancreatic cancer using global gene expression technology. Am J Pathol. 2002;160:1239–1249. doi: 10.1016/S0002-9440(10)62551-5. [DOI] [PMC free article] [PubMed] [Google Scholar]
- 21.Iacobuzio-Donahue CA, Ryu B, Hruban RH, Kern SE. Exploring the host desmoplastic response to pancreatic carcinoma: gene expression of stromal and neoplastic cells at the site of primary invasion. Am J Pathol. 2002;160:91–99. doi: 10.1016/S0002-9440(10)64353-2. [DOI] [PMC free article] [PubMed] [Google Scholar]
- 22.Han H, Bearss DJ, Browne LW, Calaluce R, Nagle RB, et al. Identification of differentially expressed genes in pancreatic cancer cells using cDNA microarray. Cancer Res. 2002;62:2890–2896. [PubMed] [Google Scholar]
- 23.Logsdon CD, Simeone DM, Binkley C, Arumugam T, Greenson JK, et al. Molecular Profiling of Pancreatic Adenocarcinoma and Chronic Pancreatitis Identifies Multiple Genes Differentially Regulated in Pancreatic Cancer. Cancer Res. 2003;63:2649–2657. [PubMed] [Google Scholar]
- 24.Iacobuzio-Donahue CA, Ashfaq R, Maitra A, Adsay NV, Shen-Ong GL, et al. Highly expressed genes in pancreatic ductal adenocarcinomas: a comprehensive characterization and comparison of the transcription profiles obtained from three major technologies. Cancer Res. 2003;63:8614–8622. [PubMed] [Google Scholar]
- 25.Crnogorac-Jurcevic T, Efthimiou E, Nielsen T, Loader J, Terris B, et al. Expression profiling of microdissected pancreatic adenocarcinomas. Oncogene. 2002;21:4587–4594. doi: 10.1038/sj.onc.1205570. [DOI] [PubMed] [Google Scholar]
- 26.Crnogorac-Jurcevic T, Missiaglia E, Blaveri E, Gangeswaran R, Jones M, et al. Molecular alterations in pancreatic carcinoma: expression profiling shows that dysregulated expression of S100 genes is highly prevalent. J Pathol. 2003;201:63–74. doi: 10.1002/path.1418. [DOI] [PubMed] [Google Scholar]
- 27.Missiaglia E, Blaveri E, Terris B, Wang YH, Costello E, et al. Analysis of gene expression in cancer cell lines identifies candidate markers for pancreatic tumorigenesis and metastasis. Int J Cancer. 2004;112:100–112. doi: 10.1002/ijc.20376. [DOI] [PubMed] [Google Scholar]
- 28.Tan ZJ, Hu XG, Cao GS, Tang Y. Analysis of gene expression profile of pancreatic carcinoma using cDNA microarray. World J Gastroenterol. 2003;9:818–823. doi: 10.3748/wjg.v9.i4.818. [DOI] [PMC free article] [PubMed] [Google Scholar]
- 29.Nakamura T, Furukawa Y, Nakagawa H, Tsunoda T, Ohigashi H, et al. Genome- wide cDNA microarray analysis of gene expression profiles in pancreatic cancers using populations of tumor cells and normal ductal epithelial cells selected for purity by laser microdissection. Oncogene. 2004;23:2385–2400. doi: 10.1038/sj.onc.1207392. [DOI] [PubMed] [Google Scholar]
- 30.Grützmann R, Pilarsky C, Ammerpohl O, Lüttges J, Böhme A, et al. Gene expression profiling of microdissected pancreatic ductal carcinomas using high-density DNA microarrays. Neoplasia. 2004;6:611–622. doi: 10.1593/neo.04295. [DOI] [PMC free article] [PubMed] [Google Scholar]
- 31.Prasad NB, Biankin AV, Fukushima N, Maitra A, Dhara S, et al. Gene expression profiles in pancreatic intraepithelial neoplasia reflect the effects of Hedgehog signaling on pancreatic ductal epithelial cells. Cancer Res. 2005;65:1619–1626. doi: 10.1158/0008-5472.CAN-04-1413. [DOI] [PubMed] [Google Scholar]
- 32.Friess H, Ding J, Kleeff J, Fenkell L, Rosinski JA, et al. Microarray-based identification of differentially expressed growth- and metastasis-associated genes in pancreatic cancer. Cell Mol Life Sci. 2003;60:1180–1199. doi: 10.1007/s00018-003-3036-5. [DOI] [PMC free article] [PubMed] [Google Scholar]
- 33.Grützmann R, Saeger HD, Lüttges J, Schackert HK, Kalthoff H, et al. Microarray-based gene expression profiling in pancreatic ductal carcinoma: status quo and perspectives. Int J Colorectal Dis. 2004;19:401–413. doi: 10.1007/s00384-003-0563-3. [DOI] [PubMed] [Google Scholar]
- 34.Brandt R, Grützmann R, Bauer A, Jesnowski R, Ringel J, et al. DNA microarray analysis of pancreatic malignancies. Pancreatology. 2004;4:587–597. doi: 10.1159/000082241. [DOI] [PubMed] [Google Scholar]
- 35.Gardner-Thorpe J, Ito H, Ashley SW, Whang EE. Differential display of expressed genes in pancreatic cancer cells. Biochem Biophys Res Commun. 2002;293:391–395. doi: 10.1016/S0006-291X(02)00237-1. [DOI] [PubMed] [Google Scholar]
- 36.Gygi SP, Rochon Y, Franza BR, Aebersold R. Correlation between protein and mRNA abundance in yeast. Mol Cell Biol. 1999;19:1720–1730. doi: 10.1128/mcb.19.3.1720. [DOI] [PMC free article] [PubMed] [Google Scholar]
- 37.Samuel N, Hudson TJ. The molecular and cellular heterogeneity of pancreatic ductal adenocarcinoma. Nat Rev Gastroenterol Hepatol. 2011;9:77–87. doi: 10.1038/nrgastro.2011.215. [DOI] [PubMed] [Google Scholar]