

Abstract
Aim
To investigate, with extended follow-up, cause-specific mortality among low-income Black and White Americans with Type 2 diabetes who have similar socio-economic status.
Methods
Black and White Americans aged 40–79 years with Type 2 diabetes (n = 12 498) were recruited from community health centres as part of the Southern Community Cohort Study. Multivariable Cox analysis was used to estimate mortality hazard ratios and 95% CIs for subsequent cause-specific mortality, based on both underlying and contributing causes of death.
Results
During the follow-up (median 5.9 years), 13.3% of the study population died. The leading causes of death in each race were ischaemic heart disease, respiratory disorders, cancer, renal failure and heart failure; however, Blacks were at a lower risk of dying from ischaemic heart disease (hazard ratio 0.70, 95% CI 0.54–0.91) or respiratory disorders (hazard ratio 0.70, 0.53–0.92) than Whites but had higher or similar mortality attributable to renal failure (hazard ratio 1.57, 95% CI 1.02–2.40), heart failure (hazard ratio 1.47, 95% CI 0.98–2.19) and cancer (hazard ratio 0.87, 95% CI 0.62–1.22). Risk factors for each cause of death were generally similar in each race.
Conclusions
These findings suggest that the leading causes of death and their risk factors are largely similar among Black and White Americans with diabetes. For the two leading causes of death in each race, however, ischaemic heart disease and respiratory disorders, the magnitude of risk is lower among Black Americans and contributes to their higher survival rates.
What's new?
In a US population, we have recently observed lower mortality risk in Black Americans than in their White American counterparts with Type 2 diabetes.
In these analyses we show that in Black and White Americans with similar socio-economic status, risk factors for specific causes of death were generally similar in each race, while risk of dying from ischaemic heart disease and respiratory disorders, the two leading causes in both races, were significantly lower in black people.
Our data suggest that when socio-economic status is similar, the risk factors for mortality are similar in Black and White Americans, while mortality risk is actually lower in Black Americans.
Introduction
Black people are at a substantially higher risk of developing diabetes compared with White people in the USA, and national age-adjusted diabetes mortality rates are twice as high among Blacks compared with Whites 1; however, we have previously shown that in Black and White Americans with similar low incomes, the prevalence of diabetes is nearly the same 2. More recently, we have also shown that among these low income people with diabetes, overall mortality is actually somewhat lower in Black Americans 3. Identifying specific causes of death in diabetes, and whether they differ by race, may move us closer to ultimately reducing diabetes mortality among both Black and White Americans.
Few cause-specific mortality data are available on Black people with diabetes in the USA and on whether diabetes disproportionately affects specific mortality outcomes in Black compared with White people. Most racial comparisons are strongly confounded by large differences in education and income in which statistical methods are not convincingly able to adjust for these confounders. The aim of the present paper, therefore, was to investigate cause-specific mortality by race in a low-income population with Type 2 diabetes with similar socio-economic status. Our purpose was threefold: 1) to characterize the contribution of specific complications and comorbidities of diabetes to total mortality in a low-income population with diabetes; 2) to identify risk factors for specific diabetes mortality outcomes in each race; and 3) to identify why, given the presence of diabetes, Blacks had a lower all-cause mortality risk than their White counterparts.
Methods
The Southern Community Cohort Study (SCCS) is a population-based prospective study designed to investigate the causes of health disparities between Black and White Americans in the incidence of and mortality from cancer and other chronic diseases. Details of the rationale, study design and methods have been described previously 4. The SCCS cohort includes 64 091 participants aged 40–79 years, recruited during 2002–2008 from community health centres in 12 states in the south-east of the USA. This cohort was the focus of the present report. Community health centres, i.e. federally qualified health centres, are government-funded healthcare facilities offering basic healthcare and preventative services to the medically underserved. All study procedures were approved by the institutional review boards of Vanderbilt University and Meharry Medical College.
After providing informed consent, participants completed a 40–60-min in-person interview, during which data were collected on medical history, lifestyle and socio-economic factors. If a participant answered ‘yes’ to the question ‘Has a doctor ever told you that you have diabetes or high blood sugar?’, he/she was asked questions about their age at diabetes diagnosis and medications prescribed to treat the disease. Women were specifically asked not to include gestational diabetes in their reporting. For the current analysis, we excluded participants with missing information on diabetes status (n = 339) or age at first diabetes diagnosis (n = 196), as well as those reporting a first diagnosis of diabetes before the age of 30 years (n = 1149). Black or White participants (exclusively) diagnosed with diabetes at or after the age of 30 years (n = 12 498, 96%) thus formed our cohort with Type 2 diabetes.
Mortality status and underlying and contributing causes of death were determined from linkages of the SCCS population with the National Death Index database, with mortality censored on 31 December 2010, increasing the person-years of observation by 53% compared with our previous National Death Index follow-up 3. Contributors to the cause of death in people with diabetes are especially difficult to investigate when diabetes is listed as the underlying cause of death and only underlying causes are assessed. Because ‘diabetes’ as the underlying cause of death is not particularly informative and data relying only on the underlying causes of death listed on death certificates may substantially underestimate the impact of diabetes-related complications on total mortality in people with diabetes, we used both the underlying and contributing causes listed on the death certificates in determining cause-specific mortality 5,6. Thus, in the present analyses, an individual could appear in more than one outcome; he/she could have renal failure as a contributing cause of death as well as ischaemic heart disease; that is, cause-specific deaths were based on the mention of that cause anywhere on the death certificate.
Our outcomes of interest were ischaemic heart disease and the other top five leading causes of death in this cohort; namely, cancer, heart failure, renal failure, respiratory disorders and sepsis. The International Classification of Diseases-10 codes, listed as either the underlying or contributing cause of death, were used to define the above disease classifications are shown in Appendix 1. Because of their non-specificity as a cause of death, the following were excluded as outcomes from these analyses: diabetes (death is caused by specific complications of diabetes, whether chronic, such as renal failure or ischaemic heart disease, or acute such as hypoglycaemia, ketoacidosis), cardiac arrest (everyone's heart stops when he or she dies; this is generally listed when the cause of death is unknown) and essential hypertension (death is caused by complications of essential hypertension). Five people had invalid death dates and were also excluded from the analysis.
General linear models were used to test for differences in continuous variables and chi-squared tests were used for categorical data. Race was self-reported based on pre-specified categories. Because of sample size limitations in other racial/ethnic groups, race-specific analyses of effect modification by race were conducted in Blacks and Whites only. Cox proportional hazards modelling, using age as the time scale, was used to determine hazard ratios and their 95% CIs for all-cause and cause-specific mortality among those with diabetes. The models were computed both overall and separately for Blacks and Whites. Multivariable adjusted models in all races combined controlled for sex, race, duration of diabetes, BMI, type of anti-hyperglycaemic therapy, and baseline histories of ischaemic heart disease, stroke/transient ischaemic attack, hypertension, high cholesterol and treatment for high cholesterol, and smoking (never/current/former). Race-specific multivariable adjusted models controlled for sex, duration of diabetes, anti-hyperglycaemic therapy, high cholesterol and treatment for high cholesterol, and smoking (never/current/former). We chose the available variables that we considered to be clinically most important as well as being the standard variables that are adjusted for in this type of mortality analysis. Event numbers limited further adjustment for other variables. Before assessing survival from specific causes of death among those with diabetes, to document the higher mortality associated with diabetes we conducted Cox modelling of the causes of death among those with vs those without diabetes in the SCCS cohort.
Because we have previously observed effect modification by race for ischaemic heart disease on all-cause mortality in this population with diabetes, effect modification by race on cause-specific mortality was assessed for the following ischaemic heart disease risk factors known to vary by race: history of ischaemic heart disease, hypertension, high cholesterol and smoking. The criterion for statistical significance for assessing such interaction initially was a two-tailed P value of < 0.10, although we then considered a threshold of 0.014, taking into account the multiple comparisons made across seven strata of these four variables. We also tested for effect modification by education and income on the relationship of race with all-cause mortality. Statistical analysis was conducted using sas version 9.3 (Cary, NC, USA).
Results
Characteristics of the Black and White Americans with Type 2 diabetes are shown in Table1. The characteristics of people of both races were generally similar, with the exceptions that Blacks more often reported being on insulin therapy alone and were less likely to be taking no oral hyperglycaemic therapy or to have had hypercholesterolaemia, ischaemic heart disease and acid reflux. A total of 65% of the population had an annual household income of < $15,000 and 86% had an annual household income of < $25,000, with a similar distribution between Blacks and Whites.
Table 1.
Baseline characteristics of the population from the Southern Community Cohort Study with Type 2 diabetes*
| Characteristics | Black Americans, n = 8978 | White Americans, n = 3041 | P |
|---|---|---|---|
| Sex: female, % (n) | 66.5 (5974) | 67.5 (2054) | 0.31 |
| Mean (sd) age, years | 55.1 (8.9) | 56.2 (9.0) | < 0.0001 |
| Mean (sd) age at diagnosis, years | 46.8 (9.1) | 48.5 (9.5) | < 0.0001 |
| Mean (sd) diabetes duration, years | 7.9 (7.4) | 7.2 (6.9) | < 0.0001 |
| Median (IQR) BMI at age 21 years, kg/m² | 23.3 (20.6–26.7) | 23.7 (20.7–28.2) | < 0.0001 |
| Median (IQR) current BMI, kg/m² | 32.6 (28.2–38.2) | 33.9 (29.2–39.5) | < 0.0001 |
| Insulin therapy use only†, % (n) | 20.1 (1670) | 12.2 (356) | < 0.0001 |
| Oral hyperglycaemic therapy use only†, % (n) | 54.3 (4520) | 55.9 (1629) | 0.13 |
| Insulin and oral hyperglycaemic therapy use†, % (n) | 11.3 (939) | 12.2 (355) | 0.19 |
| No hyperglycaemic medication†, % (n) | 14.4 (1201) | 19.7 (574) | < 0.0001 |
| Hypertension, % (n) | 82.9 (7441) | 78.0 (2371) | < 0.0001 |
| Hypercholesterolaemia, % (n) | 50.6 (4531) | 63.3 (1917) | < 0.0001 |
| Cholesterol-lowering medication, % (n) | |||
| None | 65.4 (5848) | 53.7 (1626) | < 0.0001 |
| Statin | 27.8 (2488) | 38.1 (1152) | < 0.0001 |
| Other cholesterol medication | 6.8 (610) | 8.2 (248) | 0.01 |
| Ischaemic heart disease, % (n) | 10.7 (962) | 18.6 (565) | < 0.0001 |
| Stroke/transient ischaemic attack, % (n) | 10.8 (969) | 12.2 (371) | 0.03 |
| Glaucoma, % (n) | 8.7 (776) | 4.8 (146) | < 0.0001 |
| Cataract, % (n) | 16.9 (1514) | 21.0 (639) | < 0.0001 |
| Acid reflux/heart burn, % (n) | 30.2 (2711) | 40.5 (1231) | < 0.0001 |
| A history of smoking, % (n) | 57.2 (5127) | 63.2 (1921) | < 0.0001 |
| Current smoker, % (n) | 30.0 (2688) | 30.9 (939) | 0.34 |
| Education < 12 years, % (n) | 38.7 (3475) | 34.9 (1061) | 0.0002 |
| Annual household income, % (n) | |||
| < $15,000 | 65.7 (5831) | 63.3 (1906) | 0.02 |
| $15,000–$24,999 | 21.5 (1904) | 21.0 (631) | 0.56 |
| ≥ $25,000 | 12.8 (1138) | 15.8 (475) | < 0.0001 |
IQR, interquartile range.
Type 2 diabetes defined as diabetes diagnosed at or after the age of 30 years. Those diagnosed before age 30 were excluded from analyses.
Three individuals had missing data on diabetes medication use and 775 individuals had missing data on type of diabetes medication used. Number of individuals with other missing data: hypertension, n = 3; high cholesterol or type of medication for high cholesterol, n = 47; ischaemic heart disease, n = 13; smoking, n = 8.
During the follow-up period (mean 5.9 years), 13.3% (n = 1660) of the population died. The mortality risk was significantly lower in Blacks than in Whites (22.8 vs 27.5/1000 person years; hazard ratio 0.79, 95% CI 0.70–0.89), consistent with our previous report 3. This lower risk did not vary when stratified by income or education (P value for multiplicative interaction=0.74 for income and 0.43 for education, data not shown).
The leading causes of non-accidental death among those with diabetes were ischaemic heart disease (n = 311), respiratory disorders (n = 303), cancer (n = 232), renal failure (n = 200), heart failure (n = 191) and sepsis (n = 170). Table2 shows that the leading causes of death were similar in Blacks and Whites. The excess risk of dying from these specific causes in this population with diabetes compared with the SCCS population without diabetes is shown in Fig.1. With the exception of those with cancer, those with diabetes had a two- to fourfold excess risk of dying from these causes compared with those without diabetes. No excess risk associated with diabetes was observed for cancer mortality.
Table 2.
Leading causes of death in Black and White Americans with Type 2 diabetes
| Black Americans, % | White Americans, % | |
|---|---|---|
| Ischaemic heart disease | 17.5 | 22.9 |
| Respiratory disorders | 16.7 | 21.9 |
| Cancer | 14.3 | 12.1 |
| Renal failure | 14.2 | 6.7 |
| Heart failure | 12.9 | 8.3 |
| Sepsis | 11 | 8.3 |
Percentages represent the percentage that died where this complication or comorbidity was an underlying or contributing cause.
Figure 1.

Cause-specific mortality in those with Type 2 diabetes compared with those without diabetes. Hazard ratio (95% CIs) associated with having Type 2 diabetes.
Multivariable adjusted risk in Black Americans compared with White Americans with diabetes for the leading cause-specific mortality outcomes and diabetes-related mortality outcomes are shown in Fig.2. Blacks had a lower mortality risk attributable to ischaemic heart disease or respiratory disorders, but a higher risk of mortality caused by renal failure and a suggested higher risk of heart failure mortality. Black Americans also had a lower risk of dying from accidents/suicides/injuries.
Figure 2.
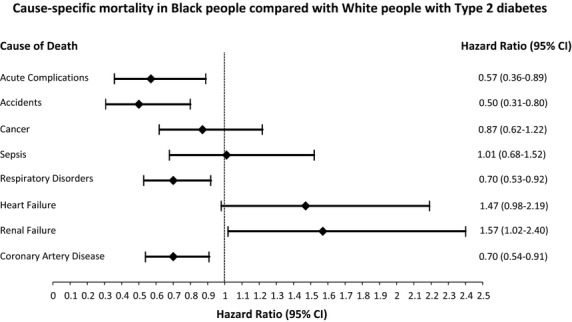
Cause-specific mortality in Black compared with White people with Type 2 diabetes. Hazard ratios (95% CIs) associated with Black race for the specified mortality outcomes. Models controlled for sex, duration of diabetes, anti-hyperglycaemic therapy, high cholesterol and treatment for high cholesterol and smoking (never/current/former). Models for ischaemic heart disease mortality and respiratory disorders mortality additionally adjusted for BMI, a history of ischaemic heart disease at baseline and hypertension. Mortality rates per 1000 person-years were: ischaemic heart disease (4.7 in Black people vs 6.8 in White people); renal failure (3.2 in Black people vs 1.8 in White people); heart failure (3.0 in Black people vs 2.3 in White people); Respiratory disorders (3.8 in Black people vs 6.0 in White people); Sepsis (2.5 in Black people vs 2.3 in White people); cancer (3.3 in Black people vs 3.3 in White people); Accidents (1.1 in Black people vs 1.9 in White people); acute complications (0.39 in Black people vs. 0.32 in White people).
Table3 shows the multivariable adjusted hazard ratios associated with the patient characteristics for the leading cause-specific mortality outcomes of interest. Risk factors for cause-specific mortality generally included male sex, being on insulin therapy and smoking. Risks of death from ischaemic heart disease, sepsis and renal failure increased with duration of diabetes, whereas diabetes duration had little or no effect on risk of other causes of death. Unlike for the other causes of death, neither insulin therapy alone nor insulin + oral anti-hyperglycaemic therapy was associated with cancer mortality. Histories of ischaemic heart disease and hypertension were each associated with ischaemic heart disease, renal failure and heart failure mortality, while a history of ischaemic heart disease was additionally associated with respiratory disorders mortality. Both current and former smoking were associated with a higher risk of each of the specific causes of death except for cancer, for which current but not former smoking was associated with higher mortality.
Table 3.
Multivariable adjusted hazard ratios for cause-specific mortality by patient characteristics in those with Type 2 diabetes
| Ischaemic heart disease | Renal failure | Heart failure | Respiratory disorders | Sepsis | Cancer | |
|---|---|---|---|---|---|---|
| Events, n | 311 | 200 | 191 | 303 | 170 | 232 |
| % contribution to total deaths | 18.7 | 12.1 | 11.5 | 18.3 | 10.2 | 14.0 |
| Characteristic | HR (95% CI) | HR (95% CI) | HR (95% CI) | HR (95% CI) | HR (95% CI) | HR (95% CI) |
| Duration of diabetes, years | 1.02 (1.00–1.03) | 1.04 (1.02–1.06) | 1.01 (0.99–1.03) | 0.99 (0.98–1.01) | 1.02 (1.00–1.04) | 0.98 (0.96–1.00) |
| Sex, female | 0.57 (0.44–0.73) | 0.69 (0.50–0.94) | 0.61 (0.44–0.84) | 0.75 (0.58–0.98) | 0.65 (0.47–0.92) | 0.60 (0.44–0.80) |
| Race | ||||||
| White | Ref | Ref | Ref | Ref | Ref | Ref |
| Black | 0.70 (0.54–0.91) | 1.57 (1.02–2.40) | 1.47 (0.98–2.19) | 0.70 (0.53–0.92) | 1.01 (0.68–1.52) | 0.87 (0.62–1.22) |
| Other race | 0.66 (0.33–1.31) | 1.14 (0.44-2.96) | 0.83 (0.29-2.35) | 1.04 (0.58-1.87) | 1.15 (0.48-2.75) | 1.59 (0.84-3.01) |
| BMI | 0.87 (0.77–0.98) | 0.72 (0.63–0.83) | 0.93 (0.80–1.08) | 0.78 (0.70–0.87) | 0.74 (0.64–0.85) | 0.81 (0.70–0.93) |
| BMI squared | 1.02 (0.99–1.06) | 1.06 (1.02–1.10) | 1.04 (1.00–1.07) | 1.08 (1.05–1.10) | 1.08 (1.05–1.11) | 1.02 (0.98–1.07) |
| Anti-hyperglycaemic medication | ||||||
| None | Ref | Ref | Ref | Ref | Ref | Ref |
| Insulin only | 2.24 (1.45–3.47) | 2.97 (1.80–4.90) | 2.24 (1.29–3.88) | 2.15 (1.41–3.27) | 4.03 (2.19–7.44) | 1.44 (0.88–2.34) |
| Insulin + oral agent | 2.22 (1.38–3.57) | 1.26 (0.67–2.37) | 2.31 (1.27–4.19) | 2.04 (1.27–3.25) | 2.57 (1.27–5.19) | 1.56 (0.89–2.73) |
| Oral agent only | 1.16 (0.77–1.76) | 0.67 (0.39–1.14) | 1.01 (0.59–1.71) | 1.09 (0.74–1.60) | 1.40 (0.76-2-.58) | 1.20 (0.79–1.83) |
| Ischaemic heart disease | 2.60 (1.99–3.40) | 1.62 (1.13–2.34) | 3.08 (2.20–4.31) | 1.66 (1.23–2.26) | 1.50 (0.99–2.28) | 1.16 (0.78–1.72) |
| Hypertension | 1.63 (1.12–2.38) | 1.89 (1.15–3.09) | 2.15 (1.25–3.71) | 1.33 (0.95–1.88) | 1.39 (0.88–2.19) | 1.35 (0.9-2-1.99) |
| High cholesterol | ||||||
| No high cholesterol | Ref | Ref | Ref | Ref | Ref | Ref |
| High cholesterol, not treated | 1.09 (0.77–1.55) | 1.13 (0.73–1.72) | 0.85 (0.54-1.33) | 1.02 (0.72-1.45) | 0.89 (0.56-1.43) | 0.73 (0.47-1.12) |
| High cholesterol, statin | 1.01 (0.76–1.34) | 1.05 (0.73–1.51) | 0.79 (0.55–1.13) | 0.88 (0.65–1.18) | 0.76 (0.51–1.13) | 0.70 (0.49–0.99) |
| High cholesterol, other cholesterol lowering medication | 0.92 (0.58–1.47) | 1.10 (0.64–1.88) | 0.45 (0.22–0.95) | 0.84 (0.50–1.38) | 0.69 (0.35–1.36) | 0.99 (0.59–1.67) |
| A history of smoking | ||||||
| Never | Ref | Ref | Ref | Ref | Ref | Ref |
| Current | 1.82 (1.33–2.49) | 1.38 (0.93–2.05) | 2.11 (1.40–3.18) | 3.42 (2.44–4.80) | 2.05 (1.34–3.14) | 2.57 (1.79–3.68) |
| Former | 1.32 (0.97–1.79) | 1.56 (1.09–2.25) | 1.70 (1.15–2.49) | 1.88 (1.34–2.67) | 1.63 (1.07–2.47) | 1.12 (0.76–1.66) |
HR, hazard ratio.
Unadjusted hazard ratios (95% CIs) for cause-specific mortality outcomes in Black people vs White people: ischaemic heart disease: 0.67 (0.52–0.87); renal failure: 1.91 (1.25–2.91); heart failure: 1.39 (0.94–2.01); respiratory disorders: 0.70 (0.54–0.92); sepsis: 1.13 (0.76–1.67). These unadjusted hazard ratios and 95 CIs are restricted to the population with full data, i.e. the population in the multivariable adjusted models.
Missing covariate data did not materially affect the unadjusted hazard ratios (95% CIs) for cause-specific mortality outcomes in Black vs White people, as can be seen in the following: ischaemic heart disease: 0.66 (0.52–0.84); renal failure: 1.80 (1.21–2.69); heart failure: 1.32 (0.91–1.91); respiratory disorders: 0.65 (0.51–0.83); sepsis: 1.12 (0.77–1.62).
The patterns seen in Table3 for cause-specific mortality risk factors generally, but not always, persisted for both Blacks and Whites when investigated race-specifically. Ischaemic heart disease and respiratory disorders were the leading contributors to overall mortality in both Blacks and Whites with diabetes, so event numbers allowed a larger number of potential risk factors to be examined in the race-specific multivariate models (Table4) than for the other causes of death. Duration of diabetes appeared to be a stronger risk factor for death from ischaemic heart disease and smoking appeared to be a stronger risk factor for death from respiratory disease in Whites, and prevalent heart disease and hypertension appeared to be stronger risk factors for death from ischaemic heart disease and/or renal failure in Blacks, but none of these differences attained statistical significance when multiple comparisons were taken into account (P values for multiplicative interaction all > 0.014).
Table 4.
Multivariable adjusted hazard ratios for ischaemic heart disease mortality and respiratory disorders mortality risk by race in those with Type 2 diabetes
| Ischaemic heart disease | Respiratory disorders | |||
|---|---|---|---|---|
| Black Americans | White Americans | Black Americans | White Americans | |
| Events, n | 206 | 96 | 197 | 92 |
| % contribution to total deaths | 17.5 | 22.9 | 16.7 | 21.9 |
| Characteristic | HR (95% CI) | HR (95% CI) | HR (95% CI) | HR (95% CI) |
| Duration of diabetes, years | 1.01 (0.99–1.03) | 1.04 (1.01–1.07) | 1.00 (0.98–1.03) | 0.97 (0.93–1.00) |
| Sex, female | 0.70 (0.51–0.96) | 0.38 (0.25–0.60) | 0.81 (0.58–1.12) | 0.71 (0.45–1.14) |
| BMI | 0.80 (0.69–0.93) | 1.03 (0.81–1.30) | 0.70 (0.61–0.80) | 0.98 (0.78–1.22) |
| BMI squared | 1.03 (0.98–1.07) | 1.01 (0.95–1.06) | 1.09 (1.07–1.12) | 1.04 (0.99–1.09) |
| Anti-hyperglycaemic medication | ||||
| None | Reference | Reference | Reference | Reference |
| Insulin only | 2.53 (1.46–4.38) | 1.98 (0.90–4.42) | 2.33 (1.33–4.07) | 1.73 (0.82–3.64) |
| Insulin + oral agent | 2.21 (1.18–4.13) | 2.39 (1.08–5.29) | 2.30 (1.22–4.36) | 1.89 (0.90–3.96) |
| Oral agent only | 1.21 (0.71–2.07) | 1.09 (0.54–2.22) | 1.42 (0.84–2.42) | 0.63 (0.34–1.17) |
| Ischaemic heart disease | 3.08 (2.22–4.28) | 1.69 (1.05–2.72) | 1.94 (1.31–2.87) | 1.28 (0.76–2.16) |
| Hypertension | 2.02 (1.20–3.38) | 1.09 (0.62–1.91) | 1.28 (0.83–1.97) | 1.58 (0.84–2.97) |
| High cholesterol | ||||
| No high cholesterol | Ref | Ref | Ref | Ref |
| High cholesterol, not treated | 1.08 (0.71–1.65) | 1.07 (0.54–2.12) | 1.02 (0.67–1.56) | 1.05 (0.54–2.04) |
| High cholesterol, statin | 0.95 (0.67–1.36) | 1.15 (0.68–1.94) | 0.72 (0.49–1.06) | 1.06 (0.62–1.82) |
| High cholesterol, other cholesterol lowering medication | 0.99 (0.55–1.76) | 0.94 (0.41–2.15) | 0.88 (0.47–1.65) | 0.71 (0.27–1.90) |
| A history of smoking | ||||
| Never | Ref | Ref | Ref | Ref |
| Current | 1.93 (1.31–2.85) | 1.95 (1.12–3.37) | 2.67 (1.79–3.99) | 6.56 (3.19–13.51) |
| Former | 1.51 (1.04–2.21) | 1.01 (0.58–1.75) | 1.62 (1.07–2.45) | 3.15 (1.52–6.52) |
HR, hazard ratio.
Finally, we conducted a post hoc analysis to investigate whether the lower all-cause mortality risk in Black Americans would remain after excluding those who died where ischaemic heart disease or respiratory disorders were the causes of death. These were the two leading causes of death and Black people were at a lower risk for each outcome. In the population in which ischaemic heart disease or respiratory disorders were not causes of death, the lower risk of mortality among Blacks remained (hazard ratio 0.82, 95% CI 0.71–0.95).
Discussion
We have recently reported lower all-cause mortality rates in Black Americans compared with White Americans with Type 2 diabetes in the SCCS population 3. As few cause-specific mortality data are available on Black people in the USA with diabetes, in the present report we have described the contribution of specific complications and comorbidities of diabetes to total mortality and have attempted to identify the reasons for the lower mortality rates among Blacks than among Whites. We have shown that the leading causes of death, as well as their risk factors, were largely similar in Blacks and Whites. We have also shown that mortality rates attributable to ischaemic heart disease and respiratory disorders were lower in Black people, while mortality rates attributable to renal failure and heart failure were higher. As ischaemic heart disease and respiratory disorders were the leading causes of death in both races, they contributed to a higher percentage of total deaths and thus to the lower all-cause mortality among Blacks.
Determining where specific causes of death differ among populations is the first step towards understanding racial disparities in all-cause mortality. While there is some previous evidence that the leading cause of death among individuals with diabetes may differ by race or nationality 7, the literature largely suggests that ischaemic heart disease is the primary cause of death 8–10 in both Black and White people with diabetes 10, a finding confirmed in the present study; however, we observed a lower relative risk of death from ischaemic heart disease for Blacks compared with Whites. The Multiple Risk Factor Intervention Trial also found a lower relative risk of death from ischaemic heart disease for Black men compared with White men with diabetes, which became significant after adjustment for income 10. One possible reason for this lower risk of ischaemic heart disease among Black people in the USA is that Black people are more likely than White people to have an insulin-sensitive form of Type 2 diabetes, which is characterized by higher HDL cholesterol and lower LDL cholesterol and triglyceride levels 10. In general, less atherosclerosis is observed among Blacks.
A higher rate of respiratory disorders as the underlying or contributing cause of death has been reported among individuals with diabetes 5,11. We, too, have recently observed higher mortality from respiratory failure in our population diagnosed with diabetes before the age of 30 years 12. In the present analyses of those diagnosed with diabetes at or after age 30 years, respiratory disorders was second only to ischaemic heart disease as the leading contributor to mortality. It has been suggested that the lung may also be a target organ of diabetes 13, and decrements of lung function in Type 2 diabetes have been observed independently of smoking and obesity 14. A meta-analysis of studies of pulmonary function in diabetes showed a modest reduction in pulmonary function in both Type 1 and Type 2 diabetes 15 and reduced pulmonary elastic recoil 16,17, lung volume and impaired diffusing capacity 16,18 has been observed in diabetes. We do not have similar pathophysiological measures on lung function or on whether its relationship with diabetes varies by race, but the mortality rate from lower respiratory disorders in Black people, which is consistent with that observed nationally 1,19, remained the same after adjustment for smoking and BMI. Smoking, however, appeared to have a greater impact on mortality from respiratory disorders in Whites than in Blacks (hazard ratios 3.1 vs 1.7), an observation that has been noted elsewhere 20, perhaps because of the heavier daily cigarette consumption among White than among Black smokers in the SCCS.
Our data do not support a higher all-cause cancer mortality risk in those with diabetes, an observation that has been reported elsewhere 21. The Cancer Prevention Study II reported that a higher total cancer mortality was associated with diabetes among 1 053 831 participants free of cancer at study baseline 21. The excess risk, although significant, was slight (Relative Risk = 1.09, 95% CI: 1.06–1.13 for men and Relative Risk = 1.11, 95% CI: 1.06–1.15 for women) 21 and similar to that observed in the present population. Diabetes has been associated with a higher risk of some site-specific cancers 21,22 and a protection from others 21,23, which may help explain the very low excess overall cancer mortality risk associated with diabetes.
For almost all of the mortality outcomes reported, women with diabetes had a ∽30–40% lower mortality risk. We have previously reported on the lower all-cause mortality risk in women with diabetes than in men in our population 3. The excess risk of cardiovascular disease mortality in men compared with women is reported to be eliminated or attenuated in diabetes 24, with inconsistent results reported for all-cause mortality 25,26. Our data do not support a loss of the protective effect of being female on all-cause or cardiovascular disease mortality in diabetes, as women in our population with diabetes had a substantially lower risk of all major causes of death than their male counterparts.
The strengths of the present study include its large sample size, to our knowledge the largest cohort of Black people with diabetes in the USA to date, and its inclusion of Black and White people from a similar socio-economic background. The community health centre recruitment also resulted in all cohort members having essentially equal opportunity for similar healthcare. The study also has some limitations. The SCCS was designed primarily to investigate cancer; however, the very large population and the large percentage of people with diabetes at study baseline (∽20%) 3 provided an important large-scale diabetes cohort for the investigation of racial disparities in diabetes outcomes. We do not have data on HbA1c levels for the full population. Our data on participant characteristics at entry into the cohort were based on self-reporting of a physician diagnosis of a disease or condition. Separate validation efforts based on review of medical records and/or HbA1c levels for samples of SCCS participants, however, confirmed > 97% of the self-reports 27. While it is possible that there could be some misclassification of diabetes type, we have used 30 years as our age threshold, a standard threshold for defining Type 2 diabetes in large-scale epidemiology studies. We did not have data on age at timing of insulin initiation or biochemical markers of Type 1 diabetes such as glutamic acid decarboxylase antibodies, so we cannot be sure that Type 1 diabetes cases were completely excluded. We also do not have data on microvascular disease or complete data on treatment of hypertension. Comorbidities, including a history of heart attack or coronary artery bypass surgery, were also self-reported. Nevertheless, our data are consistent with other reports showing a lower prevalence of coronary artery calcification, a subclinical marker of atherosclerosis, in Blacks than in Whites 28. Limitations of ascertaining causes of death from data collected from death certificates in individuals with diabetes have been reported 5,29. Ischaemic heart disease has been reported to be over-represented as a cause of death on death certificates compared with physician-confirmed causes of death 30, but unless this over-reporting of ischaemic heart disease on death certificates differentially affects White and Black people, this would not have affected our primary results. Furthermore, by using both the underlying and contributing causes listed on death certificates, we have attempted to minimize some of these limitations and more accurately ascertain contributors to total mortality in individuals with diabetes. Finally, although no significant effect modification by education or income was observed in the present study, our data are not generalizable to those of middle or upper socio-economic status, as the vast majority of our population was from very low-income households.
In conclusion, in this population with similarly low socio-economic status and similar access to healthcare, diabetes similarly affects mortality risk among Blacks and Whites regardless of the cause of death; however, among those with diabetes, Black people appear to be at a lower mortality risk compared with White people. This lower risk is contributed to by the lower mortality from ischaemic heart disease and respiratory disorders, the leading causes of death in both races. The findings are reminiscent of the ‘Hispanic mortality paradox’, which refers to the reported phenomenon of a lower mortality rate in US Hispanic people compared with US White people, despite the generally lower socio-economic status and poorer risk factor profile among Hispanic people 31. Our data suggest that efforts aimed at reducing both the prevalence of and disparities in comorbidities often common among patients with diabetes, including hypertension (higher in Black people) and lipid abnormalities (higher in White people), and smoking would lower cause-specific mortality rates in both races and reduce health disparities for both overall and cause-specific mortality.
Funding sources
The SCCS is supported by grant RO1 CA 092447 from the National Cancer Institute. B.N.C. was also partially supported by the National Institutes of Health General Medical Sciences grant U54GM104942. The funders had no involvement in the study design, data collection, data analysis, manuscript preparation, and/or publication decisions.
Competing interests
None declared.
Acknowledgments
The authors thank Ms Katelynn Weber for her help in creating the graphs for the manuscript. The authors also thank the participants of the SCCS for making this work possible.
This work was funded by the National Cancer Institute grant R01 CA092447 and by National Institute of General Medical Sciences grant U54GM104942.
Appendix 1
International Classification of Diseases (ICD)-10 codes used to determine cause-specific mortality
| Cause of Death | ICD-10 code |
|---|---|
| Ischaemic heart disease | I20.0, I20.8, I20.9, I21.0- I25.9, I51.6 |
| Heart failure | I11.0, I13.0-I13.2, I42.0-I42.9, I50, I50.0, I50.1, I50.9, I51.7 |
| Renal failure | I12.0, I12.9, I13.0, I13.1, I13.2, N18, N18.0, N18.8, N189, N19 |
| Respiratory disorders | I26.0, I27.0, I27.1, I27.2, I27.8, I27.9, J00-J99.9 |
| Sepsis | A40, A40.0- A40.3, A40.8, A40.9, A41, A41.0- A41.5, A41.8, A41.9, A49, A49.0, A49.1, A49.8, A49.9, I26.0, I26.9, I33.0, I22.9, I38, I40, I40.0, I40.1, I40.8, I40.9, O85, O85.0, O08.3, R02, T80.2, T81.1, T81.4, T82.6, T82.7, T83.5, T83.6, T84.5, T84.6, T84.7, T85.7, N39.0 |
| Stroke/transient ischaemic attack | I60.9-I62.0, I62.9, I63.0, I63.1, I63.2, I63.4, I63.5, I63.8, I63.9, I64, I67.8, I67.9, I69.4, I69.8 |
| Cancer | C00-C97 |
References
- Kochanek KD, Xu J, Murphy SL, Minino AM, Kung HS. Statistics DoV. Deaths: Final Data for 2009. Hyattsville, MD: National Center for Health Statistics; 2012. Contract No. 3. [PubMed] [Google Scholar]
- Signorello LB, Schlundt DG, Cohen SS, Steinwandel MD, Buchowski MS, McLaughlin JK, et al. Comparing diabetes prevalence between African Americans and Whites of similar socioeconomic status. Am J Public Health. 2007;97:2260–2270. doi: 10.2105/AJPH.2006.094482. [DOI] [PMC free article] [PubMed] [Google Scholar]
- Conway BN, May ME, Blot WJ. Mortality among Low-Income African Americans and Whites with Diabetes. Diabetes Care. 2012;35:2293–2299. doi: 10.2337/dc11-2495. [DOI] [PMC free article] [PubMed] [Google Scholar]
- Signorello LB, Hargreaves MK, Blot WJ. The Southern Community Cohort Study: Investigating health disparities. J Health Care Poor Underserved. 2010;21:26–37. doi: 10.1353/hpu.0.0245. [DOI] [PMC free article] [PubMed] [Google Scholar]
- Roper NA, Bilous RW, Kelly WF, Unwn NC, Connolly VM. Cause-specific mortality in a population with diabetes: South Tees Diabetes Mortality Study. Diabetes Care. 2002;25:43–48. doi: 10.2337/diacare.25.1.43. [DOI] [PubMed] [Google Scholar]
- Dawson SI, Willis J, Florkowski CM, Scott RS. Cause-specific mortality in insulin-treated diabetic patients: A 20-year follow-up. Diabetes Res Clin Pract. 2008;80:16–23. doi: 10.1016/j.diabres.2007.10.034. [DOI] [PubMed] [Google Scholar]
- Zargar AH, Wani AI, Masoodi SR, Bashir MI, Laway BA, Gupta VK, et al. Causes of mortality in diabetes mellitus: data from a tertiary teaching hospital in India. Postgrad Med J. 2009;85:227–232. doi: 10.1136/pgmj.2008.067975. [DOI] [PubMed] [Google Scholar]
- Preis SR, Hwang S-J, Coady S, Pencina MJ, D'Agostino RB, Savage PJ, et al. Trends in all-cause and cardiovascular disease mortality among women and men with and without diabetes mellitus in the Framingham Heart Study, 1950-2005. Circulation. 2009;119:1728–1735. doi: 10.1161/CIRCULATIONAHA.108.829176. [DOI] [PMC free article] [PubMed] [Google Scholar]
- Joron GE, Laryea E, Jaeger D, MacDonald L. Causes of death in 1144 patients with diabetes mellitus: an autopsy study. CMAJ. 1986;134:759–764. [PMC free article] [PubMed] [Google Scholar]
- Vaccaro O, Stamler J, Neaton JD. Sixteen-year coronary mortality in black and white men with diabetes screened for the Multiple Risk Factor Intervention Trial (MRFIT) Int J Epidemiol. 1998;27:636–641. doi: 10.1093/ije/27.4.636. [DOI] [PubMed] [Google Scholar]
- Tierney EF, Cadwell BL, Thompson TJ, Boyle JP, Paxon SL, Moum K, et al. Reductions in excess mortality rates among people with diabetes by selected cause of death. J Diabetes Complications. 2009;23:77–82. doi: 10.1016/j.jdiacomp.2007.12.002. [DOI] [PubMed] [Google Scholar]
- Conway B, Miller R, Costacou T, Fried L, Kelsey S, Evans W, et al. Temporal patterns in overweight and obesity in Type 1 diabetes. Diabet Med. 2010;27:398–404. doi: 10.1111/j.1464-5491.2010.02956.x. [DOI] [PMC free article] [PubMed] [Google Scholar]
- Sandler M. Is the lung a ‘target organ’ in diabetes mellitus? Arch Intern Med. 1990;150:1385–1388. [PubMed] [Google Scholar]
- Klein OL, Krishnan JA, Glick S, Smith LJ. Systematic review of the association between lung function and Type 2 diabetes mellitus. Diabet Med. 2010;27:977–987. doi: 10.1111/j.1464-5491.2010.03073.x. [DOI] [PubMed] [Google Scholar]
- van den Borst B, Gosker HR, Zeegers MP, Schols AMWJ. Pulmonary function in diabetes: a metaanalysis. Chest. 2010;138:393–406. doi: 10.1378/chest.09-2622. [DOI] [PubMed] [Google Scholar]
- Schuyler MR, Niewoehner DE, Inkley SR, Kohn R. Abnormal lung elasticity in juvenile diabetes mellitus. Am Rev Respir Dis. 1976;113:37–41. doi: 10.1164/arrd.1976.113.1.37. [DOI] [PubMed] [Google Scholar]
- Sandler M, Bunn AE, RI S. Pulmonary function in young insulin-dependent diabetic subjects. Chest. 1986;90:670–675. doi: 10.1378/chest.90.5.670. [DOI] [PubMed] [Google Scholar]
- Dieterle CD, Schmauss S, Arbogast H, Domsch C, Huber RM, Landgraf R. Pulmonary function in patients with type 1 diabetes before and after simultaneous pancreas and kidney transplantation. Transplantation. 2007;83:566–569. doi: 10.1097/01.tp.0000253882.95177.61. [DOI] [PubMed] [Google Scholar]
- Keppel KG, Pearcy JN, Heron MP. Is there progress toward eliminating racial/ethnic disparities in the leading causes of death? Public Health Rep. 2010;125:689–697. doi: 10.1177/003335491012500511. [DOI] [PMC free article] [PubMed] [Google Scholar]
- Thomas KL, Honeycutt E, Shaw LK, Peterson ED. Racial differences in long-term survival among patients with coronary artery disease. Am Heart J. 2010;160:744–751. doi: 10.1016/j.ahj.2010.06.014. [DOI] [PubMed] [Google Scholar]
- Campbell PT, Newton CC, Patel AV, Jacobs EJ, Gapstur SM. Diabetes and cause-specific mortality in a prospective cohort of one million U.S. adults. Diabetes Care. 2012;35:1835–1844. doi: 10.2337/dc12-0002. [DOI] [PMC free article] [PubMed] [Google Scholar]
- Lam EK, Batty GD, Huxley RR, Martiniuk AL, Barzi F, Lam TH, et al. Associations of diabtes mellitus with site-specific cancer mortality in the Asia-Pacific region. Ann Oncol. 2011;22:730–738. doi: 10.1093/annonc/mdq405. [DOI] [PMC free article] [PubMed] [Google Scholar]
- Rodriguez C, Patel AV, Mondul AM, Jacobs EJ, Thun MJ, Calle EE. Diabetes and risk of prostate cancer in a prospective cohort of US men. Am J Epidemiol. 2005;161:147–152. doi: 10.1093/aje/kwh334. [DOI] [PubMed] [Google Scholar]
- Huxley R, Barzi F, Woodward M. Excess risk of fatal coronary heart disease associated with diabetes in men and women: meta-analysis of 37 prospective cohort studies. BMJ. 2006;332:73–76. doi: 10.1136/bmj.38678.389583.7C. [DOI] [PMC free article] [PubMed] [Google Scholar]
- Gregg EW, Gu Q, Cheng YJ, Narayan KM, Cowie CC. Mortality trends in men and women with diabetes, 1971 to 2000. Ann Intern Med. 2007;147:149–155. doi: 10.7326/0003-4819-147-3-200708070-00167. [DOI] [PubMed] [Google Scholar]
- Hu G, Jousilahti P, Qiao Q, Katoh S, Tuomilehto J. Sex differences in cardiovascular and total mortality among diabetic and non-diabetic individuals with or without history of myocardial infarction. Diabetologia. 2005;48:856–861. doi: 10.1007/s00125-005-1730-6. [DOI] [PubMed] [Google Scholar]
- Huizinga M, Elasy T, Villegas R, Signorello L, Blot W, Cavanaugh K. Validation of diabetes self-report and characteristics of undiagnosed diabetes in the Southern Community Cohort Study. Diabetes. 2009;58(S1):A279. [Google Scholar]
- Orakzai SH, Orakzai RH, Nasir K, Santos RD, Edmundowicz D, Budoff MJ, et al. Subclinical coronary atherosclerosis: racial profiling is necessary! Am Heart J. 2006;152:819–827. doi: 10.1016/j.ahj.2006.08.008. [DOI] [PubMed] [Google Scholar]
- Muhlhauser I, Sawicki PT, Blank M, Overmann H, Richter B, Berger M. Reliability of causes of death in persons with Type 1 diabetes. Diabetologia. 2002;45:1490–1497. doi: 10.1007/s00125-002-0957-8. [DOI] [PubMed] [Google Scholar]
- Lloyd-Jones DM, Martin DO, Larson MG, Levy D. Accuracy of Death Certificates for Coding Coronary Heart Disease as the Cause of Death. Ann Intern Med. 1998;129:1020–1026. doi: 10.7326/0003-4819-129-12-199812150-00005. [DOI] [PubMed] [Google Scholar]
- Ruiz JM, Steffen P, Smith TB. Hispanic mortality paradox: a systematic review and meta-analysis of the longitudinal literature. Am J Public Health. 2013;103:e52–60. doi: 10.2105/AJPH.2012.301103. [DOI] [PMC free article] [PubMed] [Google Scholar]