Summary
In this article we presented intracranial pathological substances and lesions with low signal intensity on T2-weighted images. Eight groups of substances were discussed i.e. 1. Gadolinium-based contrast materials, 2. hemoglobin degradation products 3. melanin, 4. mucous- or protein-containing lesions, 5. highly cellular lesions, 6. lesions containing mineral substances such as: calcium, copper and iron, 7. turbulent and rapid blood or CSF flow 8. air-containing spaces. Appropriate interpretation of signal intensity as well as analysis of lesion location and clinical symptoms enable a correct choice of a further diagnostic algorithm or, in many cases, final diagnosis based exclusively on an MRI examination.
MeSH Keywords: Magnetic Resonance Imaging; Diagnosis; Differential, Brain — radiography
Background
Magnetic resonance imaging (MRI) is a well-established technique for examining intracranial lesions. T2-weighted images are basic MRI sequences determined by two essential parameters of the spin echo: long time of repetition (TR), i.e. above 1500 ms, and relatively long time to echo (TE), i.e. above 90 ms [1]. Substances that have intrinsically longer T2 relaxation time mostly due to a large portion of free water appear as hyperintense on T2-weighted images (thus sometimes called water images). On the other hand, structures with short T2 relaxation time appear as hypointense on T2-weighted images. Most intracranial lesions produce hyperintense signal due to high water content. The T2-hypointense lesions are much less common [1].
In this article we presented intracranial pathological substances and lesions with low signal intensity on T2-weighted images. Eight groups of substances were discussed, i.e. 1. Gadolinium-based contrast materials, 2. hemoglobin breakdown products 3. melanin, 4. mucous- or protein-containing lesions, 5. highly cellular lesions, 6. lesions containing mineral substances such as: calcium, copper and manganese, 7. turbulent and rapid blood and CSF flow, and 8. air-containing spaces.
The T2-hypointense effect of certain lesions and substances can be enhanced in T2* and Susceptibility Weighted Imaging (SWI). The T2* relaxation refers to decay of transverse magnetization caused by a combination of spin-spin relaxation and magnetic field inhomogeneity and is seen only with gradient-echo (GRE) imaging. SWI uses a specific algorithm based on GRE T2*-weighted magnitude and phase data to create images sensitive to variations in tissue magnetic susceptibility [2]. The susceptibility effect is a phenomenon based on a fast decay of the local MR signal due to macroscopical inhomogenities in the magnetic field surrounding certain lesions and substances [3]. Signal hypointensities on T2* and SW images are typically larger than the physical size of the underlying hemosiderin deposits which is called a “blooming effect”. Both T2* and SW images are used to depict hemorrhage, calcifications, and iron depositions in various tissues and lesions. SWI can be additionally used to visualize venous vasculature [4].
Contrast Media
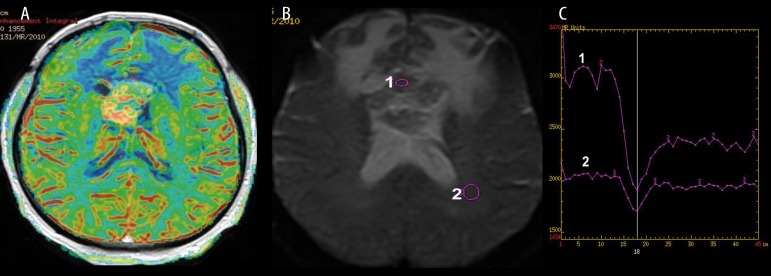
Gadolinium-based contrast materials shorten T1 and T2 relaxation times due to paramagnetic features, and thus contrast-enhanced lesions appear as hyperintense on T1-weighted and hypointense on T2-weighted images. In standard MR imaging the T1-weighted sequence is used in post-gadolinium studies. An example of the use of the post-contrast T2 effect is one of MR perfusion techniques called Dynamic Susceptibility Contrast Enhanced Perfusion (DSC). DSC measures the MRI signal based on T2*-weighted sequence during the first pass of a paramagnetic contrast agent bolus which produces characteristic signal drop on perfusion curves (Figure 1) [5]. DSC brings information on the cerebral microvasculature and enables to quantify perfusion parameters such as Cerebral Blood Flow (CBF) and Cerebral Blood Volume (CBV). DSC perfusion is mostly used in imaging of acute ischemia or brain tumors [6].
Figure 1.
Midline glioblastoma multiforme, DSC perfusion weighted imaging. (A) Cerebral Blood Volume Map showing malignant hyperperfusion within the tumor core, (B) source T2 image showing hypointense tumor after contrast injection, (C) perfusion signal-intensity curve showing typical T2 signal drop during contrast passage through the tumor core (1) and the white matter (2).
Hemoglobin Degradation Products
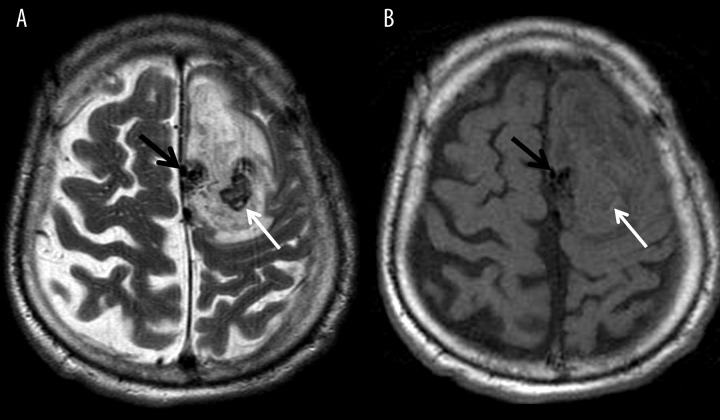
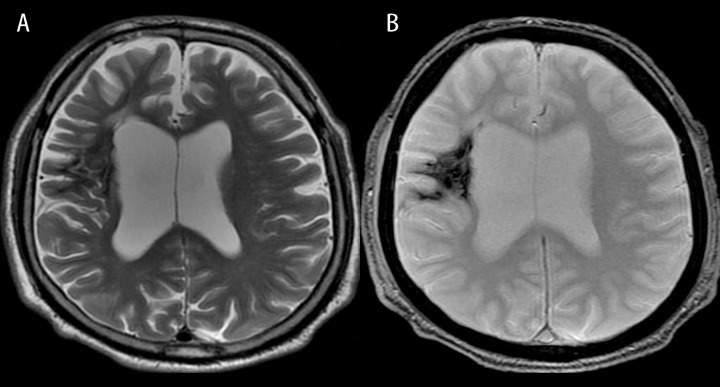
Hemoglobin is a paramagnetic substance with unpaired electrons and strong nuclear magnetism that affects a large number of adjacent protons. Hemoglobin evolves in time from oxyhemoglobin, then deoxyhemoglobin to methemoglobin. Finally, it is broken down into ferritin and hemosiderin (Table 1). T2-hypointensity is characteristic for intracellular deoxyhemoglobin (acute phase of bleeding) (Figure 2), intracellular methemoglobin (early subacute phase of bleeding) (Figure 3) and hemosiderin (late phase of bleeding) (Figures 4 and 5). Intracellular deoxyhemoglobin and hemosiderin produce also hypointensity on T1-weighted images while methemoglobin appears as hyperintense on T1-weighted images (Table 1) [7].
Table 1.
Hemoglobin breakdown products according to the phase of bleeding as well as their T1 and T2 signal.
| Hemoglobin breakdown products | Phase of bleeding | T1 signal intensity | T2 signal intensity |
|---|---|---|---|
| Oxyhemoglobin | Hyperacute | Low | High |
| Deoxyhemoglobin | Acute | Low/iso | Low |
| Intracellular methemoglobin | Early subacute | High | Low |
| Extracellular methemoglobin | Late subacute | High | High |
| Hemosiderin | Chronic | Low | Low |
Figure 2.
Intracerebral active bleeding from an arteriovenous malformation located parasagitally (black arrows) within the left hemisphere; (A) T2-weighted and (B) T1-weighted images. Central area of low signal on T2-weighted image (A) is consistent with acute bleeding and deoxyhemoglobin (white arrows) which is surrounded by a large hyperacute hematoma with T2 and T1 signal characteristic of oxyhemoglobin.
Figure 3.

Early subacute hematoma within the right cerebellar hemisphere 72 hours after the onset of bleeding. (A) T1-weighted, (B) T2-weighted image, (C) unenhanced CT image. Low signal on T2-weighted image and high signal on T1-weighted image indicate intracellular methemoglobin.
Figure 4.
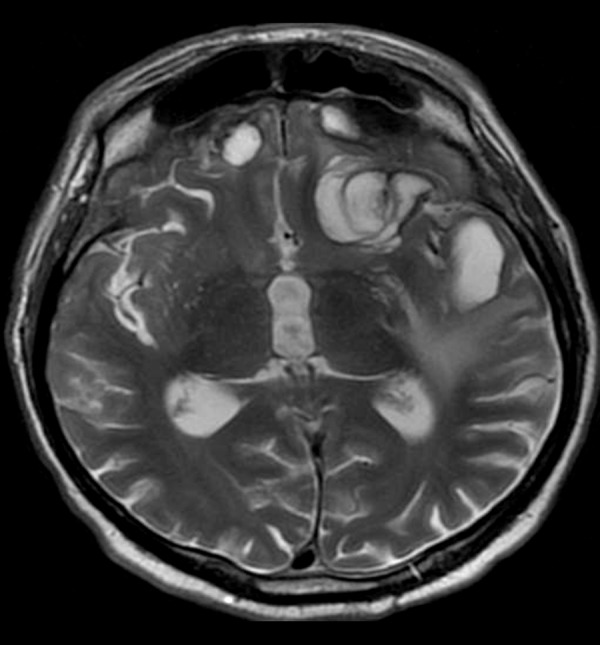
Chronic intracerebral hematomas in both frontal and left temporal lobes. T2-weighted image shows hyperintense hematomas with hypointense margins indicating hemosiderin.
Figure 5.
Chronic hemorrhagic infarction within the right hemisphere. T2-weighted image (A) shows a diffuse hypointense area indicating hemosiderin which is better visualized on a susceptibility-weighted image (B).
The presence of hemosiderin in the brain tissue in the form of hypointensity on T2-weighted images can indicate persistent bleeding characteristic for chronic hematomas or a symptom of brain tumors or vascular malformations. Extracerebral hypointense foci of hemosiderin may also be seen in the form of superficial hemosiderosis due to chronic/repeated subarachnoid hemorrhages.
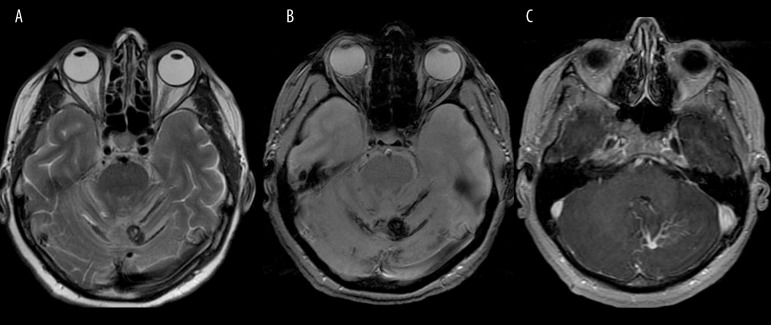
Cavernous vascular malformations (cavernous angiomas) produce a very typical T2-appearance called “salt and pepper “ or “popcorn ball” (Figure 6). They are hamartous dysplasias characterized by abnormally dilated vascular channels lined by a single layer of endothelium surrounded by hemosiderin deposits and gliosis. Intracranial cavernomas are commonly located in the supratentorial region, brain stem, basal ganglia, and cerebellar hemispheres. T2-weighted images show cavernomas as lesions with low-intensity margins containing hemosiderin and high-intensity central areas indicating gliosis or acute bleeding [8]. Cavernomas are found as single or multiple lesions. They can appear after radiotherapy and are reported in up to 33% of patients with developmental venous anomalies (DVA) as coexisting lesions. In such cases cavernomas are responsible for incidences of bleeding, not DVAs [9] (Figure 7).
Figure 6.
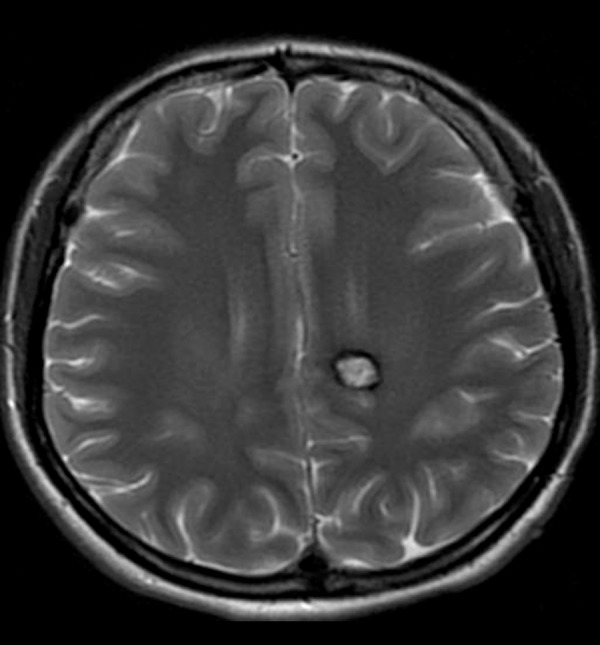
Cavernoma in the left parasagittal location. T2-weighted image shows typical salt and pepper appearance with central high signal and peripheral hypointense rim.
Figure 7.
Cavernoma and developmental venous anomaly within the left cerebellar hemisphere. T2-weighted image (A) shows hypointense oval cavernoma and bands of superficial hemosiderosis due to chronic bleeding which are better depicted on SWI (B). Contrast-enhanced T1-weighted image (C) reveals coexisting developmental venous anomaly.
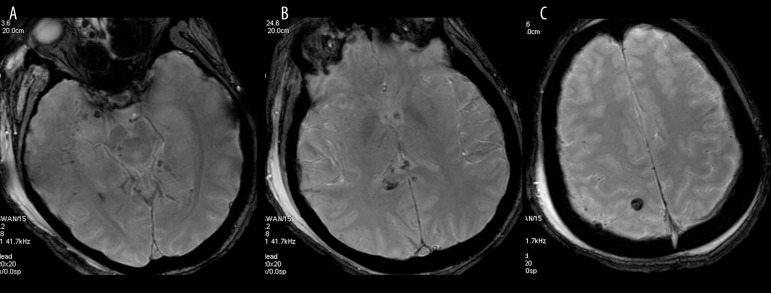
T2* and SW images are helpful in diagnosing acute and chronic bleeding. Their susceptibility to hemosiderin is especially useful in the diagnostics of microbleeds in the course of several pathologies including diffuse axonal injury or amyloid angiopathy [2]. Microbleeds observed on T2* and SWI, may be invisible in other sequences (Figure 8).
Figure 8.
Diffuse axonal injury. Axial susceptibility weighted images show multiple small hypointense foci of hemorrhage within the right temporal lobe and midbrain (A), splenium of the corpus callosum (B) and right parietal lobe (C), which are usually hardly visible on other MR sequences.
Melanin
Melanin shows paramagnetic properties and presents as hypointense on T2- and hyperintense on T1-weighted images [1, 6]. Intracranial metastases occur in nearly 40% of patients with malignant melanoma and can be found in any location (Figure 9). Melanomas are highly vascularized metastases that tend to bleed. Intratumoral bleeding may have a very similar appearance to melanin but in contrary to melanin it tends to evolve in time and change signal. It has to be remembered that melanoma can give amelanotic cerebral metastases which strongly resemble other metastatic lesion (hypointense on T1-weighted and hyperintense on T2-weighted imaging) [10]. Primary diffuse meningeal melanomatosis (an aggressive form of primary intracranial melanoma involving mainly leptomeninges) or neurocutaneous melanosis (congenital condition characterized by multiple giant or hairy pigmented nevi and melanin-containing leptomeningeal lesions without evidence of intracranial melanoma) are rare conditions that lead to intracranial accumulation of melanin [1].
Figure 9.
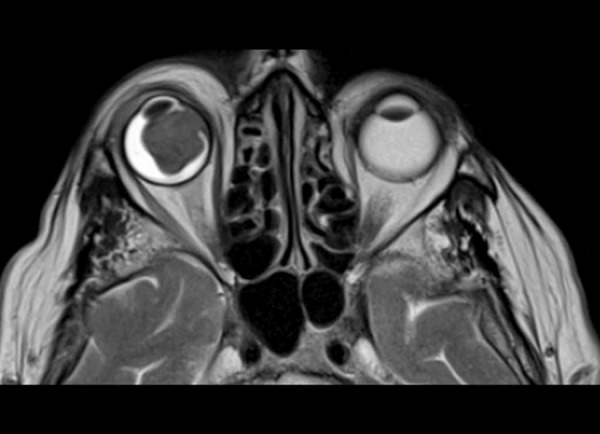
Metastatic melanoma to the right eyeball. Axial T2-weighted image shows low signal characteristic of melanin.
Mucous- or Protein-Containing Lesions
Due to their mucoid and/or protein content certain cysts such as colloid cyst or Rathke cleft cyst may also appear as hypointense structures on T2-weighted images.
Colloid cysts are uncommon benign intracranial lesions typically located in the anterosuperior aspect of the third ventricle between the columns of the fornix, near the foramen of Monro which may be the cause of obstructive hydrocephalus in some cases (Figure 10).
Figure 10.
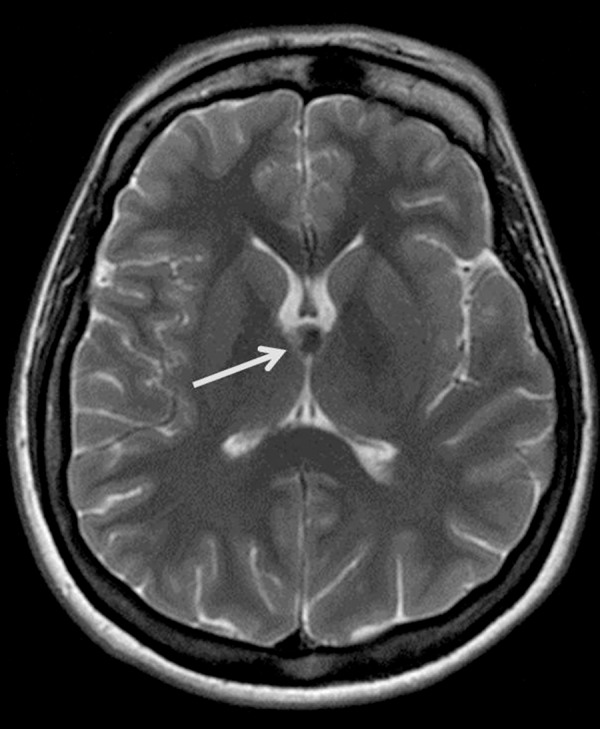
Colloid cyst. T2-weighted image shows a hypointense ovoid lesion in a typical location within the third ventricle close to the foramina of Monro (arrow).
Most of these cysts due to the high viscosity of colloid material and protein concentration show low signal on T2-weighted and high signal on T1-weighted images [6,11].
Rathke cleft cyst (RCC) is a benign remnant of the Rathke cleft. It is usually located intrasellarly between the anterior and posterior lobe of the pituitary gland (50%) though suprasellar location is also seen. Signal intensities are variable and depend directly on the biochemical content with most of the reported RCCs demonstrating T2 hyperintensity. However, RCCs containing mucoid material rich in proteins present as homogeneously T2 hypointense and T1 hyperintense lesions and this combination of T1 and T2 signal changes is considered a characteristic feature [12,13] (Figure 11).
Figure 11.
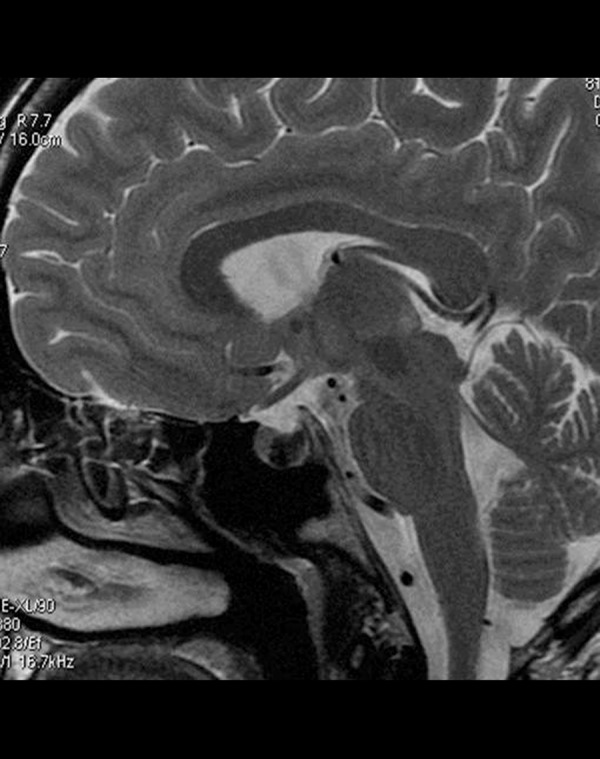
Rathke’s cleft cyst. Sagittal T2-weighted image shows low signal within the cyst which is typically located between the anterior and posterior pituitary lobes.
Highly Cellular Lesions
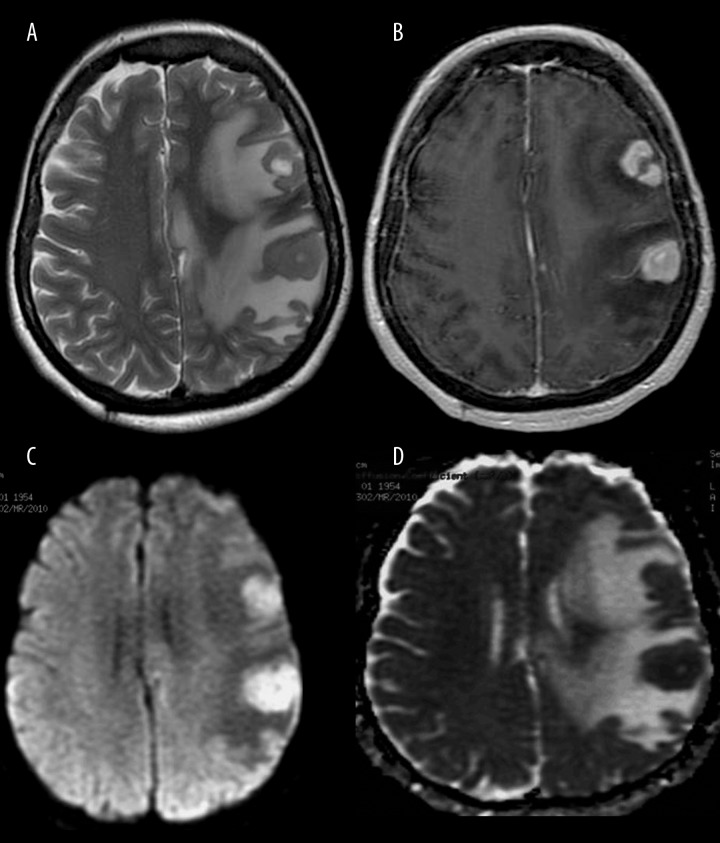
Due to their high cellularity, malignant tumors such as medulloblastomas and lymphomas or high-grade gliomas may appear as T2 hypointense lesions. Medulloblastomas and lymphomas are also known as tumors with a very high nuclear to cytoplasmatic ratio [14]. The cellular composition of these tumors causes decreased extracellular fluid concentration and small intratumoral edema which results in low signal on T2-weighted images [15]. The tumoral hypercellularity is also reflected in diffusion restriction in diffusion weighted imaging (DWI) characterized by increased signal on DW images and low signal on ADC maps [16] (Figure 12). Lymphomas and medulloblastomas show rather homogenous T2-hypointensity and diffusion restriction within the tumor core while in case of high-grade gliomas these features are typical for the most malignant parts of the tumor [16].
Figure 12.
Primary central nervous system lymphoma. MR images show two homogeneously hypointense tumors on T2-weighted image (A) with strong contrast enhancement on post-contrast T1-weighted image (B). DWI reveals almost homogenous diffusion restriction with high signal on DW image (C) and low signal on the ADC map (D).
Mineral Substances
Mineral substances such as iron, copper or calcium are paramagnetic materials that cause characteristic low signal changes on T2-weighted images [1,17].
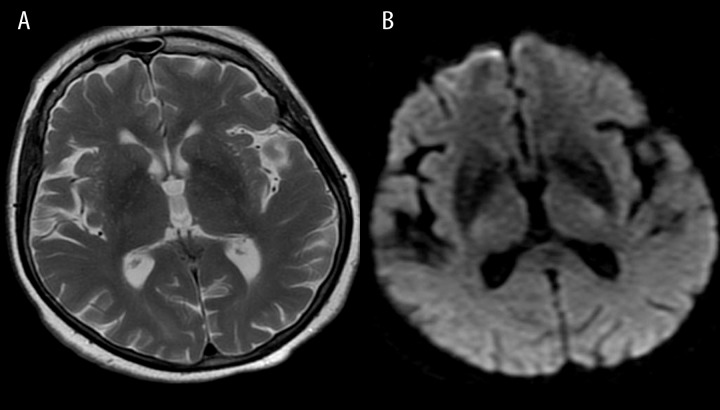
During aging physiological lowering of T2 signal of the globus pallidus can be noted due to the accumulation of iron (Figure 13). High concentrations of iron can be found also in the red nucleus, substantia nigra and putamen but in these regions physiological lowering of T2 signal is not so strongly expressed. Iron has also a weaker effect on T1 relaxation but the resulting reduction in T1 times may produce hyperintensity on T1-weighted images [6,18].
Figure 13.
Aging brain. T2-weighted image (A) shows low signal of both globi pallidi due to iron accumulation in a 75-year-old female patient. Iron overload may be better visualized on T2* images (B).
Pathological accumulation of iron in different tissues (hemochromatosis) is observed in many diseases. Iron overload syndromes are broadly divided into two groups: primary inherited iron overload mostly caused by mutations in hepcidin genes and secondary iron overload syndromes connected with iron-loading anemias, anaplastic anemia, thalassemic syndromes, etc. [19]. Basal ganglia, thalamus, midbrain and pituitary gland should be evaluated as they are the main locations of brain iron accumulation with low signal on T2-weighted images.
Pantothenate kinase-associated neurodegeneration is a rare pathology connected with neuroferritinopathy, aceruloplasminemia and infantile neuroaxonal dystrophy deposition, that mostly appears in globus pallidus in the shape of a central area of high signal and surrounding rim of low signal called “eye of the tiger” sign [20,21].
Similar image to the one of iron overload can be caused by abnormal cooper accumulation which is a hallmark of Wilson’s disease. In Wilson’s disease cooper overload is found in various tissues such as liver, heart, cornea and brain. MRI in Wilson`s disease shows hyper-, hypo- or mixed intensity in the putamen, globus pallidus, caudate nucleus and thalamus. Basal ganglia may appear as hypointense in T2 sequences [22,23].
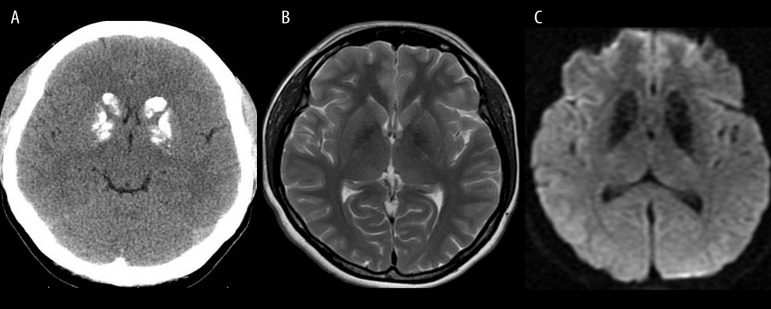
Calcium-containing structures (cortical bone, calcifications) are typically hypointense on both T1-weighted and T2-weighted images. Calcium has non-mobile protons bound to macromolecules which results in signal void most apparent on T2-weighted MR images. The most common non-tumorous location of calcium deposits and calcifications are basal ganglia, thalamus and cerebellum. Fine calcifications within the basal ganglia are mostly incidental findings without clinical significance. The remarkable calcifications of the basal ganglia and cerebellum (dentate nucleus) have been traditionally called Fahr’s disease (Figure 14). This idiopathic disorder can appear at any stage of life causing dementia and the loss of routine motor skills [6,24].
Figure 14.
Fahr’s disease. Unenhanced CT image (A) shows typical bilateral calcifications in the region of basal ganglia. T2-weighted image (B) shows hypointense both globi pallidi, while T2* image (C) reveals larger areas of hypointensity due to a susceptibility artifact and a “blooming effect”.
Neoplasms such as meningiomas and gliomas are often associated with calcifications and thus provide appearance of hypointense foci on T2-weighted images (Figure 15).
Figure 15.
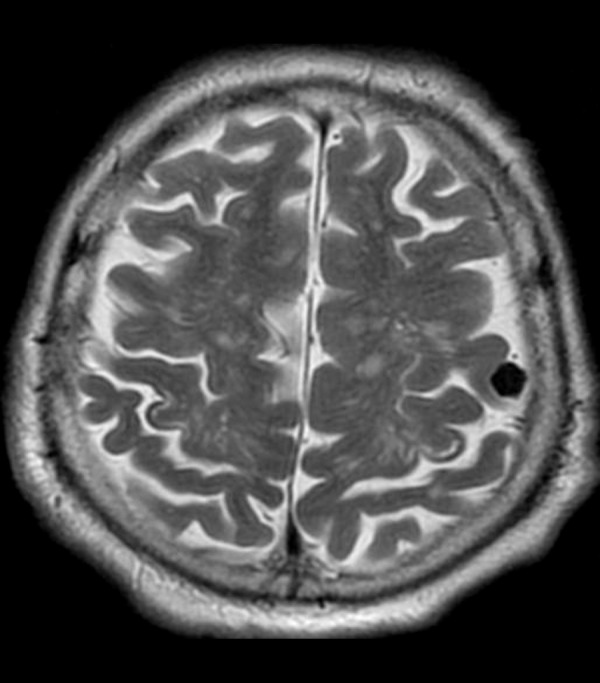
Calcified meningioma in the left frontal location with a very low signal on T2-weighted image.
Turbulent and Rapid Flow
Liquids with turbulent flow produce rapid loss of phase coherence and absence of signal reflected as strong hypointense T2 signal. This effect is called a flow void phenomenon and occurs either in physiological vessels containing fast-flowing blood or within structures containing cerebrospinal fluid (CSF) in normal subjects. The flow void phenomenon enables to visualize normal vessels on T2-weighted images as well as their pathologies such as aneurysms or other less common vascular malformations, which are well seen even before the contrast injection (Figure 16) [25]. CSF with a local very rapid and turbulent flow may be seen as a dark jet of fluid. This phenomenon is usually observed within the aqueduct and the fourth ventricle in the high-pressure or normal-pressure hydrocephalus (Figure 17) or due to aqueductal stenosis, but it can also be noticed across the ventriculostomy or fistulas [26,27].
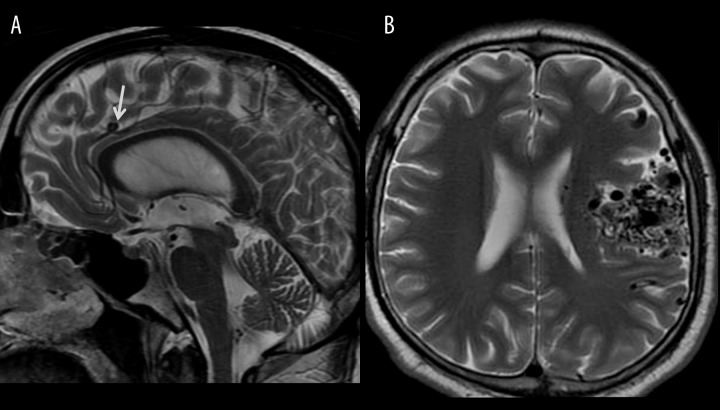
Figure 16.
Vascular malformations. Sagittal T2-weighted image (A) shows small pericallosal aneurysm (arrow). Axial T2-image (B) shows multiple flow voids within a large arteriovenous malformation in the left hemisphere.
Figure 17.
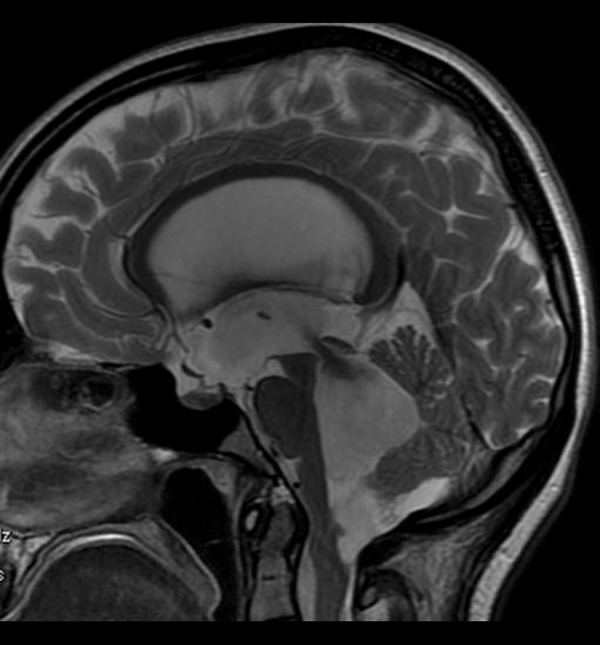
High-pressure hydrocephalus due to a tumor located at the cranio-cervical junction. Sagittal T2-weighted image shows enlarged ventricles and a hypointense jet through an aqueduct indicating very fast flow of the CSF.
Air-Containing Spaces
Spaces filled with air demonstrate low signal in T1 and T2 sequences caused by lack of excited protons and thus lack of MR signal. Physiologically, air can be seen within the paranasal sinuses. The main causes of pathological accumulation of air in the intracranial space are operations on ventricles (Figure 18), penetrating traumatic injuries or bacterial inflammations of CNS [28].
Figure 18.
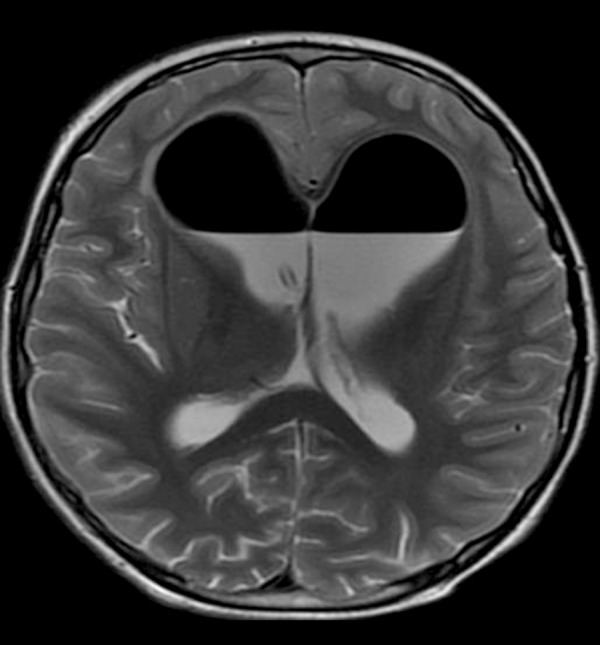
T2-weighted image shows a large amount of hypointense air within the lateral ventricles after a neurosurgical procedure.
Conclusions
Hypointense brain lesions on T2-weighted images are caused by shortening of the T2 transverse relaxation time. This shortening is caused mainly by paramagnetic substances (contrast media, blood, mineral substances, melanin), lack of excited protons (air-containing spaces, turbulent and rapid flow), high viscosity of colloid material and protein concentration (mucous- or protein-containing lesions), or decreased extracellular fluid concentration (highly cellular lesions). Knowledge of location and morphology of pathological changes that cause characteristic T2-hypointensity allows for narrowing the differential diagnosis and in many cases establishing the final correct diagnosis based solely on an MRI examination.
References
- 1.Warakaulle DR, Anslow P. Differential Diagnosis of Intracranial Lesions with High Signal on T1 or Low Signal on T2-weighted MRI. Clin Radiol. 2003;58:922–33. doi: 10.1016/s0009-9260(03)00268-x. [DOI] [PubMed] [Google Scholar]
- 2.Werring DJ. Cerebral microbleeds: clinical and pathophysiological significance. J Neuroimaging. 2007;17:193–203. doi: 10.1111/j.1552-6569.2006.00070.x. [DOI] [PubMed] [Google Scholar]
- 3.Gaviani P, Mullins ME, Braga TA, et al. Improved Detection of Metastatic Melanoma by T2*-Weighted Imaging. Am J Neuroradiol. 2006;27:605–8. [PMC free article] [PubMed] [Google Scholar]
- 4.Wieczorek-Pastusiak J, Kociński M, Raźniewski M, et al. An attempt toward objective assessment of brain tumor vascularization using susceptibility weighted imaging and dedicated computer program – a preliminary study. Pol J Radiol. 2013;78(1):50–56. doi: 10.12659/PJR.883767. [DOI] [PMC free article] [PubMed] [Google Scholar]
- 5.Rosen B, Belliveau J, Vevea J, et al. Perfusion imaging with NMR contrast agents. Magn Reson Med. 1990;14:249–65. doi: 10.1002/mrm.1910140211. [DOI] [PubMed] [Google Scholar]
- 6.Zimny A, Sąsiadek M. Contribution of perfusion-weighted magnetic resonance imaging in the differentiation of meningiomas and other extra-axial tumors: case reports and literature review. J Neurooncol. 2011;103(3):777–83. doi: 10.1007/s11060-010-0445-9. [DOI] [PMC free article] [PubMed] [Google Scholar]
- 7.Zimny A, Zińska L, Bladowska J, et al. Intracranial lesions with high signal on T1 MR images – review of pathologies. Pol J Radiol. 2013;78(4):36–46. doi: 10.12659/PJR.889663. [DOI] [PMC free article] [PubMed] [Google Scholar]
- 8.Rapacki TF, Brantley MJ, Furlow TW., Jr Heterogeneity of cerebral cavernous hemangiomas diagnosed by MR imaging. J Comput Assist Tomogr. 1990;14(1):18–25. doi: 10.1097/00004728-199001000-00003. [DOI] [PubMed] [Google Scholar]
- 9.Topper R, Jurgens E, Reul J, Thron A. Clinical significance of intracranial developmental venous anomalies. J Neurol Neurosurg Psychiatry. 1999;67:234–38. doi: 10.1136/jnnp.67.2.234. [DOI] [PMC free article] [PubMed] [Google Scholar]
- 10.Escott EJ. A variety of appearances of malignant melanoma in the head: a review. Radiographics. 2001;21:625–39. doi: 10.1148/radiographics.21.3.g01ma19625. [DOI] [PubMed] [Google Scholar]
- 11.Armao D, Castillo M, Chen H, et al. Colloid cyst of the third ventricle: imaging-pathologic correlation. Am J Neuroradiol. 2000;21(8):1470–77. [PMC free article] [PubMed] [Google Scholar]
- 12.Sumida M, Uozumi T, Makuda K, et al. Rathke cleft cyst: correlation of enhanced MR and surgical findings. Am J Neuroradiol. 1994;15(3):525–32. [PMC free article] [PubMed] [Google Scholar]
- 13.Bladowska J, Sokolska V, Czapiga E, et al. Advances in diagnostic imaging of the pituitary and the parasellar region. Adv Clin Exp Med. 2004;13:709–17. [Google Scholar]
- 14.Salzman KL. Primary CNS Lymphoma. In: Osborn AG, Salzman KL, Barkovich AJ, editors. Diagnostic imaging: Brain. 2nd ed. I-6. Salt Lake City: Amirsys; 2010. pp. 150–153. [Google Scholar]
- 15.Schwingel R, Reis F, Zanardi VA, et al. Central nervous system lymphoma: magnetic resonance imaging features at presentation. Arq Neuropsiquiatr. 2012;70(2):97–101. doi: 10.1590/s0004-282x2012000200005. [DOI] [PubMed] [Google Scholar]
- 16.Guo AC, Cummings TJ, Dash RC, et al. Lymphomas and high-grade astrocytomas: comparison of water diffusibility and histologic characteristics. Radiology. 2002;224:177–83. doi: 10.1148/radiol.2241010637. [DOI] [PubMed] [Google Scholar]
- 17.Valdés Hernández MC, Maconick LC, Tan EMJ, Wardlaw JM. Identification of mineral deposits in the brain on radiological images: a systematic review. Eur Radiol. 2012;22:2371–81. doi: 10.1007/s00330-012-2494-2. [DOI] [PubMed] [Google Scholar]
- 18.Ogg RJ, Steen RG. Age related changes in brain T1 are correlated with putative iron concentration. Magn Reson Med. 1998;40:749–53. doi: 10.1002/mrm.1910400516. [DOI] [PubMed] [Google Scholar]
- 19.Schenck JF. Magnetic resonance imaging of brain iron. J Neurol Sci. 2003;207:99–102. doi: 10.1016/s0022-510x(02)00431-8. [DOI] [PubMed] [Google Scholar]
- 20.Angelini C, Nardocci N, Rumi V. Hallervorden-Spatz disease: clinical and MRI study of 11 cases diagnosed in life. J Neurol. 1992;239:417–23. doi: 10.1007/BF00856805. [DOI] [PubMed] [Google Scholar]
- 21.Guillerman RP. The eye-of-the-tiger sign. Radiology. 2000;217:895–96. doi: 10.1148/radiology.217.3.r00dc31895. [DOI] [PubMed] [Google Scholar]
- 22.Lorincz MT. Neurologic Wilson’s disease. Ann NY Acad Sci. 2010;1184:173–87. doi: 10.1111/j.1749-6632.2009.05109.x. [DOI] [PubMed] [Google Scholar]
- 23.King AD, Walshe JM, Kendall BE, et al. Cranial MR imaging in Wilson’s disease. Am J Roentgenol. 1996;167:1579–84. doi: 10.2214/ajr.167.6.8956601. [DOI] [PubMed] [Google Scholar]
- 24.Acou M, Vanslembrouck J, Deblaere K, et al. Fahr disease. JBR–BTR. 2008;91:19. [PubMed] [Google Scholar]
- 25.Teng MM, Nasir Quadri SM, Luo CB, et al. Mr imaging of giant intracranial aneurysm. J Clin Neurosci. 2003;10(4):460–64. doi: 10.1016/s0967-5868(03)00092-4. [DOI] [PubMed] [Google Scholar]
- 26.Vanneste JA. Diagnosis and management of normal-pressure hydrocephalus. J Neurol. 2000;247:5–14. doi: 10.1007/s004150050003. [DOI] [PubMed] [Google Scholar]
- 27.Lisanti C. Normal MRI appearance and motion-related phenomena of CSF. Am J Roentgenol. 2007;188:716–25. doi: 10.2214/AJR.05.0003. [DOI] [PubMed] [Google Scholar]
- 28.Chou S, Ning M, Buonanno F. Focal intraparenchymal tension pneumocephalus. Neurology. 2006;67:1485. doi: 10.1212/01.wnl.0000229141.21182.6c. [DOI] [PubMed] [Google Scholar]


