Short abstract
Cardiovascular disease is the leading cause of death worldwide. Many cardiovascular diseases are better diagnosed during a cardiac stress test. Current approaches include either exercise or pharmacological stress echocardiography and pharmacological stress magnetic resonance imaging (MRI). MRI is the most accurate noninvasive method of assessing cardiac function. Currently there are very few exercise devices that allow collection of cardiovascular MRI data during exercise. We developed a low-cost exercise device that utilizes adjustable weight resistance and is compatible with magnetic resonance (MR) imaging. It is equipped with electronics that measure power output. Our device allows subjects to exercise with a leg-stepping motion while their torso is in the MR imager. The device is easy to mount on the MRI table and can be adjusted for different body sizes. Pilot tests were conducted with 5 healthy subjects (3 male and 2 female, 29.2 ± 3.9 yr old) showing significant exercise-induced changes in heart rate (+42%), cardiac output (+40%) and mean pulmonary artery (PA) flow (+%49) post exercise. These data demonstrate that our MR compatible stepper exercise device successfully generated a hemodynamically stressed state while allowing for high quality imaging. The adjustable weight resistance allows exercise stress testing of subjects with variable exercise capacities. This low-cost device has the potential to be used in a variety of pathologies that require a cardiac stress test for diagnosis and assessment of disease progression.
Introduction
Cardiovascular disease is the leading cause of death in developed nations, including the United States [1]. According to the Centers for Disease Control and Prevention (CDC), there were 595,444 deaths due to heart disease alone in 2010 [2]. Assessment of cardiac function during exercise can be used as a diagnostic tool in the investigation of a wide range of cardiovascular diseases [1]. Several cardiovascular pathologies, such as myocardial ischemia, may only be apparent when the heart rate and cardiac output (CO) are higher than at rest [3,4]. For this reason, diagnostic stress tests, in which a subject’s heart rate and CO are increased by either pharmacological stimulation or physical exercise, are often conducted.
Pharmacological stress tests have been shown to be as diagnostically useful as exercise stress tests and safe, provided that trained professionals closely monitor vital signs and resuscitation equipment is available [5,6]. These tests can be performed with different noninvasive imaging techniques but MRI is the reference standard for noninvasive measurement of global and local cardiac function as it provides three dimensional imaging data with high spatial and temporal resolution [7–9]. Using MR images, changes in flow, ventricular volume, and cardiac output can be measured throughout the cardiac cycle [10,11]. In addition, cardiac perfusion can be assessed [12]. Indices of cardiac function from MRI-based pharmacological stress tests are strong predictors of myocardial infarction morbidity and mortality [13].
However, advantages to performing an exercise stress test are that it more closely resembles cardiovascular stress experienced during daily life, is better tolerated by patients, and is more cost effective [14]. Physical exercise stress is commonly utilized in conjunction with echocardiography to evaluate cardiac function and performance [3,15]. In the context of MRI imaging, physical exercise stress poses significant challenges due to the limited space in the cylindrical cavity of the MR machine in which imaging takes place (the bore), the horizontal position of the subject during imaging, incompatibility of standard exercise equipment with the strong magnetic fields required for MR imaging and the sensitivity of MRI to motion artifacts. Therefore, most MRI-based physical exercise stress tests to date have used a paradigm in which exercise is performed outside of the MRI bore with a bicycle or treadmill; when the target level of exercise is reached, the subject stops exercising, relocates to a supine position on the MR table and is advanced into the bore for imaging [16,17]. The time lapse between exercising and imaging often allows for the subject’s heart rate and CO to recover, especially for subjects with close to normal cardiac function. Therefore, exercise devices that can be used while the subject’s torso remains in the MRI bore address a significant unmet clinical need.
Herein, we describe the design and construction of low-cost exercise device that is compatible with both exercise and cardiac MR imaging and pilot data from 5 healthy subjects that demonstrate its ability to induce exercise stress.
Materials and Methods
Mechanical Design.
Our design uses a stepping motion with adjustable weights as the source of resistance (Fig. 1). It is constructed mainly of high-density polyethylene (HDPE), aluminum, brass, and nylon, all nonferrous materials. The base of the device is a 1.27 cm (½ in.) thick HDPE sheet, with two angled tracks underneath. These angled tracks match the contours of the MRI table, allowing both the device and subject to slide on the MRI table as needed to ensure the torso is inside the MR bore while the legs are free to move (Fig. 2).
Fig. 1.
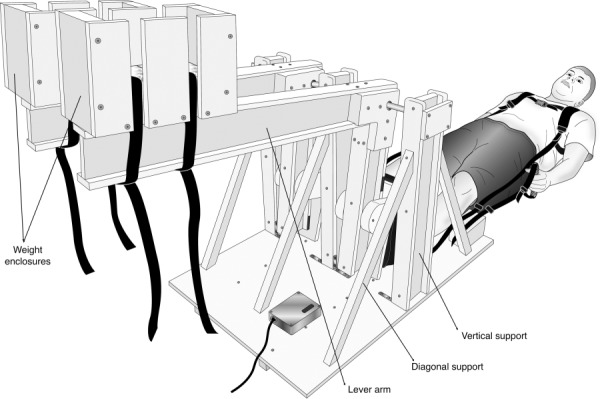
MRI-compatible stepper exercise device in the initial position and a subject ready to begin exercising. The L-shaped lever arms have enclosures for weights at the end of the long arms (which are horizontal in orientation shown) and foot pedals for the subject’s feet at the end of the short arms (which are vertical in the orientation shown). The moving parts are fixed on a platform designed to sit securely on the MRI bed. A backpack-type shoulder harness and hand straps are used to enhance stability and decrease torso motion during exercise. A shielded electronic box with a motion sensor that transmits information regarding stepping cadence is installed on the platform.
Fig. 2.
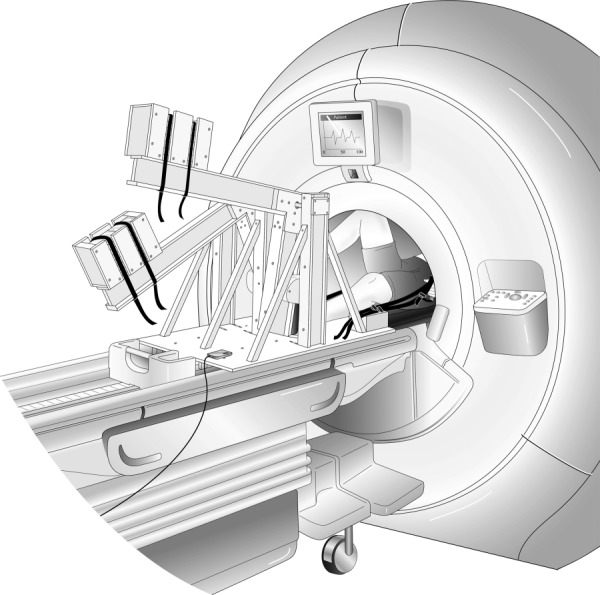
MRI-compatible stepper exercise device shown in use in an MR imaging system. The exercise device is placed on the MR table while the subject is on his/her back (supine position); the subject’s torso, which is being imaged, must be inside the cylindrical cavity (the MR bore). As the subject extends and then flexes alternating knees, the L-shaped lever arms are raised and then lowered in a dynamic stepping motion. The subject is prompted to maintain cadence using a metronome; the actual stepping cadence is measured by the built-in motion sensor which is connected to a computer in the monitoring room.
The stepping motion is accomplished through the use of two L-shaped lever arms. Within each lever arm, two glass-acetal bearings allow for smooth rotation on a pivot constructed of aluminum. These components are held up with three vertical supports. Both the lever arms and vertical supports were constructed as I-beams using 1.27 cm (½ in.) thick HDPE, with a 7.62 cm (3 in.) web and 5.08 cm (2 in.) flanges. As the subject pushes on foot pedals mounted on the short arms, he or she raises the weights in the weight enclosures at the end of the long arms. The foot pedals consist of 30.48 cm (12 in.) long, 1.27 cm (1/2 in.) thick pieces of HDPE, each rotating on two glass-acetal bearings, with plastic, foam, and nylon shoes attached to each pedal. The shoes add stability to the user’s foot during exercise and the bearings allow the foot pedals to articulate forward and backward, allowing for a more comfortable stepping motion.
The weights consist of DuPont Zodiaq tiles: a nonferrous, quartz-based material with a high density of 2.4–2.5 g/cm3. HDPE weight enclosures, each with a maximum capacity of 16 tiles, are located at the end of the long arms, as shown in Fig. 1. Since each tile weighs approximately 0.45 kg (1 lb), this allows for a variable capacity of 0–7.27 kg (0–16 lbs) on each leg, which provides a discretely adjustable level of resistance. In addition to the foot pedal shoes, nylon hand straps and a shoulder harness are used to secure the user to the device and reduce subject movement. The shoulder harness has a quick releasing clip and the foot pedals have Velcro straps that allow the subject to be removed quickly in case of a medical emergency.
Electronic Measurement/Feedback System.
An optical sensor to measure the distance from the base to one of the moving lever arms (Sharp GP2Y0A02YK0F—Sharp Microelectronics of the Americas, Camas, WA) was incorporated into the design in order to measure stepping power and cadence. This sensor emits an infrared (IR) beam of light, which reflects off of the underside of the lever arm and then returns to the sensor. Based on the distance to the lever arm and the angle of reflection changes, the sensor outputs a corresponding analog voltage. This information is transmitted to a microcontroller (Arduino Uno, Arduino, Italy) and then the data are sent via universal serial bus (USB) to a serial port on a laptop computer. Custom-designed code (written in matlab R2011, The Math Works, Inc., Natick, MA) converts the voltage data to a distance measurement based on calibration experiments and a best curve fit.
As the subject exercises, the angular rotation of the lever arm is calculated for each step based on the distance sensor output. Additionally, the time between each peak distance is recorded and used for the calculation of stepping cadence. Using the values for angular rotation, stepping cadence, and weight in each enclosure, along with the geometry of the device, the power output can be calculated as a function of work and time. In particular, assuming that each step performed by the subject is the same and that at the end of each step the lever arm returns to the initial position (Fig. 1), the power can be calculated as
| (1) |
where P is the power, R is stepping cadence in steps per minute, m is the mass raised, g is the gravity, and Δh is the change in height of the lever arm.
As each lever arm rotates around the pivot bar (X = 0, Y = 0) (Fig. 3), the associated work is a function of the weight of the enclosure itself as well as the weight added (N), the masses of the long and short arms (mL and mS, respectively) (Fig. 4), the centers of mass of the long and short arms (( L, L) and ( S, S), respectively) and the of weight enclosure ( WE, WE), and the angle of rotation θ
Fig. 3.
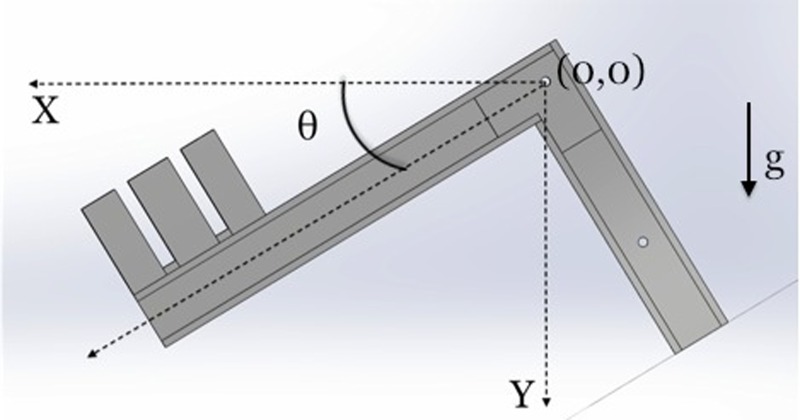
A single L-shaped lever arm in a midstep position and angle θ from the initial position. Note, the initial position is marked by the dotted lines in the X and Y directions and the position of the pivot bar is denoted by (0,0). Gravity (g) acts in the Y direction.
Fig. 4.
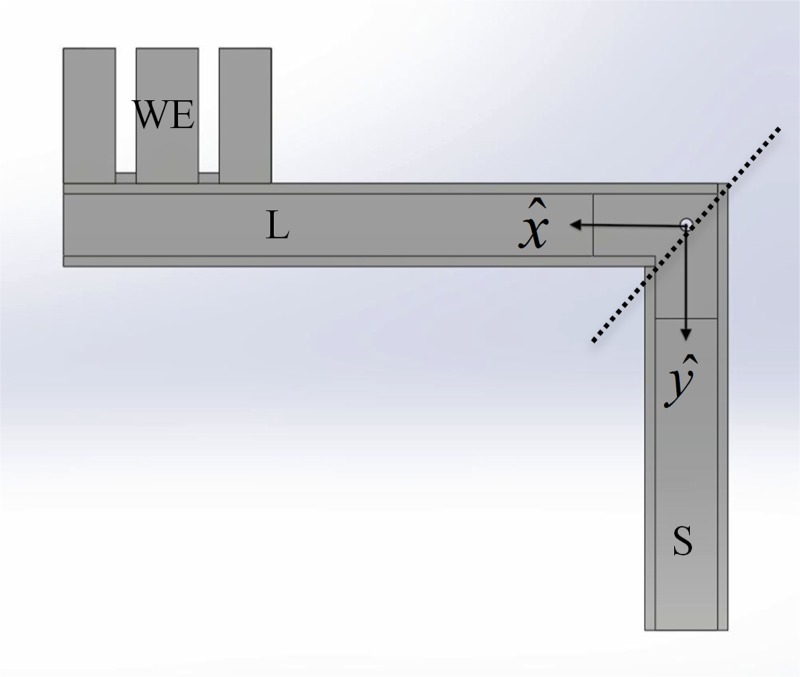
Sections of the L-shaped lever arm. For power calculations, three sections of each L-shaped lever arm were considered: the long arm (L), short arm (S), and WE. See Table 1 for the mass and location of center of mass of each of these three sections.
| (2) |
The angle of rotation θ is calculated as
| (3) |
where H is the height change in a given step and L is the x-distance from the pivot point to the sensor location on the long arm (25.7 cm). Finally, stepping cadence is computed as the inverse of the time between peaks in the sensor reading.
Then, stepping power is computed as in Eq. (1) from θ and R during exercise, the weight added N for a given exercise level and the remaining known parameters. The value for gravity, g, is 9.81 m/s2.
A graphical user interface was created to display lever arm motion, cadence and power in real time. Based on this information, feedback and instructions were given to the subject to improve his or her performance and alter the cadence if needed (Fig. 5).
Fig. 5.
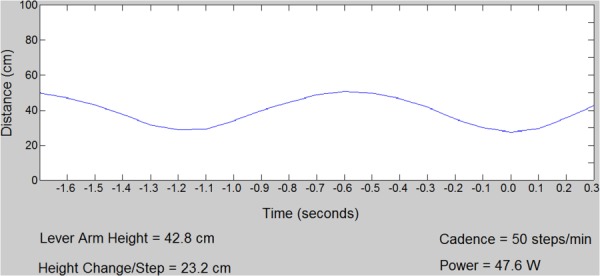
Screenshot of matlab GUI displayed in control room during exercise stress. The graph shows the distance of the lever arm from the optical sensor. “Power” indicates real-time calculation of the workload based on Eqs. (1)–(3).
In order to shield the electronics from the radio frequency interference generated during MR scanning and to avoid imaging artifacts, an aluminum Faraday cage was created around the sensor and microcontroller. Also, copper wool was soldered onto the existing shielding of a USB cable that connects the microcontroller on the device to the control room through a waveguide. Copper on the end of the USB cord near the device provided additional shielding. This shielding proved effective at preventing radiofrequency interference from the MR scanner, allowing stepping cadence and stepping power data to be collected during MR scanning.
Cost.
The total cost of parts and materials used in the construction of this device, not including software or labor, was less than $200. With the drawings and supplies available, the manufacturing process could be completed in less than 10 h. Therefore the manufacturing costs in the U.S. can be as low as $100.
Pilot Testing Protocol.
Pilot testing was performed on 5 healthy adult subjects (3 male and 2 female, 29.2 ± 3.9 yr old, weight 74.9 ± 6.3 kg, height 168 ± 10 cm) using an institutional review board (IRB)-approved protocol after written informed consent was obtained. Images were obtained before exercise as a baseline and during a brief cessation from 3 to 4 min of physical exercise. Exercise was suspended during imaging because residual movements caused motion artifacts and unreliable gating off the ECG signal despite the hand straps and other torso movement stabilization features. Attempts with pulse oximeter gating suffered from unreliable gating as well due to hand movements during exercise. After the 3–4 min exercise segment, subjects were instructed to lie still and were imaged.
Magnetic Resonance Imaging.
MR images were obtained using a 1.5 T scanner (HDxt GE Healthcare, Waukesha, WI) with a bore diameter of 55 cm and an eight-element phased array cardiac coil (GE Healthcare, Waukesha, WI). Cardiac output was assessed by acquiring two-dimensional (2D) phase contrast (PC) flow-sensitive MR images through the ascending and descending aorta and pulmonary artery. Representative slice location and corresponding cross-sectional images of the ascending and descending aorta are shown in Fig. 6; images of the main pulmonary artery (MPA) are shown in Fig. 7. 2D PC MRI measures blood flow velocity based on the difference between the phase of magnetization for the flowing blood and the stationary tissues [18,19]. Using the phase images, time-resolved flow through a cross section of aorta and main pulmonary artery was measured. The parameters of the product sequence were: field-of-view: 24 × 36 cm, acquired spatial resolution = 1 × 1.5 mm, cine PC with ECG gating, segmented k-space acquisition with 4 views per segment, breathhold, scan time = 30 heart beats. In addition to the phase images that are used to encode flow information, 2D PC acquisition also generate conventional anatomical images (magnitude images) which were used to define the boundaries and location of the cross-sectional area for flow calculations.
Fig. 6.
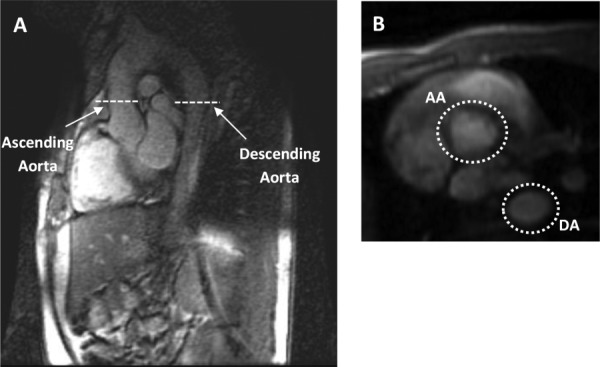
Ascending and descending aorta slice locations. Flows in the ascending and descending aorta were measured at rest and during a brief cessation in physical exercise stress. (a) Sagittal image displaying the location of the 2D PC slices that include the ascending and descending aorta. (b) The cross sections of both the AA and DA at rest.
Fig. 7.
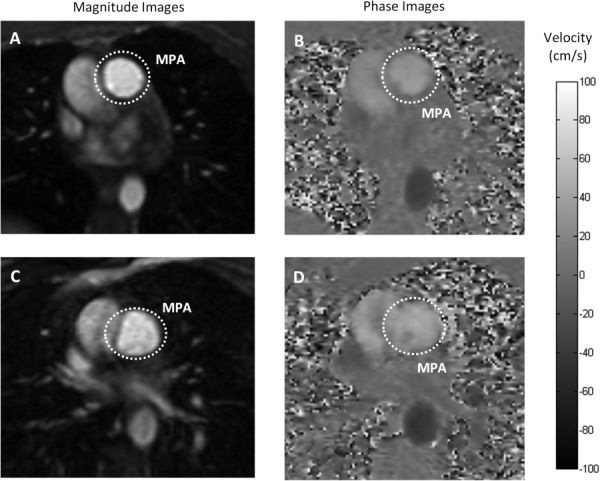
Magnitude and phase MR images of the MPA. Flow in the MPA was measured at rest and during a brief cessation from physical exercise stress from the phase contrast-derived velocity maps integrated over the magnitude-derived area. Grayscale magnitude (a) and phase contrast (b) images of MPA cross section at rest. Grayscale image (c) and phase contrast image (d) of MPA during a brief cessation from physical exercise stress. Both image sets represent peak systole. Color-bar represents flow velocity in the phase images (ranges from −100 cm/s to 100 cm/s) ((b) and (d)).
Data Analysis.
Peak flow was calculated as the maximum flow within the cardiac cycle; mean flow was calculated as the average flow over the cardiac cycle. Stroke volume was calculated as the mean flow in the aorta (CO) divided by the heart rate, which was derived from the length of the cardiac cycle. Relative area change (RAC = (max cross-sectional area (CSA)—min CSA)/min CSA) [20] of the MPA was calculated from the time-resolved cross-sectional area of the MPA obtained from the magnitude images.
All data are presented as mean ±SD. Student’s paired t-test was used to compare parameters between rest and exercise conditions.
Results
Qualitative assessment of 2D PC magnitude images (Figs. 7(a) and 7(c)) at rest and during a brief cessation from exercise indicate increased lung perfusion due to exercise. Blood vessels appear bright in the magnitude images acquired by 2D PC-MRI. Increased number of bright areas in the images acquired during a brief cessation from exercise (Fig. 7(c)) compared with images obtained at rest (Fig. 7(a)) indicate more vessel recruitment and therefore higher lung perfusion. This qualitative result was confirmed with quantitative assessment. As evidenced by the ensemble-averaged flow rates over a cardiac cycle of one representative female subject at rest and during a brief cessation from physical exercise (Figs. 8(a) and 8(b)), exercise increased the mean flow rate in the descending aorta by +43% and in the ascending aorta by +40%. On average for all 5 subjects, the mean flow rates of ascending and descending aorta significantly increased with exercise (Fig. 7(c)). The average heart rate of all subjects increased by 42%, from the baseline of 59.0 ± 8.9 beats per minute (bpm) to 83.6 ± 22.2 bpm and the average cardiac output increased by 42% (Table 2).
Fig. 8.
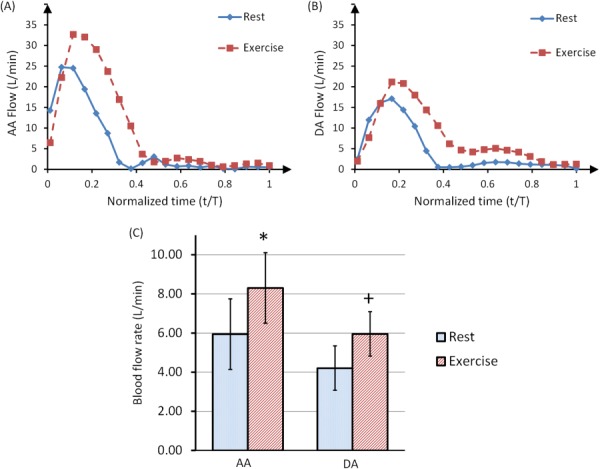
Ensemble-averaged blood flow rates (over 10 heartbeats) in the AA (a) and DA (b) of a representative female subject, at rest and during a brief cessation from physical exercise stress. The time component was normalized with respect to the total period of the cardiac cycle for each curve. Panel (c) shows mean flow rates for 5 subjects at rest and during a brief cessation from exercise. Both AA and DA mean flow rates significantly increased due to exercise. Statistical significance (P < 0.05) was detected with Student’s t-test.
Table 2.
Summary of hemodynamic data obtained at rest and during a brief cessation from physical exercise averaged for 5 healthy subjects. AA: ascending aorta, DA: descending aorta, MPA: main pulmonary artery. Significant difference between rest and exercise was observed for heart rate, mean AA flow, mean DA flow, mean MPA flow and RAC of MPA. Data are expressed as mean ±SD. P value <0.05 indicates statistically significant difference between rest and exercise conditions.
| Hemodynamic parameter | Rest | Exercise a | % change of mean | Statistical significance |
|---|---|---|---|---|
| Heart rate (bpm) | 59.0 ± 8.9 | 83.6 ± 22.2 | 41.7 | P < 0.05 |
| Peak AA flow (mL/s) | 28.3 ± 4.4 | 31.9 ± 4.8 | 12.7 | — |
| Mean AA flow (cardiac output) (mL/s) | 5.94 ± 0.7 | 8.3 ± 1. 8 | 39.7 | P < 0.05 |
| Peak DA flow (mL/s) | 18.1 ± 2.1 | 20.4 ± 1.5 | 12.7 | — |
| Mean DA flow (mL/s) | 4.2 ± 0.6 | 6.0 ± 1.1 | 42.9 | P < 0.05 |
| Peak MPA flow (mL/s) | 25.3 ± 5.5 | 29.6 ± 7.6 | 17.0 | — |
| Mean MPA flow (mL/s) | 4.9 ± 1.1 | 7.3 ± 2.5 | 49.0 | P < 0.05 |
| Stroke volume (mL) | 71.7 ± 7.7 | 72.8 ± 11.7 | 1.5 | — |
| RAC of the MPA (%) | 0.4 ± 0.2 | 0.3 ± 0.1 | −25.0 | P < 0.05 |
| Workload (W) | 0 | 50 ± 5 | — | — |
All “Exercise” values are measured during a brief cessation from the exercise (except the workload).
Table 1.
Mass and location of center of mass for the three sections of each L-shaped lever arm: the long arm, the short arm and the weight enclosure (see Fig. 4)
| Mass, m | |||
|---|---|---|---|
| Long arm | 2.18 kg | 30.10 cm | 0.14 cm |
| Short arm | 1.16 kg | 0.19 cm | 18.43 cm |
| Weight enclosure | Variable | 62.23 cm | ∼0 |
As expected, ensemble-averaged blood flow rate in the MPA also increased with exercise; in the same representative female subject, MPA mean flow rates increased by 101%. Furthermore, exercise significantly increased the average of flow in the MPA for all five subjects, by 49% (Fig. 9(c)). The CSA of the MPA also increased with exercise (Fig. 8(b)). We calculated the minimum and maximum CSA of the MPA during the cardiac cycle for all of the subjects. The averaged CSA data shows significant increase of the minimum CSA with exercise (by 21%). As a consequence, RAC of the MPA significantly decreased by about 25% post exercise (Table 2).
Fig. 9.
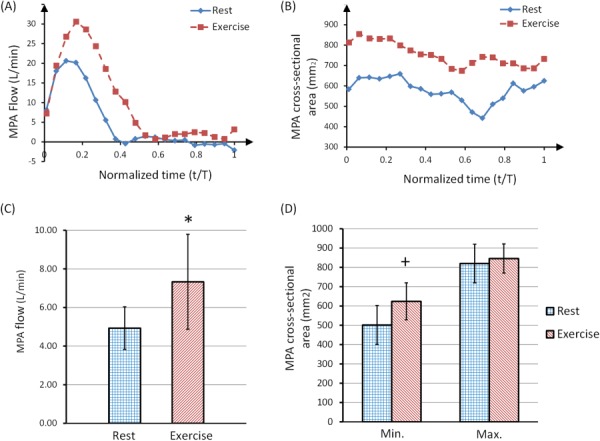
Ensemble-averaged blood flow rate (over 10 heartbeats) in the MPA (a) and cross-sectional area of the MPA (b) of a representative female subject, showing both rest and a brief cessation from exercise stress. The time component was normalized with respect to the total period of the cardiac cycle for each curve. Panel (c) shows the average MPA flow rate of 5 subjects at rest and during brief cessation from exercise (*P < 0.05). Panel (d) shows the minimum and maximum MPA cross-sectional area at rest and during a brief cessation from exercise stress (+P < 0.05).
Discussion
Cardiac stress test is an important diagnostic and prognostic tool for a wide range of cardiovascular pathologies. We designed, constructed and tested a low-cost MRI-compatible exercise device to examine cardiac function with physical stress. The design of our device allowed the subject to exercise inside the MRI bore, thereby minimizing the intermission between exercising and imaging. The exercise work-load was adjusted by changing the stepping resistance or cadence. The built-in electronic feedback system enabled real-time measurement and monitoring of the workload. The pilot testing demonstrated that our device was successful at inducing a cardiac stress state, without the use of pharmaceuticals, while simultaneously allowing high quality MR imaging. Unlike pharmacologically induced cardiac stress, exercise with our device can be stopped at any time, which increases the safety of the device. Unlike echocardiography-based exercise stress tests, our device allows high quality imaging of the right ventricle. That is, whereas exercise stress echocardiography has been used to identify early-stage pulmonary hypertension in systemic sclerosis [21], echocardiographic assessment of the right ventricle remains challenging due to its asymmetric shape. Cardiac-MRI is currently considered as the reference standard for right ventricular structure and function assessment [22]. Utilizing exercise stress tests with cardiac-MRI will allow better assessment of exercise intolerance in various cardiovascular pathologies such as congenital heart disease, tetralogy of Fallot and pulmonary hypertension [23]. Hence, our device has a great potential in functional right heart studies for diagnosis and prognosis of cardiopulmonary vascular diseases.
The response of cardiac hemodynamics to exercise stress has been previously studied with MRI [16,24–26]. Using a treadmill near the MRI, Jekic et al. demonstrated a threefold increase in CO with exercise in healthy volunteers [16]. The main drawback of this treadmill system is the repositioning time between the exercise and imaging, which allows significant heart rate recovery in healthy subjects. Currently, there are two commercially available exercise devices that allow exercise inside the MRI bore: the MRI cardiac ergometer (Lode BV, Groningen, The Netherlands) [25,26] and the cardiospect ergometer [27,28]. Both of these devices cost approximately $25k, whereas the total cost for the custom-made exercise device presented here was under $200. Recently, Gusso et al. described the design and construction of a cycle ergometer that can be used inside the MRI bore [24]. While Gusso et al. did not report the cost of their device, we anticipate that the greater simplicity of the stepping motion led to lower costs for our device. The simple design and fabrication methods used for our device compared with similar commercial and custom-made devices allow easier and cheaper modifications to address different needs (e.g., smaller device for stress-tests in children). Furthermore, the readily available and inexpensive parts and supplies in our device make routine maintenance and repair cost-effective. In addition, operating our exercise device requires few skills, which is desirable in the clinical environment. Overall our custom-made device offers a feasible, safe, easy-to-use and low-cost clinical platform for the noninvasive measurement of cardiac response to exercise stress.
The main limitation of the device is its relatively large size and overall dimensions (height = 70 cm, width = 60 cm, length = 100 cm) which must be considered in storage and transportation. The main limitation of our study was the inability of the MR sequence to capture instantaneous changes of blood flow velocity during exercise without ECG-gating. The 2D PC blood flow quantification is based on integrating the voxel velocities in the region of interest (vessel lumen). To accurately quantify the hemodynamic changes, data acquisition with high temporal resolution is preferable. However to acquire images with appropriate spatial resolution, scanning time has to be longer than a single heartbeat. Therefore, the scans were segmented throughout consecutive cardiac cycles by ECG-gating (RR interval) and ensemble-averaged blood flow measurements represent multiple cardiac cycles. Characterizing flow velocity over multiple cardiac cycles in highly transient flows (such as in recovery from exercise) could be inaccurate due to beat-to-beat variations. Thus, the use of segmented ECG-gating is a limitation in these studies. Using faster imaging sequences or alternative gating techniques which require fewer cardiac cycles could improve the accuracy of flow measurements [29]. Another limitation of the study is that we did not collect qualitative or quantitative data on subject or clinician acceptance, subject comfort, or subject perceived exertion using the device.
Conclusions
We designed, constructed and tested a relatively inexpensive MRI-compatible exercise device for the purpose of MRI cardiac stress testing. We performed a pilot test with 5 healthy adult subjects and demonstrated significant increases in heart rate and cardiac output. The main advantage of our exercise device is the minimal intermission between exercising and imaging that allows accurate capture of hemodynamic changes in the cardiovascular system. The use of exercise in the MR scanner offers great potential in clinical practice to accurately and noninvasively assess cardiovascular function under stress.
Acknowledgment
The authors would like to thank Willis Tompkins, Claudia Korcarz, Joanne Weber, and Ken Kriesel for guidance in the early design phases of the project. The authors also thank Jenny Swartz, Sara John, Jenelle Fuller, and Kelli Hellenbrand for recruiting and assisting with the MR scan of the subjects. Funding for this project was provided by the Vascular Biomechanics Initiative and R01 HL 105598 (NCC).
Glossary
Nomenclature
- AA =
ascending aorta
- BPM =
beats per minute
- CDC =
Centers for Disease Control and Prevention
- CO =
cardiac output
- DA =
descending aorta
- ECG =
electrocardiography
- EDV =
end diastolic volume
- ESV =
end systolic volume
- HDPE =
high-density polyethylene
- HR =
heart rate
- IR =
infrared
- IRB =
institutional review board
- MPA =
main pulmonary artery
- MRI =
magnetic resonance imaging
- PA =
pulmonary artery
- RAC =
relative area change
- RF =
radiofrequency
- RV =
right ventricle
- SV =
stroke volume
- TRJV =
tricuspid regurgitant jet velocity
- VTI =
velocity-time integral
Contributor Information
Omid Forouzan, Department of Biomedical Engineering, , University of Wisconsin-Madison, , Engineering Centers Building, , 1550 Engineering Drive, , Madison, WI 53706, e-mail: forouzan@wisc.edu.
Evan Flink, Department of Biomedical Engineering, , University of Wisconsin-Madison, , Engineering Centers Building, , 1550 Engineering Drive, , Madison, WI 53706, e-mail: ewflink@gmail.com.
Jared Warczytowa, Department of Biomedical Engineering, , University of Wisconsin-Madison, , Engineering Centers Building, , 1550 Engineering Drive, , Madison, WI 53706, e-mail: jaredwarczytowa@gmail.com.
Nick Thate, Department of Biomedical Engineering, , University of Wisconsin-Madison, , Engineering Centers Building, , 1550 Engineering Drive, , Madison, WI 53706, e-mail: nthate@gmail.com.
Andrew Hanske, Department of Biomedical Engineering, , University of Wisconsin-Madison, , Engineering Centers Building, , 1550 Engineering Drive, , Madison, WI 53706, e-mail: ahanske@epic.com.
Tongkeun Lee, Department of Biomedical Engineering, , University of Wisconsin-Madison, , Engineering Centers Building, , 1550 Engineering Drive, , Madison, WI 53706, e-mail: leto@seas.upenn.edu.
Alejandro Roldan-Alzate, Department of Medical Physics, , Wisconsin Institutes for Medical Research, , 1111 Highland Avenue, , Madison, WI 53705-2275;; Department of Radiology, , University of Wisconsin, , School of Medicine and Public Health, , E3/366 Clinical Science Center, , 600 Highland Avenue, , Madison, WI 53792-3252, e-mail: aroldan@uwhealth.org
Chris François, Department of Radiology, , University of Wisconsin, , School of Medicine and Public Health, , E3/366 Clinical Science Center, , 600 Highland Avenue, , Madison, WI 53792-3252, e-mail: cfrancois@uwhealth.org.
Oliver Wieben, Department of Biomedical Engineering, , University of Wisconsin-Madison, , Engineering Centers Building, , 1550 Engineering Drive, , Madison, WI 53706;; Department of Medical Physics, , Wisconsin Institutes for Medical Research, , 1111 Highland Avenue, , Madison, WI 53705-2275; Department of Radiology, , University of Wisconsin, , School of Medicine and Public Health, , E3/366 Clinical Science Center, , 600 Highland Avenue, , Madison, WI 53792-3252, e-mail: owieben@wisc.edu
Naomi C. Chesler, Department of Biomedical Engineering, , University of Wisconsin-Madison, , Engineering Centers Building, , 1550 Engineering Drive, , Madison, WI 53706, e-mail: chesler@engr.wisc.edu
References
- [1]. Torpy, J. M. , Lynm, C. , and Glass, R. M. , 2008, “JAMA Patient Page. Cardiac Stress Testing,” JAMA, 300(15), p. 1836.10.1001/jama.300.15.1836 [DOI] [PubMed] [Google Scholar]
- [2]. Murphy, S. L. , Xu, J. , and Kochanek, K. D. , 2012, “Deaths: Preliminary Data for 2010,” National Vital Statistics Reports, Vol. 60, No. 4. National Center for Health Statistics, Hyattsville, MD. [Google Scholar]
- [3]. Picano, E. , Pibarot, P. , Lancellotti, P. , Monin, J. L. , and Bonow, R. O. , 2009, “The Emerging Role of Exercise Testing and Stress Echocardiography in Valvular Heart Disease,” J. Am. Coll. Cardiol., 54(24), pp. 2251–226010.1016/j.jacc.2009.07.046 [DOI] [PubMed] [Google Scholar]
- [4]. Stringer, W. W. , 2010, “Cardiopulmonary Exercise Testing: Current Applications,” Expert Rev. Respir. Med., 4(2), pp. 179–18810.1586/ers.10.8 [DOI] [PubMed] [Google Scholar]
- [5]. Tsutsui, J. M. , Elhendy, A. , Xie, F. , O'Leary, E. L. , McGrain, A. C. , and Porter, T. R. , 2005, “Safety of Dobutamine Stress Real-Time Myocardial Contrast Echocardiography,” J. Am. Coll. Cardiol., 45(8), pp. 1235–124210.1016/j.jacc.2005.01.024 [DOI] [PubMed] [Google Scholar]
- [6]. Wahl, A. , Paetsch, I. , Gollesch, A. , Roethemeyer, S. , Foell, D. , Gebker, R. , Langreck, H. , Klein, C. , Fleck, E. , and Nagel, E. , 2004, “Safety and Feasibility of High-Dose Dobutamine-Atropine Stress Cardiovascular Magnetic Resonance for Diagnosis of Myocardial Ischaemia: Experience in 1000 Consecutive Cases,” Eur. Heart J., 25(14), pp. 1230–123610.1016/j.ehj.2003.11.018 [DOI] [PubMed] [Google Scholar]
- [7]. Wieben, O. , Francois, C. , and Reeder, S. B. , 2008, “Cardiac MRI of Ischemic Heart Disease at 3 T: Potential and Challenges,” Eur. J. Radiol., 65(1), pp. 15–2810.1016/j.ejrad.2007.10.022 [DOI] [PubMed] [Google Scholar]
- [8]. Oshinski, J. N. , Delfino, J. G. , Sharma, P. , Gharib, A. M. , and Pettigrew, R. I. , 2010, “Cardiovascular Magnetic Resonance at 3.0T: Current State of the Art,” J. Cardiovasc. Magn. Reson.: Off. J. Soc. Cardiovasc. Magn. Reson., 12(Oct.), p. 55.10.1186/1532-429X-12-55 [DOI] [PMC free article] [PubMed] [Google Scholar]
- [9]. van Rugge, F. P. , van der Wall, E. E. , de Roos, A. , and Bruschke, A. V. , 1993, “Dobutamine Stress Magnetic Resonance Imaging for Detection of Coronary Artery Disease,” J. Am. Coll. Cardiol., 22(2), pp. 431–43910.1016/0735-1097(93)90047-5 [DOI] [PubMed] [Google Scholar]
- [10]. Kumar, A. , Patton, D. J. , and Friedrich, M. G. , 2010, “The Emerging Clinical Role of Cardiovascular Magnetic Resonance Imaging,” Can. J. Cardiol., 26(6), pp. 313–32210.1016/S0828-282X(10)70396-2 [DOI] [PMC free article] [PubMed] [Google Scholar]
- [11]. Axel, L. , 2002, “Biomechanical Dynamics of the Heart With MRI,” Ann. Rev. Biomed. Eng., 4, pp. 321–34710.1146/annurev.bioeng.4.020702.153434 [DOI] [PubMed] [Google Scholar]
- [12]. Hunold, P. , Schlosser, T. , and Barkhausen, J. , 2006, “Magnetic Resonance Cardiac Perfusion Imaging—A Clinical Perspective,” Eur. Radiol., 16(8), pp. 1779–178810.1007/s00330-006-0269-3 [DOI] [PubMed] [Google Scholar]
- [13]. Hundley, W. G. , Morgan, T. M. , Neagle, C. M. , Hamilton, C. A. , Rerkpattanapipat, P. , and Link, K. M. , 2002, “Magnetic Resonance Imaging Determination of Cardiac Prognosis,” Circulation, 106(18), pp. 2328–233310.1161/01.CIR.0000036017.46437.02 [DOI] [PubMed] [Google Scholar]
- [14]. Ryf, S. , Schwitter, J. , Spiegel, M. A. , Rutz, A. K. , Luechinger, R. , Crelier, G. R. , and Boesiger, P. , 2005, “Accelerated Tagging for the Assessment of Left Ventricular Myocardial Contraction Under Physical Stress,” J. Cardiovasc. Magn. Reson.: Off. J. Soc. Cardiovasc. Magn. Reson., 7(4), pp. 693–70310.1081/JCMR-200065637 [DOI] [PubMed] [Google Scholar]
- [15]. Bossone, E. , and Armstrong, W. F. , 1999, “Exercise Echocardiography. Principles, Methods, and Clinical Use,” Cardiol. Clin., 17(3), pp. 447–46010.1016/S0733-8651(05)70090-4 [DOI] [PubMed] [Google Scholar]
- [16]. Jekic, M. , Foster, E. L. , Ballinger, M. R. , Raman, S. V. , and Simonetti, O. P. , 2008, “Cardiac Function and Myocardial Perfusion Immediately Following Maximal Treadmill Exercise Inside the MRI Room,” J. Cardiovasc. Magn. Reson.: Off. J. Soc. Cardiovasc. Magn. Reson., 10(1), p. 3.10.1186/1532-429X-10-3 [DOI] [PMC free article] [PubMed] [Google Scholar]
- [17]. Raman, S. V. , Dickerson, J. A. , Jekic, M. , Foster, E. L. , Pennell, M. L. , McCarthy, B. , and Simonetti, O. P. , 2010, “Real-Time Cine and Myocardial Perfusion With Treadmill Exercise Stress Cardiovascular Magnetic Resonance in Patients Referred for Stress SPECT,” J. Cardiovasc. Magn. Reson.: Off. J. Soc. Cardiovasc. Magn. Reson., 12(1), p. 41.10.1186/1532-429X-12-41 [DOI] [PMC free article] [PubMed] [Google Scholar]
- [18]. Srichai, M. B. , Lim, R. P. , Wong, S. , and Lee, V. S. , 2009, “Cardiovascular Applications of Phase-Contrast MRI,” Am. J. Roentgenol., 192(3), pp. 662–67510.2214/AJR.07.3744 [DOI] [PubMed] [Google Scholar]
- [19]. Lotz, J. , Meier, C. , Leppert, A. , and Galanski, M. , 2002, “Cardiovascular Flow Measurement With Phase-Contrast MR Imaging: Basic Facts and Implementation,” Radiograph.: Rev. Publ. Radiol. Soc. North Am., Inc, 22(3), pp. 651–67110.1148/radiographics.22.3.g02ma11651 [DOI] [PubMed] [Google Scholar]
- [20]. Gan, C. T. , Lankhaar, J. W. , Westerhof, N. , Marcus, J. T. , Becker, A. , Twisk, J. W. , Boonstra, A. , Postmus, P. E. , and Vonk-Noordegraaf, A. , 2007, “Noninvasively Assessed Pulmonary Artery Stiffness Predicts Mortality in Pulmonary Arterial Hypertension,” Chest, 132(6), pp. 1906–191210.1378/chest.07-1246 [DOI] [PubMed] [Google Scholar]
- [21]. Codullo, V. , Caporali, R. , Cuomo, G. , Ghio, S. , D'Alto, M. , Fusetti, C. , Borgogno, E. , Montecucco, C. , and Valentini, G. , 2013, “Stress Doppler Echocardiography in Systemic Sclerosis: Evidence for a Role in the Prediction of Pulmonary Hypertension,” Arthritis Rheum., 65(9), pp. 2403–241110.1002/art.38043. [DOI] [PubMed] [Google Scholar]
- [22]. Valsangiacomo Buechel, E. R. , and Mertens, L. L. , 2012, “Imaging the Right Heart: The Use of Integrated Multimodality Imaging,” Eur. Heart J., 33(8), pp. 949–96010.1093/eurheartj/ehr490 [DOI] [PubMed] [Google Scholar]
- [23]. Pandya, B. , Kowalik, G. , Knight, D. , Tann, O. , Derrick, G. , and Muthurangu, V. , 2013, “Towards a More Comprehensive Assessment of Cardiovascular Fitness—Magnetic Resonance Augmented Cardiopulmonary Exercise Testing (MR-CPEX),” J. Cardiovasc. Magn. Reson., 15(Suppl 1), p. 58.10.1186/1532-429X-15-S1-P58.23806080 [Google Scholar]
- [24]. Gusso, S. , Salvador, C. , Hofman, P. , Cutfield, W. , Baldi, J. C. , Taberner, A. , and Nielsen, P. , 2012, “Design and Testing of an MRI-Compatible Cycle Ergometer for Non-Invasive Cardiac Assessments During Exercise,” Biomed. Eng. Online, 11(1), p. 13.10.1186/1475-925X-11-13 [DOI] [PMC free article] [PubMed] [Google Scholar]
- [25]. Tops, L. F. , Roest, A. A. , Lamb, H. J. , Vliegen, H. W. , Helbing, W. A. , van der Wall, E. E. , and de Roos, A. , 2005, “Intraatrial Repair of Transposition of the Great Arteries: Use of MR Imaging After Exercise to Evaluate Regional Systemic Right Ventricular Function,” Radiology, 237(3), pp. 861–86710.1148/radiol.2373041347 [DOI] [PubMed] [Google Scholar]
- [26]. Roest, A. A. , Kunz, P. , Lamb, H. J. , Helbing, W. A. , van der Wall, E. E. , and de Roos, A. , 2001, “Biventricular Response to Supine Physical Exercise in Young Adults Assessed With Ultrafast Magnetic Resonance Imaging,” Am. J. Cardiol., 87(5), pp. 601–60510.1016/S0002-9149(00)01438-7 [DOI] [PubMed] [Google Scholar]
- [27].Ergospect, 2008, “Cardiologic Module: Measuring the Cardiovascular System During Exercise,” Ergospect GmbH, Innsbruck, Austria, http://ergospect.com/products-detail-ergospect-medical-equipment,pid,3,bid,1285225342,lid,en,eid,1364308426.html
- [28].Ergospect, 2008, “Ergospect: Medical Technology,” Ergospect GmbH, Innsbruck, Austria, http://www.ergospect.com/products-detail-ergospect-medical-equipment,pid,3,bid,1285225342,lid,en,eid,1314176913.html
- [29]. Thompson, R. B. , and McVeigh, E. R. , 2004, “Flow-Gated Phase-Contrast MRI Using Radial Acquisitions,” Magn. Reson. Med.: Off. J. Soc. Magn. Reson. Med./Soc. Magn. Reson. Med., 52(3), pp. 598–60410.1002/mrm.20187 [DOI] [PMC free article] [PubMed] [Google Scholar]


