

Short abstract
We have investigated thermal operating characteristics of 13 commercially available cryotherapy units (CTUs) and their associated cooling pads using IR imaging. Quantitative examination of the temperature profiles from pad IR images shows diverse, nonuniform temperature distribution patterns. The extent of heterogeneity of the temperature fields was quantified via standard image analysis methods, including thresholding, spatial gradient diagrams, and frequency histogram distributions. A primary conclusion of this study is that it is a misnomer to characterize the thermal performance of a CTU and cooling pad combination in terms of a single therapeutic temperature.
Introduction
Cryotherapy is frequently prescribed following orthopedic surgeries and by physical therapists and athletic trainers to reduce inflammation, swelling, pain, secondary hypoxic injury, and bleeding and to allow early mobilization in both acute and chronic phases of soft tissue injury [1,2]. However, in contrast to its therapeutic benefits, cryotherapy also presents a risk factor for causing ischemic-induced injuries such as nerve palsy [3–5] and tissue necrosis [6,7]. Furthermore, no single thermal application cryotherapy protocol has been identified that provides an optimum risk/benefit ratio, resulting in a broad spectrum of cryotherapy practices reported in the literature [8]. Cryotherapy protocols are generally defined in terms of temperature and duration of application and may be run either continuously or with temporal modulation. Recommendations for the duration of application vary from minutes [9,10] to days [11–13]. It is claimed that skin temperature must drop below 13.6 °C (56.5 °F) to realize the analgesic effect of cryotherapy and that a 50% reduction in tissue metabolism requires tissue temperatures in the range of 10–11 °C (50–51.8 °F) [14]. Moreover, the ability of hemoglobin to release bound oxygen strongly relates to temperature, and below about 12 °C (53.6 °F), the residence time of blood flowing through capillaries is shorter than the time constant for oxygen dissociation [15,16]. This condition could result in the creation of tissue hypoxia that may also be exacerbated by ischemia. In summary, the level of temperature produced by a CTU system may affect multiple aspects of the procedure outcome.
The components of a CTU system typically consist of an insulated chest that is filled with ice and water, a submersible pump, a cooling pad that is applied to the treatment area, and insulated tubing that connects the pump to the pad in a closed ice water circulation loop. The cooling pad generally embodies a flexible polymeric bladder with molded conduits through which water is pumped via inlet and outlet ports. Cooling pads employ distinct patterns for directing water flow through the pad. These flow patterns are reflected on the pad surface as areas with higher and lower temperatures due to the low thermal conductivity of the pads providing only minimal lateral heat transfer.
Manufacturers provide user instructions that commonly relate to a target operating temperature but include a paucity of specific implementation guidelines. Alternatively, the responsibility for defining a thermal treatment protocol may be assigned to health care providers. The following are examples of temperature-related instructions provided with CTUs. DeRoyal recommends a target temperature for water flowing to the pad within the range of 7.2–15.6 °C (45–60 °F) [17], with specific operating temperatures of 7.2 ± 2.8 °C (45 ± 5 °F) and 6.1–18.3 °C (43–65 °F) for models T505 and T600 [18], respectively. Game Ready [19] claims that the greatest benefit from cryotherapy takes place at 4.5–15.5 °C (40–60 °F). Bledsoe [20,21] states that their devices are designed for the temperature of water circulating within the pad to remain at or above 4.4 °C (40 °F) with other specific recommendations for particular treatment sites, the highest being 10–15 °C (50–59 °F) for the ankle and the lowest 7–12 °C (44.6–53.6 °F) for the back, knee, and shoulder [21]. DonJoy warns against using their CTU with a water temperature lower than 5 °C (40 °F) [22]. Breg specifies different temperature ranges depending on the protocol. The temperature range of cooling water for continuous long term operation is 7.2 °C–12.8 °C (45 °F–55 °F), and the temperature may be below 7.2 °C (45 °F) for intermittent exposures of 20 min or less [23]. EBIce only stipulates that a licensed health care practitioner must prescribe the appropriate treatment details [24] while warning that cooling pads may have wide temperature variation and that cold spots create the potential for tissue damage, nerve palsy, or other vasospastic conditions while hot spots may create areas of lessened therapeutic effectiveness.
The therapeutic effect of cryotherapy is temperature driven, and our experiments show that temperature may vary greatly over a single pad and also among different pad/CTU systems. The goal of this study is to measure and characterize quantitatively the two dimensional temperature profiles produced on the surface of various cooling pads when exposed to ambient air during normal CTU operating protocols. Our hypothesis is that temperature variation exists across the surface of cryotherapy cooling pad and that this variation occurs as a function of the water flow pattern through the pad.
Materials and Methods
Thirteen commercially marketed CTUs were evaluated as follows: Breg Polar Care 300, 500, and 500 Lite (Breg, Carlsbad, CA); DeRoyal T505 and T600 (DeRoyal Industries, Powell, TN); Game Ready (Game Ready, Concord, CA); Artic Ice System (Pain Management Technologies, Akron, OH); DonJoy IceMan (DonJoy Global, Vista, CA); EBIce model 10D (EBI, LLC, Parsippany, NJ); Össur Cold Rush (Össur Americas, Foothill Ranch, CA); and Bledsoe bMini, Cold Control, and bPro (Bledsoe Brace Systems, Grand Prairie, TX). Associated CTU brand-specific pads commonly used for the knee were tested. Pads were assigned unique identifier codes based on their manufacturer, intended application site, and/or geometric shapes. Four-letter identifier acronyms applied for reporting results in this study are knee pads for Polar Care 300, 500, and 500 Lite; Game Ready; Arctic Ice; Össur; and Bledsoe Cold Control, bMini, and bPro; DeRoyal T505 and T600 U-shaped pad and universal pad; DonJoy McGuire pad and universal pad; and EBIce model 10D U-shaped pad, square pad, and two-winged “butterfly” pad. Table 1 presents a listing of identifier codes for the pad/CTU combinations.
Table 1.
Cooling pad/CTU combinations tested, the unique identifier codes, and unique operational characteristics. The last letter of the acronym defines the pad type. (N = universal, B = butterfly, U = U-shaped, S = square, and M = McGuire.)
| Device | Pad type | Code | Flow rate ±12.5 (cc/min) | Water flow function | Feedback control | Compression |
|---|---|---|---|---|---|---|
| Arctic Ice | Universal | AION | 1200 | Continuous | None | None |
| EBIce model 10 D | Butterfly | EBOB | 1050 | Duty cycle is controlled with an analog dial | None | None |
| Square | EBOS | 1050 | ||||
| U-Shape | EBOU | 1125 | ||||
| Bledsoe Cold Control | Universal | BLCN | 1300 | Analog control of flow rate | None | None |
| 1425 | ||||||
| 1400 | ||||||
| Bledsoe bMini | Universal | BLMN | 1300 | Continuous | None | None |
| Bledsoe bPro | Universal | BLPN | Analog control of flow rate | None | None | |
| DeRoyal T505 | Universal | DRFN | 225–400 (5.1–6.1 °C) | Duty cycle depends on temperature of water returning to CTU | Yes | None |
| U-Shape | DRFU | |||||
| DeRoyal T600 | Universal | DRSN | 675–825 (7.2–8.3 °C) | Similar to DeRoyal T505 | Yes | None |
| U-Shape | DRSU | |||||
| Össur Cold Rush | Universal | OSON | 400 | Analog control of flow rate | None | None |
| 650 | ||||||
| 775 | ||||||
| Game Ready | Universal | GRON | 425 | Analog control of flow rate | None | Yes |
| 450 | ||||||
| 425 | ||||||
| Polar Care 500 | Universal | PCFN | Analog control of flow rate | None | None | |
| Polar Care 500 Lite | Universal | PCLN | Continuous | None | None | |
| Polar Care 300 | Universal | PCTN | Continuous | None | None | |
| DonJoy IceMan | Universal | DJON | 550 | Continuous with analog dial | None | None |
| McGuire | DJOM |
Each CTU and cooling pad combination was evaluated in a dedicated trial using a common protocol that followed the manufacturer's instructions. The cooling pad was connected to the CTU, purged of air, laid flat on a carpeted substrate with the therapeutic surface designed to face the skin oriented upward, and ice water circulation through the pad activated. An infrared camera was mounted on a tripod directly above the pad at a distance adjusted to ensure the field of view encompassed the full pad area. The trials were conducted in a 35 m2 laboratory room with air temperature and relative humidity at approximately 23 °C and 50%, respectively. Care was taken to ensure that no ambient water vapor condensation was collected on the surface of the cooling pad during IR temperature measurements that would confound its thermal emissivity properties.
Infrared temperature images of subject pad surfaces were obtained with either a FLIR A325sc thermal camera with 320 × 240 pixel resolution and ± 2 °C thermal accuracy (FLIR Systems, Inc., Boston, MA) or a FLIR T650sc with 640 × 480 pixel resolution and ±1 °C thermal accuracy (FLIR Systems, Inc., Boston, MA) that could capture simultaneous infrared and optical images of pad surfaces (the latter system was acquired partway through the study). flir examinir software (FLIR Systems, Inc., Boston, MA) was used for initial image processing and analysis of infrared data. The thermal radiation emissivity of the pad material was measured using the calculator function in examinir for multiple isothermal regions on the surface at room temperature. The emissivity was applied in the software to extract temperature values from the thermal images. Further image analysis calculations were performed with matlab (Mathworks, Inc., Natick, MA).
24 AWG type T thermocouples (Omega Engineering, Stamford, CT) were applied to monitor and record ambient air and pad surface temperatures in conjunction with National Instruments (NI) input modules NI 9211 and 9213 and NI DAQ 9172 and 9174 and LabVIEW signalexpress software (National Instruments Corp., Austin, TX). A handheld IR thermometer (Fluke 62Max, ±1 °C, Fluke Corporation, Everett, WA) was used for further confirmation of pad surface temperatures. The ice water flow rate was measured for each CTU and pad combination via an in-line flow meter (Key Instruments, Trevose, PA) positioned between the outlet from the ice chest and the pad inlet port.
Trials were conducted by activating the CTU to circulate ice water through the cooling pad. Thermal images of the surface were acquired after the pad reached a steady thermal state, which generally required about 10 min of operation. Some CTUs provided an option for adjusting the water temperature. For these systems, an initial steady state was produced at the warmest setting, the thermal data were recorded, and this process was repeated at incrementally lower settings until the lowest temperature was reached. For those devices with intermittent flow, the thermal images were analyzed at the completion of the on-phase of the duty cycle after steady state was achieved.
Thermal images were transferred from the camera to a host computer where they were subjected to various enhancement and analysis algorithms to quantify and characterize the magnitude and distribution of the temperature variation across the cooling pad surface. The first processing step was to establish a threshold temperature value in order to isolate the pad area from the warmer background region of an image. Given that the highest lateral temperature gradient in an image occurred among the pixels at the pad edge, a spatial temperature gradient matrix map was created to identify the boundary of the pad. The gradient matrix was generated in the x, y image plane and was calculated as the root sum square of the difference between adjacent x and y temperature values. The temperature of the pixel with the highest gradient magnitude in the pad edge region was set as the threshold value to isolate pad data and filter out background data from the initial image. This algorithm showed a very close correspondence between the visual and threshold identified boundaries of the pad. The thresholding method always successfully removed the background completely.
A histogram was created to display the pixel occurrence frequencies of specific temperatures on the pad surface along with the mean, median, and standard deviation. A figure of merit was defined to quantify the extent of nonuniformity in pad temperature by removing the outer 10%, 1/e2%, or 1/e% of the frequency bins from the histogram (defining the middle 90%, 86.5%, and 63.2% of occurrence frequencies, respectively). The range of the remaining bins was defined as a measure of the breadth of temperatures occurring on any given pad. Box plots were calculated and drawn for temperature variation statistics, providing the inter quartile range (IQR) as an additional metric for temperature variations on the pad. Important thermal features of the IR image were visualized by plots of temperature contours, spatial temperature gradient magnitude maps, and the discrete Laplacian operator (second derivative set to zero, representing an edge detection scheme). However, the Laplacian plots did not add any significant insight into the extent of pad surface temperature nonuniformity beyond that of the first order gradient magnitude and; therefore, are not included in the analysis presented here.
The various pads have unique shapes and sizes, and there may be a variety of pad configurations for any given CTU. The pads may be matched to the anatomy of the site of therapy and the dimensions of the treatment region. The therapeutically effective surface area of the pad depends on the pad shape as well as the outline of the treatment region. These factors are not constant among different clinical cases, and therefore, comparison of pad according to their sizes was not included in this analysis.
Results
Features of the CTU/pad combinations tested are listed in Table 1, including the measured water flow rate through the pad, method of control if it existed, and whether the CTU/pad was capable of simultaneous pneumatic compression of tissue in the thermal treatment area. Although most CTUs produce a constant flow rate of water, some provide intermittent flow via an adjustable duty cycle. For example, ice water flow to the cooling pad for the EBIce model 10D is regulated manually, whereas the DeRoyal T505 and T600 have a feedback control mechanism based on a comparison of the temperature of water returning from the pad to a set point value.
The optical and IR images in Fig. 1 for a universal cooling pad from Bledsoe (BLMN) and of an EBIce knee cooling pad (EBOB) illustrate contrasting temperature patterns that may be encountered. A pseudocolor bar for the IR images shows the range of temperatures on the subject pad, with the extreme values denoted numerically. By casual visual inspection, the Bledsoe Universal pad appears to be more thermally uniform than the EBIce Butterfly pad. In both IR images, there is a thermal halo effect surrounding the pad owing to lateral cooling of the underlying carpet substrate. This phenomenon is more obvious for the Bledsoe pad than the EBIce pad due to the former's greater thermal homogeneity and, perhaps, a lower level of thermal insulation on the back of the pad.
Fig. 1.
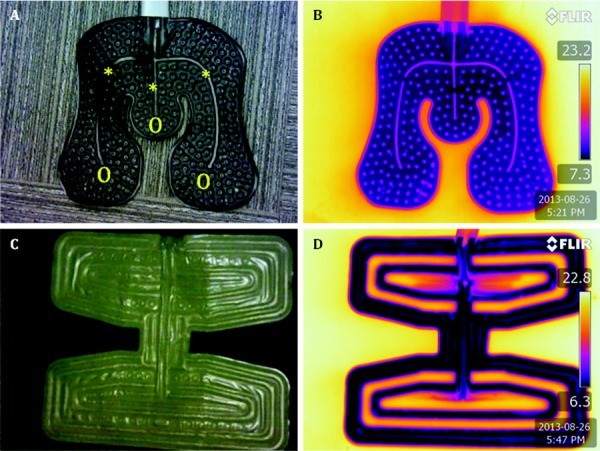
Optical (a) and (c) and IR (b) and (d) images of Bledsoe Universal (a) and (b) and EBIce model 10D butterfly pads (c) and (d). The symbols * and O in (a) demark alternate parallel water flow pathways.
Table 2 presents a summary of the ranges of steady state spatial temperature distributions measured on the various subject cooling pads. These data include the lowest, highest, average, and standard deviation of the local temperatures, plus the minimum, maximum, average, standard deviation, and IQR of the temperature ranges. The coldest temperature measured was 0.7 °C on the Össur pad, and the mean and standard deviation of all average temperatures was 6.8 ± 2.5 °C. Determination of the range of temperatures over the surface by the 10%, 1/e2%, and 1/e% methods (defining the middle 90%, 86.5%, and 63.2% of occurrence frequencies, respectively) provides a more insightful discrimination among pads (described later in the Results section). The highest value for IQR occurred on the EBIce butterfly pad (4.2 °C), and the lowest value for IQR occurred on the DonJoy universal pad (0.8 °C).
Table 2.
Aggregate thermal data of cooling pad surface temperature distributions for all trials
| Min | Max | Mean | |
|---|---|---|---|
| Average pad temperature | 2.6 | 10.9 | 6.8 ± 2.5 |
| Coldest temperature | 0.7 | 7.9 | 4.4 ± 2.4 |
| Warmest temperature | 11.1 | 17 | 14.5 ± 1.7 |
| Breadth (10% exclusion) | 2.0 | 9.1 | 5 ± 2.3 |
| Breadth (1/e2% exclusion) | 1.7 | 8.2 | 4.2 ± 2.0 |
| Breadth (1/e% exclusion) | 0.5 | 5.3 | 1.8 ± 1.3 |
| IQR | 0.8 | 4.2 | 1.9 ± 1.2 |
Figure 2 presents temperature contours and the temperature gradient map for the EBIce butterfly pad. In the IR image, the temperature of the background region was set to the threshold value to increase the visible thermal resolution on the pad. The pad temperature covers the range of 4–14 °C, with a significant portion of the surface above 12 °C. The temperatures of areas that directly overlay water flow channels are 4–7 °C. Regions on the pad having the largest magnitude of lateral spatial temperature gradient are located primarily along the outer margin on the edges of water flow pathways.
Fig. 2.
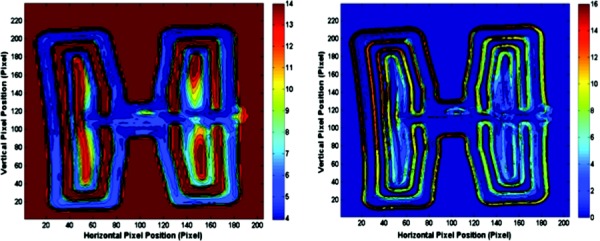
IR image of EBIce model 10D butterfly pad (left) and its gradient magnitude map (right). The color bars show temperatures (°C) for the IR image and (°C/pixel) for the gradient map.
Histograms were created to provide a graphical representation of the occurrence frequency of specific temperatures on the surface of each pad tested. Two exemplar histograms are shown in Fig. 3. The EBIce butterfly pad histogram exhibits a skewed distribution with a relatively large degree of thermal nonuniformity. The Bledsoe Cold Control pad also demonstrates a skewed distribution, but with a significantly more homogeneous pattern. The top, middle, and bottom histograms indicate the temperature ranges for the outer 10%, 1/e%, and 1/e2% of values. Note that the vertical frequency scales are different for the two systems, reflecting the difference in relative tightness of the two temperature distributions.
Fig. 3.
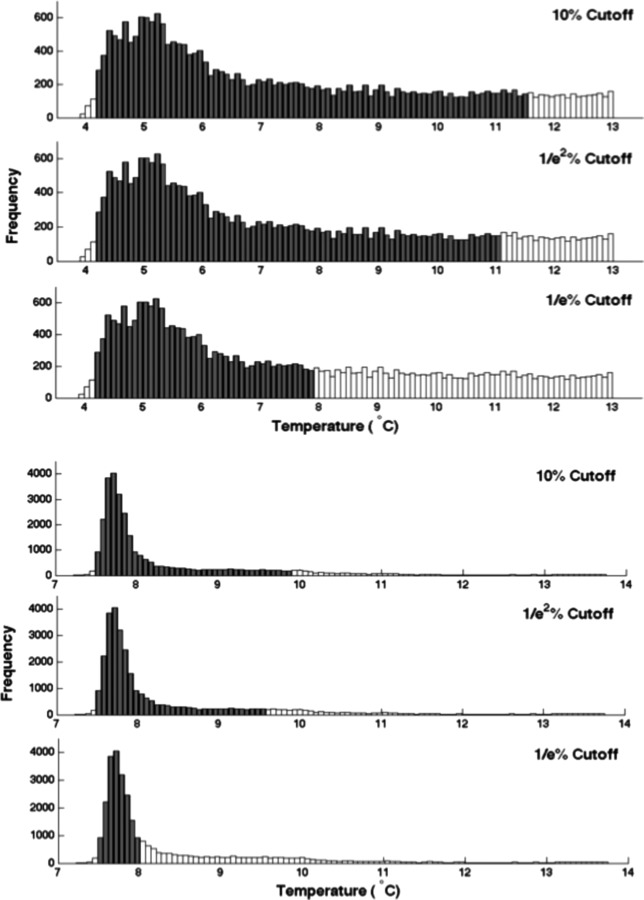
Histograms of pad temperature distributions with the outer 10%, 1/e2%, and 1/e% of values excluded as indicated by unfilled bars. Upper panels are for EBIce model 10D butterfly pad, and lower panels are for Bledsoe Cold Control universal pad.
Figure 4 shows an explicit contrast between the relative spread of temperatures for the EBIce butterfly and Bledsoe Cold Control universal pads. The 10% breadth margins for both pads are marked on their corresponding plots. This representation of the data clearly illustrates the very large differential in variance of temperatures that may occur over two different pad surfaces. Data presented in this format enable a graphic assessment of the relative temperature heterogeneity among multiple CTU/pad systems.
Fig. 4.
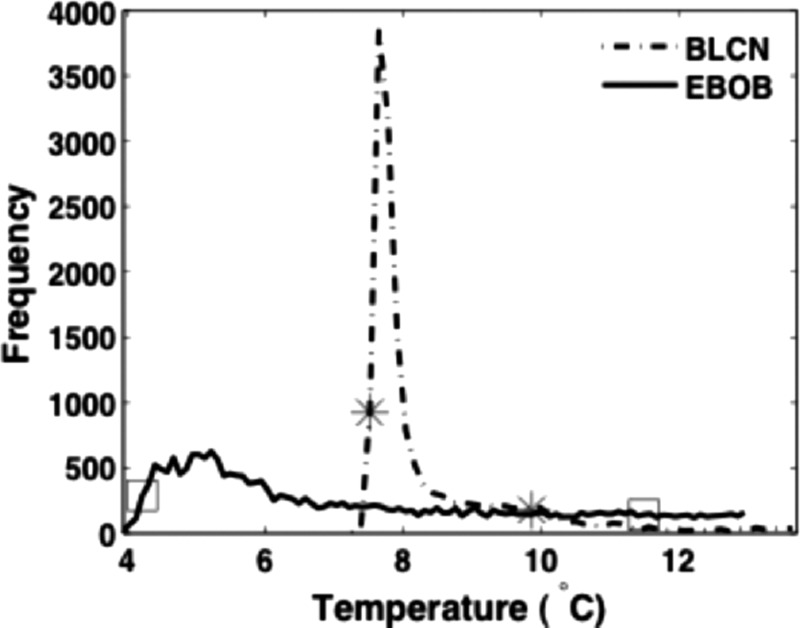
Direct comparison of the relative spread of temperature distributions for the Bledsoe Cold Control knee pad and EBIce model 10D butterfly pad. The stars and squares mark the 10% breadth limits for the two pads.
Another differentiating feature among the various CTU/pad combinations is whether the ice water flow is continuous or intermittent, the latter of which will produce oscillating pad temperatures even after a steady operating state is reached. Figure 5 presents histograms of EBIce Model 10D butterfly pad (EBOB) temperatures at the beginning and end of one water flow cycle. The overall temperature drops during active water flow and increases to a bimodal distribution when the water flow is off, reflecting the pattern of passive heat transfer with the environment.
Fig. 5.

Change in the temperature distribution on the EBIce butterfly pad at the beginning and end of the gated-on portion of an intermittent flow duty cycle with the controller adjusted to the coldest setting
Figure 6 presents box plots of the pad temperature statistics for all devices tested (see Table 1 for identifier codes). Each box plot displays the maximum, minimum, first and third quartiles, and median of pad temperatures for one CTU/pad operation. These data show that the EBIce model 10D butterfly pad (EBOB) and DeRoyalT505 universal pad (DRFU) have the most nonuniform temperatures, with IQRs of about 4 °C. In contrast, the Bledsoe Cold Control (BLCN) and DonJoy IceMan (DJON) have an IQR of only 0.8 °C.
Fig. 6.
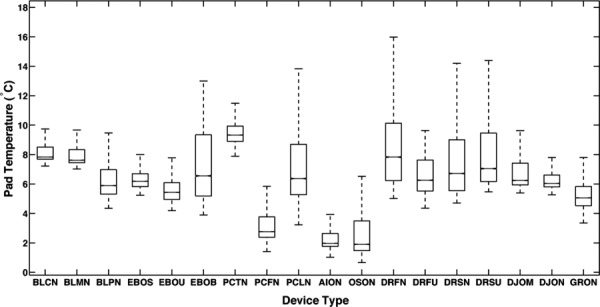
Box plots of pad temperature distribution statics for the indicated CTU/pad combinations
Some CTUs offer a feature for the user to adjust the intensity of cooling provided by the system. The mechanism for implementing this feature involves modulation of the water flow through the cooling pad by one of various methods. The question arises as the extent to which adjustment of the CTU control actually changes the temperatures produced on the cooling pad. CTUs having this feature were operated at high, intermediate, and low settings, and the resulting temperature distributions were measured on their cooling pads. Data from these trials are presented in Fig. 7. In general, CTUs with a cooling adjustment at best had a nonlinear relationship between the controller setting and the pad temperature, and in some cases, the controller exerted no perceptible effect on pad temperatures. For example, the Össur Cold Rush (OSON) and Polar Care 500 (PCFN) CTUs manifest no change in pad temperatures for controller adjustments across their entire range. The BLCN temperature decreased by more than 5 °C between the warmest and intermediate settings, but there was no significant change in pad temperature for colder settings. The existence of the control adjustment sends an implicit message to the user that altering the setting will produce a significant change in thermal performance, whereas data show that not to be the case for many systems.
Fig. 7.
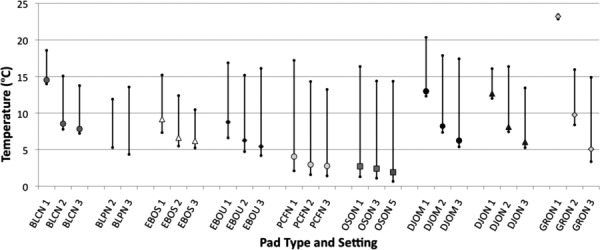
The effect of adjusting the user-controlled temperature setting on measured pad temperature ranges. The plots show the low, median, and high values. Data are grouped by device type, with right and left plots for the designated coldest and warmest settings, respectively. Central plots denote intermediate control settings.
Discussion
Over the course of our extensive past testing of CTUs, we have consistently observed significant lateral temperature variations on the skin underlying a cooling pad. These measurements were obtained from multiple simultaneous thermocouple readouts or by pulling a single thermocouple laterally on the skin under a cooling pad. However, this temperature data were obtained mainly on an anecdotal basis, without the benefit of continuous two dimensional temperature maps afforded by IR imaging. Since cryotherapy is driven by the temperature applied to the skin surface, the present study was undertaken to measure how large the lateral thermal differences may be on the cooling pad surface of selected CTU systems. The drawback in using IR imaging is that it is not possible to obtain continuous reading of skin temperatures. However, the cooling pad defines the thermal boundary condition applied to the skin during cryotherapy, and consequently the IR images do provide information relevant to understanding the physiological response to application of a cryotherapy system.
We have observed that in addition to the thermal boundary conditions imposed by a cooling pad, local features of anatomical structure and circulatory function may contribute to variations in skin temperature at a cryotherapy site. Therefore, this study was explicitly confined to only measuring the potential effects of the cooling device in defining the thermal boundary conditions that may be applied to the skin surface during cryotherapy.
18 different CTU and cooling pad combinations were evaluated with an infrared camera to determine the extent to which they were able to create a uniform temperature field for cryotherapy. As anticipated, all systems produced thermal profiles that varied by location on the pad surface. Since cooling is caused via the circulation of ice water through channels integral to the pad, an inherent consequence of this style of cooling system is that there will be thermal dead spaces interspersed between the channels. Cooling pads are fabricated from flexible polymeric sheets that have relatively low thermal conductivity. Therefore, the lateral distribution of the cooling effect of ice water flowing through the pads is limited. The thermal images and temperature gradient maps quantify this effect for the various systems.
Thermal distinctions among CTU/pad systems appear to be primarily due to the design of the water flow pathways through individual pads and the method by which a CTU pumps water through a pad. The temperature variation across a single pad varied greatly from one pad to another. A comparison of the temperature variation magnitude amongst different pads showed a maximum ratio of about 5 to 1. Thus, these unique design features can be quite substantial.
Ultimately, the utility of cryotherapy relates to its ability to improve the healing of soft tissue injuries, and this role has long been acknowledged. There is vast empirical documentation and experience supporting the value of cooling injured tissues, but there is far from a complete quantitative picture of the underlying mechanisms of action. It is recognized that a key action of cryotherapy is to reduce the rate of blood flow to the target tissue as the temperature is lowered. The sensitivity of the physiological response to an applied cooling temperature as portrayed in terms of modulation in skin blood perfusion has been measured in experiments parallel to those described in this paper and is reported in other publications [25–27]. The coupling between an applied therapeutic temperature and the changes produced in skin blood flow is a key component dictating the efficacy of cryotherapy regimens. The data presented herein for the thermal qualities of cryotherapy devices are complementary to designing cooling therapies to elicit desired physiological responses to improve tissue healing processes.
Conclusions
CTUs are widely applied to provide localized therapeutic cooling for soft tissue injuries, and their thermal performance is frequently expressed in terms of a single representative temperature. This study has documented that all CTU cooling pads instead create a finite range of temperatures that will be transmitted to the skin. Furthermore, there are substantial differences in the magnitude, range, and distribution of temperatures over the cooling pad surface among the various CTU/pad combinations tested. As a result, use of a single value to represent the general applied therapeutic temperature is not justified. A more useful characterization of the thermal performance of the CTU/pad combination would be the minimum temperature and the range of temperatures produced on the pad. Although some devices are equipped with a user-controlled adjustment for the pad temperature, often the resulting overall effect on thermal performance of the device is far less than the inherent spatial variations in temperature across the cooling pad surface. In summary, care and insight should be exercised in prescribing the user protocols of CTUs based on nominal thermal performance specifications, based on an awareness of the temperature producing characteristics of a particular device.
Acknowledgment
This research was sponsored by National Science Foundation Grant Nos. CBET 0828131, CBET 096998, and CBET 1250659, National Institutes of Health Grant No. R01 EB015522, and the Robert and Prudie Leibrock Professorship in Engineering at the University of Texas at Austin.
Conflict of Interest Disclosure
A patent application has been submitted by Dr. Khoshnevis and Dr. Diller to the United States Patent and Trademark Office under the title Improved Cryotherapy Devices and Methods to Limit Ischemic Injury Side Effects. Ownership rights to this patent reside with The University of Texas System. Dr. Diller has served as an expert witness for both plaintiff and defendant counsel since 2000 in numerous legal cases regarding the safety and design of existing cryotherapy devices.
Contributor Information
Sepideh Khoshnevis, Mem. ASME, Department of Biomedical Engineering, , 107 West Dean Keeton Street, , The University of Texas at Austin, , Austin, TX 78712-1081 , e-mail: sepideh@utexas.edu .
Jennifer E. Nordhauser, Department of Biomedical Engineering, , 107 West Dean Keeton Street, , The University of Texas at Austin, , Austin, TX 78712-1081 , e-mail: jnordhauser@gmail.com
Natalie K. Craik, Department of Biomedical Engineering, , Baylor College of Medicine, , 1 Baylor Plaza, , Houston, TX 77030 , e-mail: gnat.craik@gmail.com
Kenneth R. Diller, Fellow ASME , Department of Biomedical Engineering, , 107 West Dean Keeton Street, , The University of Texas at Austin, , Austin, TX 78712-1081 , e-mail: kdiller@mail.utexas.edu .
References
- [1]. Knight, K. L. , 1995, Cryotherapy in Sport Injury Management, Human Kinetics, Champaign, IL. [Google Scholar]
- [2]. Swenson, C. , Sward, L. , and Karlsson, J. , 1996, “Cryotherapy in Sports Medicine,” Scand. J. Med. Sci. Sports, 6(4), pp. 193–200. 10.1111/j.1600-0838.1996.tb00090.x [DOI] [PubMed] [Google Scholar]
- [3]. Babwah, T. , 2011, “Common Peroneal Neuropathy Related to Cryotherapy and Compression in a Footballer,” Res. Sports Med. Print, 19(1), pp. 66–71. 10.1080/15438627.2011.536043 [DOI] [PubMed] [Google Scholar]
- [4]. Collins, K. , Storey, M. , and Peterson, K. , 1986, “Peroneal Nerve Palsy After Cryotherapy,” Physician Sports Med., 14(5), pp. 105–108. 10.1177/036354658601400201 [DOI] [PubMed] [Google Scholar]
- [5]. Drez, D. , Faust, D. C. , and Evans, J. P. , 1981, “Cryotherapy and Nerve Palsy,” Am. J. Sports Med., 9(4), pp. 256–257. 10.1177/036354658100900414 [DOI] [PubMed] [Google Scholar]
- [6]. Brown, W. , and Hahn, D. , 2009, “Frostbite of the Feet After Cryotherapy: A Report of Two Cases,” J. Foot Ankle Surg., 48(5), pp. 577–580. 10.1053/j.jfas.2009.06.003 [DOI] [PubMed] [Google Scholar]
- [7]. Lee, C. K. , Pardun, J. , Buntic, R. , Kiehn, M. , Brooks, D. , and Buncke, H. J. , 2007, “Severe Frostbite of the Knees After Cryotherapy,” Orthopedics, 30(1), pp. 63–64. [DOI] [PubMed] [Google Scholar]
- [8]. MacAuley, D. , 2001, “Do Textbooks Agree on Their Advice on Ice?,” Clin. J. Sport Med., 11(2), pp. 67–72. 10.1097/00042752-200104000-00001 [DOI] [PubMed] [Google Scholar]
- [9]. Bleakley, C. M. , McDonough, S. M. , and MacAuley, D. C. , 2006, “Cryotherapy for Acute Ankle Sprains: A Randomised Controlled Study of Two Different Icing Protocols,” Br. J. Sports Med., 40(8), pp. 700–705. 10.1136/bjsm.2006.025932 [DOI] [PMC free article] [PubMed] [Google Scholar]
- [10]. Meeusen, R. , and Lievens, P. , 1986, “The Use of Cryotherapy in Sports Injuries,” Sports Med., 3(6), pp. 398–414. 10.2165/00007256-198603060-00002 [DOI] [PubMed] [Google Scholar]
- [11]. Singh, H. , Osbahr, D. , Holovacs, T. , Cawley, P. , and Speer, K. , 2001, “The Efficacy of Continuous Cryotherapy on the Postoperative Shoulder: A Prospective, Randomized Investigation,” J. Shoulder Elbow Surg., 10(6), pp. 522–525. 10.1067/mse.2001.118415 [DOI] [PubMed] [Google Scholar]
- [12]. Barber, F. A. , McGuire, D. A. , and Click, S. , 1998, “Continuous-Flow Cold Therapy for Outpatient Anterior Cruciate Ligament Reconstruction,” Arthrosc.: J. Arthrosc. Relat. Surg., 14(2), pp. 130–135. 10.1016/S0749-8063(98)70030-1 [DOI] [PubMed] [Google Scholar]
- [13]. Cohn, B. , Draeger, R. , and Jackson, D. , 1989, “The Effects of Cold Therapy in the Postoperative Management of Pain in Patients Undergoing Anterior Cruciate Ligament Reconstruction,” Am. J. Sports Med., 17(3), pp. 344–349. 10.1177/036354658901700306 [DOI] [PubMed] [Google Scholar]
- [14]. Chesterton, L. S. , Foster, N. E. , and Ross, L. , 2002, “Skin Temperature Response to Cryotherapy,” Arch. Phys. Med. Rehabil., 83(4), pp. 543–549. 10.1053/apmr.2002.30926 [DOI] [PubMed] [Google Scholar]
- [15]. Anson, J. A. , McCormick, J. , and Zambramski, J. M. , 1992, “Oxygen Dissociation Characteristics of Hemoglobin and Blood Substitute in Relation to Temperature,” Barrow Neurol. Inst. Q., 8, pp. 35–42. [Google Scholar]
- [16]. Lawson, W. H. , Holland R. a. B., and Forster R. E., 1965, “ Effect of Temperature on Deoxygenation Rate of Human Red Cells,” J. Appl. Physiol., 20(5), pp. 912–918. [DOI] [PubMed] [Google Scholar]
- [17]. “DeRoyal® Hot/Cold Therapy Unit,” Retrieved Oct. 25, 2013, http://www.deroyal.com/medicalproducts/orthopedics/product.aspx?id=pc-temptherapy-hotcoldtherunit
- [18]. “User Guide T505 Cold Therapy Unit,” Retrieved Oct. 24, 2013, http://www.deroyal.com/filedisplay.aspx?id=571
- [19]. “GrPro 2.1 Control Unit User's Manual,” Retrieved Oct. 24, 2013, http://www.gameready.com/wp-content/uploads/2012/10/GR21-CU-UM-703758-F-WEB-English-050713.pdf
- [20]. “Bledsoe Cold Control,” Retrieved Oct. 24, 2013, http://www.bledsoebrace.com/products/cold-control/
- [21]. “Bledsoe bMini/bPRO,” Retrieved Oct. 24, 2013, http://www.bledsoebrace.com/wp-content/uploads/2012/11/bMinibPRO_AIs_CP020246_RevB.pdf
- [22]. “Donjoy Printed Instructions,” DJO, LLC, Vista, CA.
- [23]. “Cold Therapy Protocol,” Retrieved Nov. 10, 2013, http://www.breg.com/sites/default/files/downloads/prod-files/Kodiak-Cube-Glacier-IFU-1_00372B.pdf
- [24]. “EBI Instruction Sheet,” EBI, LLC, Parsippany, NJ.
- [25]. Khoshnevis, S. , Craik, N. K. , and Diller, K. R. , 2014, “Experimental Characterization of the Domains of Coupling and Uncoupling Between Surface Temperature and Skin Blood Flow,” Int. J. Transport Phenom. (in press). [Google Scholar]
- [26]. Khoshnevis, S. , Craik, N. K. , and Diller, K. R. , 2014, “Cold-Induced Vasoconstriction May Persist Long After Cooling Ends: An Evaluation of Multiple Cryotherapy Units,” Knee Surg, Sports Traumatol, Arthrosc, (in press). 10.1007/s00167-014-2911-y [DOI] [PMC free article] [PubMed] [Google Scholar]
- [27]. Khoshnevis, S. , Craik, N. K. , Brother, R. M. , and Diller, K. R. , 2014, “Persistent Vasoconstriction After Cutaneous Cooling: Hysteresis Between Skin Temperature and Blood Perfusion,” J. Appl. Physiol. (unpublished). [DOI] [PMC free article] [PubMed] [Google Scholar]