

Abstract
Purpose
The relationship between FF determined based on multiple TE, unipolar GE images and 1H-MRS was evaluated using different models for fat-water decomposition, signal-to-noise ratios (SNR), and excitation flip angles.
Methods
A combination of single voxel proton spectroscopy (1H-MRS) and gradient echo (GE) imaging was used to determine muscle fat fractions (FF) in both normal and dystrophic muscles. In order to cover a large range of FF, the soleus and vastus lateralis muscles of 22 unaffected control (CON), 16 subjects with Collagen VI (COL6), and 71 subjects with Duchenne muscular dystrophy (DMD) were studied. 1H-MRS based FF were corrected for the increased muscle 1H2O T1 and T2 values observed in dystrophic muscles.
Results
Excellent agreement was found between co-registered FF derived from GE images fit to a multipeak model with noise bias correction and the relaxation corrected 1H-MRS FF (y= 0.93×+0.003; R2=0.96) across the full range of FF. Relaxation corrected 1H-MRS FF and imaging based FF were significantly elevated (p<0.01) in both COL6 and DMD muscles.
Conclusion
FF, T2, and T1 were all sensitive to muscle involvement in dystrophic muscle. MRI offered an additional advantage over single voxel spectroscopy in that the tissue heterogeneity in FF could be readily determined.
Introduction
The muscular dystrophies are a diverse set of genetic muscle diseases characterized by the absence or reduced expression of proteins essential for muscle structural integrity and function. In Duchenne muscular dystrophy (DMD), a mutation in the X-linked dystrophin gene (1) causes the absence or partial dystrophin expression, a membrane-associated cytoskeletal protein that maintains sarcolemmal integrity. DMD has a prevalence of 1 in 3,600–6,000 male births (2,3), and is characterized by progressive muscle weakness, loss of functional capabilities, and early death (4). Congenital muscular dystrophy results from dominant and recessive mutations in any of the three genes encoding for the subunits of the collagen VI protein (COL6A1, COL6A2, and COL6A3), an extracellular matrix protein found in the basal lamina (5,6). The associated muscle collagen VI disorders (COL6) present a spectrum of severity, from the mild phenotype Bethlem myopathy to the severe Ullrich congenital muscular dystrophy, now recognized as one of the most common forms of congenital muscular dystrophy worldwide (6). Hallmarks of the disease are joint hyperlaxity and contractures of the interphalangeal joints of the fingers, elbows and ankles. There is currently no cure for either form of muscular dystrophy, but recent preclinical and early clinical trials have indicated that adeno-associated gene delivery, small molecule drugs, and exon skipping compounds all offer great promise (7,8).
A feature shared by these diseases is the progressive loss of muscle tissue accompanied by the infiltration of fatty and fibrotic tissue. Accordingly, evaluation of intramuscular fat content has generated considerable interest as it represents a biomarker of the disease progression (9,10), and a potential outcome measure for the assessment of treatments in clinical trials. Due to its noninvasive nature and ability to distinguish between healthy muscle tissue and fat in dystrophic muscle, MR is particularly attractive. MR imaging of dystrophic muscle is made more challenging by the extreme signal heterogeneity that occurs in the chronically damaged and regenerating dystrophic muscle. T1 and T2 weighted imaging can provide a qualitative (11,12) and quantitative (13,14) assessment of muscle involvement, and the pattern of tissue involvement has been useful in muscle clinical evaluation. MR also offers a direct and quantitative alternative for the determination of lipid content through the use of magnetic resonance spectroscopy (MRS).
Localized 1H-MRS is the gold standard to noninvasively measure muscle composition, and relaxation properties of individual metabolites, and has recently been used in a number of clinical studies (15,16). Early 1H-MRS observations by (17) showed that dystrophic muscle could be characterized by increased lipid content. Recently, not only have single voxel 1H-MRS methods revealed differences in lipid composition between control (CON) and DMD, but the total lipid content in DMD was correlated with clinical measures of muscle dysfunction (15). However, 1H-MRS has limited spatial resolution and coverage, and requires repeated measurement throughout the volume of interest or time consuming multi-voxel acquisitions in order to obtain information from the majority of a muscle of interest.
Chemical shift-based water-fat separation MR imaging (18) may offer an alternative method. MRI can provide high-resolution three-dimensional imaging of muscle fat composition. Two and three point Dixon imaging have been shown to directly correlate to fat levels based on muscle biopsy (19) and to clinical severity of the disease in DMD (20) and in myotonic dystrophy (21). Calibrated phantoms have provided support for the accuracy of the fat fraction (FF) (22–25) and validation studies have been performed in liver to directly compare measurements made by chemical shift-based imaging to the corresponding standard 1H-MRS measurements (24,26,27). More recently, Fischer et al 2012 (28) found good agreement between single voxel MRS and three-dimensional dual gradient-echo in the lower back muscles. However, to the best of our knowledge, validation in diseased skeletal muscle has not been investigated.
Measuring fat composition in muscle tissue presents several potential challenges to quantitative imaging. Different models have been proposed to take into account the spectral complexity of fat and other confounding factors during fat and water separation algorithms such as the difference in T1 and T2*s and chemical composition for fat and muscle (28–33). This may be of particular importance in muscular dystrophies, as the pathophysiological changes might alter tissue relaxation properties (13,34,35). In addition, low signal to noise images have been suggested to affect the accuracy of the results, especially when one of the species is predominant (i.e. low fat fraction, low water fraction) (36).
Therefore, the goal of this work was to evaluate the ability of chemical shift-based MR imaging to quantitatively assess fat fraction in dystrophic muscles. We studied the combined influence of the model used for fat/water spectral decomposition, flip angle, signal-to-noise ratio, T2, and T1 variations on the calculated fat fraction in DMD, COL6 and control muscles. This was achieved through the use of different models for fat/water separation and comparison with relaxation corrected localized 1H-MRS measures of fat fraction from the soleus (SOL) and vastus lateralis (VL) muscles.
Methods
Subjects
MR scans of the upper and lower leg muscles were acquired in unaffected volunteers (CON, n=22, age=18.0±12.6 yrs, range=5.5–44.6 yrs, 4 females, 18 males), subjects with confirmed congenital muscular dystrophy (COL6, n=16, age=22.9±17.2 yrs, range=5.9–55.3 yrs, 4 female, 12 males) and boys with Duchenne muscular dystrophy (DMD, n=71, age=9.3±2.3 yrs, range=5.3–14.8 yrs, all males). A subset of 32 subjects (CON: n=6, DMD: n=26) was examined on the following day in order to evaluate day-to-day reliability in imaging and MRS FF. All COL6 subjects were previously diagnosed with CMD types Ullrich, Bethlem or intermediate phenotypes based on 1) typical clinical features with onset of symptoms at birth or later and 2) abnormal collagen VI expression, as determined by immunostain on muscle biopsy sections and/or dermal fibroblast culture and/or DNA confirmation of a collagen VI mutation in either COL6A1, COL6A2 and COL6A3. All DMD subjects were previously diagnosed with DMD based on the absence of dystrophin by immunostaining on muscle biopsy sections and, western blots, or by DNA confirmation. The study was approved by the Institutional Review Board of the University of Florida, and an informed consent was obtained from the subject or from a parent or guardian for those participants not old enough to consent. Prior to each visit, subjects were asked to avoid any physical activity that exceeded their normal activity for 2 days.
MRI protocol
Subjects were placed supine in the bore of the magnet with the leg secured using foam padding and weighted with rice bags. Images were acquired on a 3T Philips Achieva system (Philips Medical Systems, R2.6.3-3.2) with an 8-channel receive only volume coil (lower leg), Tx-16 channel receive coil and a 2-channel receive-only flex coil (upper leg) (Invivo corp). Localizer images of the lower extremity skeletal muscles were obtained using T1-weighted 3D gradient echo (GE) with a flip angle of 20°. Images were acquired with SPectral selection Attenuated Inversion Recovery (SPAIR) fat suppression (lower leg: FOV=120×120×146 mm3, TR/TE=17/1.9 ms; upper leg: FOV=170×170×146 mm3, TR/TE= 24/1.8 ms) and without fat suppression (lower leg: FOV 120×120×146 mm3, TR/TE= 4.9/1.9 ms; upper leg: FOV 170×170×146 mm3, TR 6.1 ms, TE 1.4 ms).
Chemical shift-based MRI
Unipolar gradient echo (GE) images were acquired at 3 different echo times (TR/TE=430/8.06, 9.21, 10.36 ms) over 16–25 axial slices (4 mm slice thickness, 1 mm gap) with a 20° flip angle, and in subset of subjects with 5° flip angle. Acquisition matrix size (Read size range: 160–460, phase encode size range: 107–307) and field of view (AP, RL range: 80–230 mm, FH range: 64–124 mm) were adjusted depending on subject anatomy to obtain a 0.5 × 0.75 mm2 true spatial resolution. The receiver bandwith was 126kHz. The average scan time was about 3.5 minutes and was well tolerated by our young subject population. DICOM files and individual receiver channel complex k-space were stored for off-line processing.
Single voxel 1H-MRS
Single voxel 1H-MRS was used to measure T1, T2 and lipid composition from the SOL; (Fig. 1) and the VL muscles using STEAM (SW=2,000 Hz, number of points=2,048, number of averages=4 and a TR of 9,000 ms in order to avoid any T1 saturation). This was accomplished by using two separate STEAM scans for measuring T2 (16 echoes nonlinearly spaced between 10–288 ms) and T1 (6 inversion times: 100–9,000 ms). For the VL, 4 echoes were acquired: TE=11, 27, 54 and 243 ms. 1H-MRS fat fraction was calculated in both SOL and VL muscles from the TE=27 ms STEAM measurement. This measurement was selected for its relatively short TE to minimize the amount of lipid signal T2 correction required, and to minimize J-coupling effects and at longer echo times (37). The 27 ms TE acquisition was chosen over the 11ms as a compromise to reduce baseline oscillations from unsuppressed water while retaining a relatively short TE.
Figure 1.

Example of co-registration of single voxel MRS data from the soleus muscle with multislice water maps generated by MRI from calf of a DMD subject in (a) sagittal orientation and (b) axial orientation. A typical muscle spectrum is shown in (c) with numbered peaks corresponding to Table 1.
Voxel placement was optimized based on T1w 3D images to maximize the volume of acquisition within the SOL or VL, while minimizing out-of-volume contamination by the surrounding muscle fascia (Fig 1A and B). Out-of-volume contamination was previously determined using a bi-compartmental calibration phantom, containing lipid and water (38).
Data Analysis
We modeled the average proton muscle fat spectrum based on spectra acquired from 11 DMD and COL6 subjects with high fat fractions. These subjects had well-resolved fat peaks which permitted manual peak fitting by a single operator. Manual peak fitting was performed in Mnova (MestReLab Research, Santiago de Compostela, Spain) in the frequency domain by first phasing and baseline correcting the spectrum at TE=11 ms. Each spectrum’s main CH2 peak was referenced to 1.3 ppm. Then, for each visible resonance, the Gaussian-Lorentzian parameters were chosen to minimize the residual between the original and fitted spectrum. Finally, the fitted peak locations and amplitudes were recorded for each subject. The results were averaged to create a spectrum of 8 peak locations and relative amplitudes used in the imaging water/fat separation model (Table 1).
TABLE 1.
Parameters for 8 peak muscle water/fat separation imaging model.
| Resonance | Frequency Location (ppm) | Imaging Model Frequency location | Imaging Model Relative Amplitude |
|---|---|---|---|
| 1-(CH2)n-CH3 | 0.90 | −3.80 | 0.089 |
| 2-(CH2)n- | 1.30 | −3.40 | 0.598 |
| 3-CO-CH2-CH2 | 1.57 | −3.13 | 0.047 |
| 4-CH2-CH=CH-CH2- | 2.03 | −2.67 | 0.077 |
| 5-CO-CH2-CH2 | 2.24 | −2.46 | 0.052 |
| 6-CH=CH-CH2-CH=CH- | 2.78 | −1.92 | 0.011 |
| 7-CH2-O-CO- | 4.13 | −0.57 | 0.035 |
| H2O | 4.70 | 0 | N/A |
| 8-CH=CH- | 5.30 | 0.60 | 0.066 |
1H-MRS fat fraction was calculated as the total signal from the lipid region normalized to the sum of H2O and lipid signals. Signal amplitudes were measured by 1) peak integration applied to the phase corrected and baseline corrected spectrum using in-house software developed in IDL 8.1 (Exelis, CO) and 2) AMARES (jMRUI 5.0) according to the 8-peak muscle fat spectrum model. With area integration, the area under the 0.50–2.75 ppm lipid range was computed directly by summing the respective signal values, and the resulting sum was increased by 6.6% to account for the lipid contribution at 5.4 ppm not taken into account by integration. The H2O signal was obtained by integrating in the same way over the 4.30–5.10 ppm range (Figure 1c). In the AMARES model, an initial zero-order phase correction was applied with water referenced at 4.7 ppm. The starting values and prior knowledge for the water and lipid peaks were set according to the 8-peak muscle fat spectrum model. The water and lipid signals were corrected for T2 relaxation in the TR=9,000 acquisitions. Water was corrected using subject-specific T2 measurements, and lipid was corrected using an apparent T2 of 59.1 ± 2.9 ms for lipid. This apparent T2 was estimated by fitting the amplitude from 0.50 – 2.75 ppm to a single exponential decay model in a subset of 28 subjects with moderate-to-high fatty infiltration.
All GE data were zero-filled to obtain an interpolated in-plane resolution of (0.5 mm)2. Coil combination was performed using an adaptive filter method that preserved the relative image phase (39). Water, fat and B0 field maps were jointly estimated from the GE complex images using a graph cut algorithm in conjunction with a single peak (1P) or a 8-peak model (8P) fat signal model (40). Chemical shift misregistration between the water and fat separated images was corrected by shifting the reconstructed fat-only image the proper amount to compensate. To achieve sub-voxel shifting, the Fourier transform of the fat-only image was multiplied by an appropriate two-dimensional linear phase. The result was inverse transformed to produce the final, shifted image.
The 1H-MRS voxel (size, rotation, position) was co-registered to the GE image stack using the subject-to-image space coordinate transformations obtained from the DICOM data files. The co-registered 1H-MRS voxel mask was applied to the modulus of the complex water and fat maps to extract the mean signal values. An additional sample of the background noise was taken from the water and fat maps from a region of interest away from the leg. Mean and standard deviation of the background noise were then used to correct for Rician noise bias as described by Miller et al. (41), according to the following equation,
where Mc is the corrected signal value, M is the measured signal value, and MN is the measured noise floor in a region of interest away from the leg.
Fat fraction (FF) was computed using the mean water (MW) and mean fat (MF) values from the coregistered ROI, and corrected for T1 saturation (c) using the following equation:
where c = cw/cf. The correction factor c was estimated from the gradient echo signal model using group mean T1s (CON, C6, DMD) for water and a fixed T1 of 360 ms for lipid. A constant flip angle was assumed across the region of interest.
Phantom Validation
MRI based FF measures and the correction methods applied in this study were first validated on a set of phantoms. These phantoms consisted of three 1 L plastic bottles filled with equal amounts of water doped with copper sulfate (35 mM) and peanut oil (Fisher Scientific, Pittsburgh, PA) (Fig 2). Each bottle was imaged separately using the following protocol. A single 12 mm thick image slice and multiple single voxel STEAM spectra were prescribed within a rectangular region passing from 100% water to 100% peanut oil (fat) and angled to produce a gradient of fat-water composition. The STEAM voxels were prescribed inside and along the slice plane (Fig 2). Water T2 was measured using localized 1H-MRS and found to be 31.9 ± 0.1 ms.
Figure 2.
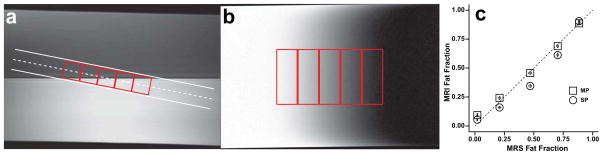
Phantom testing of water/fat decomposition algorithm using a single peak (SP) and a multi-peak (MP) spectral models on three individual phantoms. Scan plan location (a) and fat fraction map (b) with 1H-MRS voxel location shown in red. (c) Relationship between MRI derived fat fractions and localized single voxel 1H spectra. The dash line represents the line of identity. Standard deviations are represented by error bars inside data points.
Statistics
Coefficient of variations (CV) were computed to examine the variability between repeated measures. Specifically, for each MRI measure, a CV(%) was calculated separately for each subject by dividing the standard deviation of the repeated measure by the mean of the repeated measure multiplied by 100. All group comparisons were made using unpaired t-test with Welch’s correction and a two-tailed p-value using Prism Software (GraphPad, v6.0b). Statistical significance was defined as a p-value less than or equal to 0.05. Linear regressions were performed in Prism Software using linear least squares. All values are reported as means and standard error of the means.
Results
Phantom Validation of Fat Fraction Measurement
The phantom experiments allowed for the creation of a linear gradient of FFs in order to test the robustness of the different water-fat spectral models. We performed water/fat separation on each phantom’s data (n=3) using both the single peak model and a pre-calibrated peanut oil model computed as in (42). For each model, MRI and MRS FF were highly reproducible. The MRI derived FF differed significantly between the single peak and peanut oil models, with the single peak model underestimating FF at MRS FF between 0.2–0.8, as shown in Figure 2c. The correlation between the FF determined using single voxel 1H-MRS and the peanut oil model was (y=0.91×+0.06; R2 = 0.99; p<0.001, Fig 2c).
Muscle T1 and T2 Measured by 1H-MRS
Because underlying muscle damage and inflammation in dystrophic muscle has the potential to induce shifts in tissue water relaxation time constants, we measured muscle water T1 and T2 in affected and control muscles using inversion recovery and variable TE STEAM MRS (Table 2). We found that compared to control, DMD SOL muscle water T1 was significantly elevated in both DMD (DMD: 1,466 ± 21 ms (n=12) and COL6 (1,408 ± 11 ms, (n=16)) vs. CON (1,377 ± 10 ms, n=9). Likewise, muscle water T2 was significantly elevated in dystrophic SOL muscles (DMD: 31.3 ± 0.2 ms (n=71); COL6: 29.5 ± 0.3 ms (n=16) compared to CON (27.9 ± 0.1 ms (n=18)). In the VL, T2 values were 27.5 ± 0.5 ms in CON (n=6), 30.0 ± 0.5 ms in COL6 (n=16), and 29.6 ± 0.8 in DMD (n=10)). The number of T1 measurements in the VL was limited due to time constraints in the overall imaging protocol. However, VL T1 was measured to be 1,403 ± 9.1 ms (n=6), 1,504 ± 14 ms (n=6), 1,424 ± 28 (n=4) in control, DMD and COL6 respectively (Table 2). When pooling all muscle results, we found a positive linear relationship between muscle T1 and T2 (Fig 3; R2=0.72, p<0.001).
TABLE 2.
T1 and T2 values reported for each dystrophy type in our population for Soleus (SOL) and Vastus Lateralis (VL) muscles. The number of subjects in each measurement is indicated in parentheses.
| T1 (ms) | T2 (ms) | |||
|---|---|---|---|---|
| SOL | VL | SOL | VL | |
| Control | 1,377± 10 (9) | 1,403 ± 9.1(6) | 27.9 ± 0.12 (18) | 27.5 ± 0.47(6) |
| DMD | 1,466 ± 21(12)** | 1,504 ± 14(6)*** | 31.3 ± 0.21(71)*** | 29.6 ± 0.80(10)* |
| COL6 | 1,410 ± 11(16)* | 1,424 ± 28(4) | 29.6 ± 0.31(16)*** | 30.1 ± 0.51(16)** |
p<0.05,
p<0.01,
p<0.001 compared to control.
Figure 3.

Relationship between T1 and T2 values from the SOL of control and DMD subjects. We found a linear relationship (R2=0.72) between T1 and T2, represented by the solid line. The dashed lines represent the 95% confidence interval of the fit.
In vivo Validation of Fat Fraction Measurements by Water-Fat Separation Imaging
In vivo testing of the water/fat separation was performed by comparing the MRI results to single voxel non water suppressed STEAM spectra obtained from the SOL and VL in subjects ranging from low FF (1%) to almost complete fatty tissue replacement in the thigh muscles (>80%). We compared the FF results obtained by MRI acquired with a 20° flip angle to those obtained by MRS and determined using: 1) a model independent method based on peak integration, and 2) a 8-peak muscle fat spectrum model fitting using AMARES.
Whereas a single peak water/fat separation algorithm resulted in deviation away from linearity (Fig 4a; y=0.74×−0.02, R2=0.93), we found that the 8-peak water/fat separation algorithm resulted in a relationship closer to the line of identity between MRI and MRS muscle fat fractions determined both by peak integration (y=0.96×+0.01, R2=0.98; Fig 4b) and by a 8-peak water-lipid model in AMARES (y=0.93×+0.02, R2=0.98; Fig 4c). However, at the lowest FF (below 0.3), the relationship between MRI and MRS results deviated from linearity. The Bland-Altman plots (Fig 4) show the largest bias (SD=0.061) and 95% confidence limits of agreement ([−0.067,0.174]) for the 1P model compared to the 8P (SD=0.043; [−0.078, 0.091]). Indeed, MRI showed a systematic overestimation of FF as compared to MRS at low fat fraction, and this effect was even more pronounced in the 5° gradient echo acquisitions, in which signal-to-noise ratio was lower than with a 20° flip angle (Fig. 5). In a subgroup of subjects (n=62) we acquired and implemented noise bias correction on the data acquired at both 20° (Fig. 5b) and 5° (Fig. 5c) flip angles. The noise bias correction was able to reduce the overestimation of FF in the data set obtained with a 20° flip angle. This bias was also corrected in the 5° data set, however with a larger variability.
Figure 4.

Relationship between muscle fat fraction measured by MRI and MRS in all groups and muscles using (a) a single peak model (y=0.74×−0.02, R2=0.93), or (b) a multi-peak (8-peak) model (y=0.96×+0.01, R2=0.98) for fat spectral decomposition. MRS determined fat fractions were determined based using a model independent method (peak integration in a and b) and using a 8 peak fat-water model in AMARES (y=0.93×+0.02, R2=0.98) (c). The dashed line represents the identity line. The corresponding Bland-Altman plots are shown to the right of each relationship.
Figure 5.

Effect of the noise bias correction at high (20° flip angle) and low (5° flip angle) signal to noise ratio in the soleus. (a) MRI based FF with no noise bias correction as a function of MRS FF. The relationship showed a deviation from linearity at low FFs. (b) Noise bias corrected MRI FF based on the 20° flip angle acquisition and (c) based on the 5° flip angle acquisition, as a function of MRS FF. The dashed line represents the identity line.
Day to Day Reproducibility
Prior to noise bias correction the average day-to-day variability in imaging FF was found to have a coefficient of variance (CV) of 12% in control muscle (n=6) and 5.3% in DMD muscle (n=26) and was characterized by a relative error in the FF of 54.3% in DMD muscles and 120% in control muscles when compared to the MRS results. Following noise bias correction, the day-to-day variability (CV) in FF was 13% in control muscle and 14% in DMD muscle, and the relative error in FF was decreased to 22% and 6%, respectively. This error corresponded to an absolute difference of 0.006±0.005, 0.002±0.004 in FF between days in both control and DMD SOL muscles. The corresponding day-to-day variation in the same ROI determined by MRS was determined to be 5.7% CV and 3.4% CV in control and DMD respectively.
Heterogeneity in Fat Deposition in DMD and COL6
Dystrophic muscle was characterized by a significantly increased FF (p<0.005) in comparison to control muscles based both on MRI and MRS measures in the SOL and VL (Fig. 6). Mean MRS FF was elevated by 3.7 fold in the SOL and 10.8 fold in the VL of DMD subjects and was elevated by 4.7 fold in the SOL and 8.1 fold in the VL of COL6 subjects compared to controls. MRI determined FF was significantly elevated compared to controls in all dystrophic muscles except for the COL6 VL (Fig. 6d). We found that tremendous spatial heterogeneity existed within the dystrophic muscles, as shown by the FF histograms found within the co-registered ROIs (Fig. 7). SOL and VL MRS VOIs represented between 5,000–8,000 pixels in the corresponding MRI derived FF maps. Histogram of these VOIs revealed features that could be used to further differentiate dystrophic muscles from unaffected control muscles, and that a different pattern of involvement exists within dystrophic muscles despite the same overall FF.
Figure 6.

Muscle fat fraction measured in CON, COL6, DMD groups in soleus by (a) MRS and (b) MRI, and in the vastus lateralis by (c) MRS and (d) MRI.
Figure 7.

Examples of histograms from the medial gastrocnemius of two different COL6 subjects with similar fat fraction as measured by MRI. Subject (a) showed fatty infiltration inward from the external fascia, which was associated with a bimodal fat fraction distribution (c), whereas subject (b) showed a unimodal distribution characteristic of a more diffuse pattern of fat infiltration.
Discussion
In this study we showed that MRI based muscle FF determination was highly correlated with co-localized single voxel 1H-MRS results in muscle over the full range of measured FFs when using the appropriate combination of multipeak (8-peak) fat-water separation algorithm, and T1 and T2 relaxation times correction. We also found that noise bias correction allowed for improved accuracy of FF determination at low fat fractions associated with early stages of the disease progression or in unaffected, control muscles. Consistent with previous findings in dystrophic muscle, we found that muscle water T2 was elevated in dystrophic muscle (both COL6 and DMD), but a new observation was that we also found the muscle water T1 was elevated and correlated with increased muscle T2 at 3T. This allowed us to examine if there is an additional T1 bias over the range of T2 observed in dystrophic muscle. Despite a higher day-to-day variation in FF calculation, MRI based FF maps could be used to clearly differentiate affected from control tissue. In addition the high-spatial resolution FF maps produced by imaging allowed us to extract out the underlying spatial heterogeneity in fatty tissue deposition in the calf and thigh muscles of subjects with COL6 and DMD, information that could not be obtained by single voxel 1H-MRS.
Fat fraction maps can be extracted from MR images using a number of methodologies based on differences in lipid and water in chemical shifts (16,20,21,43), T1 (44,45) and T2 (44,46–48). Since the original description of fat-water separation based on the differences in signal magnitude between out of phase and in phase images by Dixon (18), chemical shift based MR imaging has become a widely used method to perform high resolution fat and water imaging. Accurate modeling of fat-water chemical shift differences, correction for noise and T1 bias, and B0 field mapping have all shown to be critical to obtain accurate FF maps (49). Based on the excellent spatial resolution achievable with chemical shift sensitive MRI, applications in various myopathies are rapidly emerging (20,21,50,51) and the specific model assumptions for their use in muscle are being examined. In agreement with previous findings (52) we found that the calculated FF value was highly dependent on whether a single or a multipeak model was used for separation of fat and water. In this work, we have extended the study of this relationship to include not only the model dependence but also a comparison of the results to the gold standard of relaxation corrected localized 1H-MRS. A limitation of this study was the limited number of TE times that were acquired limited our ability to be able to discriminate between different models of the fat spectrum that have been observed in subcutaneous fat, liver and muscle (53).
The ability to match the region of interest measured by single voxel proton MRS with FF maps calculated using MRI allowed for the direct correlation of FF in a plantar flexor and a knee extensor muscle, which are differently affected in the muscular dystrophies (2,12). The differential involvement of these muscles provided a large range of FF values (1%–86%) to compare MRS results with MRI derived values, which is not possible in the general unaffected population. We found a strong linear correlation between FF determined using a multipeak fat-water model and MRS values, whereas the relationship between a single peak model and MRS was found not to be linear over the full range of FFs. The 1H spectrum in muscle is more complicated than the model used to fit the data, which is primarily due to susceptibility shifted lipids (54). With the limited echo sampling conditions in which the imaging data was acquired, it is not possible to distinguish between multiple lipid models including differences in saturation index (53) or IMCL from EMCL (54). Due to the orientation and muscle dependence of IMCL and EMCL levels, it cannot be ruled out that this led to increased variability in our results. Our technique may not be suitable for applications where the discrimination between IMCL and EMCL levels are desired (e.g., diabetes), and in these cases that require separation of IMCL and EMCL more advanced imaging methods (55) or spectroscopy should be considered.
The correlation between MRI and MRS determined FF at low FF values was improved by accounting for the noise bias. These results show that accurate FF maps can be obtained by chemical shift based fat-water imaging. Validation of chemical shift based fat-water imaging for FF fraction determination has been provided by Gaeta, et al (51), in which a histochemical measure of fat content obtained from muscle biopsies was directly compared to a dual echo, dual flip angle acquisition.
We determined the reproducibility of both MRI and MRS determined muscle fat fractions measurements in unaffected and DMD subjects. Inter-rater observer variability for 3-point Dixon approach has been reported to be extremely low at ~2.5% (21) in subjects with myotonic dystrophy type I and ~3% in diabetic subjects (43). In the present study, using a voxel guided approach, we determined the day-to-day variability in both unaffected and DMD subjects. This variability takes into account differences due to both biological and instrumentation variations, such as daily activity, subject position, and scan quality. Prior to noise bias correction the day-to-day CV in the MRI determined FF was 12% and 5.3 % for controls and DMD, respectively. Noise bias correction increased the accuracy of the imaging FF as compared to the corresponding MRS volume, but resulted in an increase in day-to-day CV to 13% and 14% for controls and DMD, respectively. MRS on the other hand was found to have a day-to-day CV=5.7% even in the lowest FF from the unaffected controls. Unavoidably, both MRI and MRS FF measurements are influenced by noise at the lowest levels of fat SNR. Thus, increased averaging may be necessary to achieve higher SNR and increase precisions of both techniques to discriminate small differences between the low FF in the unaffected controls. This has previously been reported as a possible limitation of using chemical shift separation methods in the heart due to the low myocardial lipid content (56). As the muscle is increasingly replaced by fatty tissue during disease progression and lipid SNR is increased, the variability in FF will decrease. This was empirically demonstrated in this study by the reduced day-to-day variation observed in both MRI and MRS in the DMD boys who possess a higher FF.
A limitation of this study was the use of a long initial TE and only two subsequent echoes acquired for water fat discrimination. As a consequence the analysis of the imaging data is complicated by the effects of susceptibility on lipid chemical shift (55), T2* (57) and noise bias (58). This could potentially explain the larger variability at low fat fractions, especially in the 5-degree MRI acquisitions. The relatively long initial TE provides time for the multiple fat signals to evolve under chemical shift local field inhomogeneities, and therefore may affect the fidelity of fat-water separation. A shorter initial TE will decrease noise bias by increasing SNR, will help to reduce T2* effects, and reduce the time under which the multiple fat signals may interact, increasing both the accuracy and decreasing day-to-day variability. In addition, a MRI acquisition scheme which increased TE sampling may not only help to measure the T2* but also to evaluate the influence of tissue heterogeneity that exists in dystrophic muscle on both water T2* and lipid chemical shifts. Further improvements in the reproducibility of the measurements at low FF are expected to be achieved with accurate dual T2* mapping (57), emerging noise bias compensations schemes (58,59), and optimization of acquisition parameters tailored specifically to muscle studies (59,60).
We investigated whether differences in muscle T1 existed in dystrophic muscle. It has been well established that large differences in water and fat T1 values result in a large T1 bias under conditions of signal saturation, with short TR and/or large flip angles (31). Differences in T1 values between dystrophic and unaffected muscles could offer an additional source of bias. Since the early MRI studies of dystrophic muscle it has been shown that T2 is increased and T1 decreased in muscles experiencing fatty tissue replacement (61). Due to chemical shift dispersion, MRS has the ability to measure the T1 from water and fat independently in heavily fatty tissue infiltrated muscle. In the present study we found that water T1 and T2 were both increased in DMD muscle, with water T1 being increased by 6.6% and T2 by 11% percent. As a group, both COL6 and DMD muscle T1 and T2 values were significantly elevated compared to unaffected controls. This provides the unique opportunity to determine whether there is an additional T1 bias that exists in dystrophic and damaged muscle due to an elevated tissue T1. Using the largest difference in T1 between DMD (1,458 ± 30 ms) and the mean unaffected muscle T1 (1,368 ms), we calculated a “worst-case” T1 bias ranging between 1.49–1.33% for FF from 1%–10% when using the imaging parameters in this study (flip angle=20 deg, TR=430 ms). This T1 bias could be further reduced by decreasing the flip angle (31,58,62). However, our findings indicate that the associated decrease in SNR would increase noise bias at the lower FF, which may be counterproductive and result in further deviations from the true FF.
Both spectroscopic imaging and 1H-MRS have the potential to quantify intramuscular fat and have been used to characterize the muscular dystrophies. Gaeta et al. (19) found a strong correlation between FF measured by two-point Dixon imaging and by muscle biopsy, while a strong correlation has been also found between quantitative MR measures of fat infiltration and measures of functional ability (63). Despite having different molecular and genetic etiologies, FF was elevated in both the SOL and VL muscles of COL6 and DMD subjects. The FFs determined by MRS were 3.20 ± 2.23 fold greater in the quadriceps muscle (VL) in comparison to the calf muscle (SOL) of boys with DMD, which is characteristic of the proximal to distal involvement shown both clinically and by histology in this population. The relative difference in FF between COL6 VL and SOL was 2.36 ± 1.30 fold, indicating a similar pattern of involvement as DMD. Previous cross sectional studies in both DMD (20,51) and myotonic dystrophy (21) patients have shown good correlations between FF calculated by chemical shift based imaging, muscle function and clinical scoring. The data here are presented as a cross sectional study; future longitudinal studies will provide insight into the sensitivity of these measures to detect disease progression.
The ability to image and quantify the heterogeneity in dystrophic muscle with high resolution in three dimensions not only makes MRI a diagnostic tool, but also gives it the potential to monitor therapeutic intervention. Semi-quantitative scoring of differential muscle group involvement in conjunction with molecular/histological testing has become a powerful tool helping the diagnosis and even reclassification (64) of many different types of muscle dystrophies and myopathies (12). Visual scoring according to the Mercuri scale within a single muscle group has been shown to correlate to histopathological grade (11) performed on biopsies and to be a powerful inclusion criterion for the clinical trials using exon-skipping drugs. In addition, Alizai et al, 2012 (30) found that “semi-quantitative grading of intramuscular fat and quantitative fat fraction were significantly correlated and both techniques had excellent reproducibility. However, the clinical grading was found to overestimate muscle fat. The availability of accurate fat-water mapping may further strengthen this approach.
Chemical shift based MRI for fat water separation offers a quantitative method to capture not only FF but also an index of the underlying tissue heterogeneity. 1H-MRS gives an extremely sensitive and reproducible measure of FF but any index of underlying tissue heterogeneity is lost due to its relatively low spatial resolution. For instance, a single voxel acquired for 1H-MRS in this study was found to be, on average, equivalent to 5,000 imaging voxels. Histogram analysis of such a VOI that covers the MRS voxel clearly demonstrated that extreme heterogeneity in FF as determined by chemical shift based MRI existed within muscles and between dystrophy subjects (Fig 7). It is anticipated that these high-resolution quantitative maps of the fatty tissue replacement will provide sensitive indices of disease progression or response to therapeutic intervention since different muscles and muscle fibers are not all expected to respond to an intervention in the same manner. Significant image processing challenges have to be overcome in order to extract the features that characterize the natural history of disease progression as well as capture the differences between the individual dystrophy types and muscle groups within a subject. For instance it is widely accepted that COL6 is characterized by increasing involvement of the muscle extending inward from the external fascia (6) while DMD is more diffuse (12). Texture analysis offers great promise in this arena and is an area of future research.
Acknowledgments
The authors would like to thank Diego Hernando for providing the Matlab code for the calculation of water, fat and field maps, and Jahannaz Dastgir and Wei Lin for helpful discussions. NIAMS/NINDS R01AR056973, NIH U54AR052646, Parent Project Muscular Dystrophy, and Cure CMD. A portion of this work was performed at the National High Magnetic Field Laboratory, which is supported by National Science Foundation Cooperative Agreement No. DMR-0654118, the State of Florida, and the U.S. Department of Energy.
References
- 1.Hoffman EP, Brown RH, Jr, Kunkel LM. Dystrophin: the protein product of the Duchenne muscular dystrophy locus. Cell. 1987;51(6):919–928. doi: 10.1016/0092-8674(87)90579-4. [DOI] [PubMed] [Google Scholar]
- 2.Bushby K, Finkel R, Birnkrant DJ, Case LE, Clemens PR, Cripe L, Kaul A, Kinnett K, McDonald C, Pandya S, Poysky J, Shapiro F, Tomezsko J, Constantin C. Diagnosis and management of Duchenne muscular dystrophy, part 1: diagnosis, and pharmacological and psychosocial management. Lancet neurology. 2010;9(1):77–93. doi: 10.1016/S1474-4422(09)70271-6. [DOI] [PubMed] [Google Scholar]
- 3.Mendell JR, Shilling C, Leslie ND, Flanigan KM, al-Dahhak R, Gastier-Foster J, Kneile K, Dunn DM, Duval B, Aoyagi A, Hamil C, Mahmoud M, Roush K, Bird L, Rankin C, Lilly H, Street N, Chandrasekar R, Weiss RB. Evidence-based path to newborn screening for Duchenne muscular dystrophy. Annals of neurology. 2012;71(3):304–313. doi: 10.1002/ana.23528. [DOI] [PubMed] [Google Scholar]
- 4.Bushby K, Finkel R, Birnkrant DJ, Case LE, Clemens PR, Cripe L, Kaul A, Kinnett K, McDonald C, Pandya S, Poysky J, Shapiro F, Tomezsko J, Constantin C. Diagnosis and management of Duchenne muscular dystrophy, part 2: implementation of multidisciplinary care. Lancet neurology. 2010;9(2):177–189. doi: 10.1016/S1474-4422(09)70272-8. [DOI] [PubMed] [Google Scholar]
- 5.Bertini E, D’Amico A, Gualandi F, Petrini S. Congenital muscular dystrophies: a brief review. Seminars in pediatric neurology. 2011;18(4):277–288. doi: 10.1016/j.spen.2011.10.010. [DOI] [PMC free article] [PubMed] [Google Scholar]
- 6.Bonnemann CG. The collagen VI-related myopathies: muscle meets its matrix. Nature reviews Neurology. 2011;7(7):379–390. doi: 10.1038/nrneurol.2011.81. [DOI] [PMC free article] [PubMed] [Google Scholar]
- 7.Collins J, Bonnemann CG. Congenital muscular dystrophies: toward molecular therapeutic interventions. Current neurology and neuroscience reports. 2010;10(2):83–91. doi: 10.1007/s11910-010-0092-8. [DOI] [PubMed] [Google Scholar]
- 8.Partridge TA. Impending therapies for Duchenne muscular dystrophy. Current opinion in neurology. 2011;24(5):415–422. doi: 10.1097/WCO.0b013e32834aa3f1. [DOI] [PubMed] [Google Scholar]
- 9.Finanger EL, Russman B, Forbes SC, Rooney WD, Walter GA, Vandenborne K. Use of skeletal muscle MRI in diagnosis and monitoring disease progression in Duchenne muscular dystrophy. Physical medicine and rehabilitation clinics of North America. 2012;23(1):1–10. ix. doi: 10.1016/j.pmr.2011.11.004. [DOI] [PMC free article] [PubMed] [Google Scholar]
- 10.Kornegay JN, Bogan JR, Bogan DJ, Childers MK, Li J, Nghiem P, Detwiler DA, Larsen CA, Grange RW, Bhavaraju-Sanka RK, Tou S, Keene BP, Howard JF, Jr, Wang J, Fan Z, Schatzberg SJ, Styner MA, Flanigan KM, Xiao X, Hoffman EP. Canine models of Duchenne muscular dystrophy and their use in therapeutic strategies. Mammalian genome : official journal of the International Mammalian Genome Society. 2012;23(1–2):85–108. doi: 10.1007/s00335-011-9382-y. [DOI] [PMC free article] [PubMed] [Google Scholar]
- 11.Kinali M, Arechavala-Gomeza V, Cirak S, Glover A, Guglieri M, Feng L, Hollingsworth KG, Hunt D, Jungbluth H, Roper HP, Quinlivan RM, Gosalakkal JA, Jayawant S, Nadeau A, Hughes-Carre L, Manzur AY, Mercuri E, Morgan JE, Straub V, Bushby K, Sewry C, Rutherford M, Muntoni F. Muscle histology vs MRI in Duchenne muscular dystrophy. Neurology. 2011;76(4):346–353. doi: 10.1212/WNL.0b013e318208811f. [DOI] [PMC free article] [PubMed] [Google Scholar]
- 12.Wattjes MP, Kley RA, Fischer D. Neuromuscular imaging in inherited muscle diseases. European radiology. 2010;20(10):2447–2460. doi: 10.1007/s00330-010-1799-2. [DOI] [PMC free article] [PubMed] [Google Scholar]
- 13.Arpan I, Forbes SC, Lott DJ, Senesac CR, Daniels MJ, Triplett WT, Deol JK, Sweeney HL, Walter GA, Vandenborne K. T(2) mapping provides multiple approaches for the characterization of muscle involvement in neuromuscular diseases: a cross-sectional study of lower leg muscles in 5–15-year-old boys with Duchenne muscular dystrophy. NMR in biomedicine. 2012 doi: 10.1002/nbm.2851. [DOI] [PMC free article] [PubMed] [Google Scholar]
- 14.Akima H, Lott D, Senesac C, Deol J, Germain S, Arpan I, Bendixen R, Lee Sweeney H, Walter G, Vandenborne K. Relationships of thigh muscle contractile and non-contractile tissue with function, strength, and age in boys with Duchenne muscular dystrophy. Neuromuscular disorders : NMD. 2012;22(1):16–25. doi: 10.1016/j.nmd.2011.06.750. [DOI] [PMC free article] [PubMed] [Google Scholar]
- 15.Torriani M, Townsend E, Thomas BJ, Bredella MA, Ghomi RH, Tseng BS. Lower leg muscle involvement in Duchenne muscular dystrophy: an MR imaging and spectroscopy study. Skeletal radiology. 2012;41(4):437–445. doi: 10.1007/s00256-011-1240-1. [DOI] [PMC free article] [PubMed] [Google Scholar]
- 16.Forbes SC, Lott DJ, Finkel RS, Senesac C, Byrne BJ, Sweeney HL, Walter GA, Vandenborne K. MRI/MRS evaluation of a female carrier of Duchenne muscular dystrophy. Neuromuscular disorders : NMD. 2012;22(Suppl 2):S111–121. doi: 10.1016/j.nmd.2012.05.013. [DOI] [PMC free article] [PubMed] [Google Scholar]
- 17.Bongers H, Schick F, Skalej M, Jung WI, Stevens A. Localized in vivo 1H spectroscopy of human skeletal muscle: normal and pathologic findings. Magnetic resonance imaging. 1992;10(6):957–964. doi: 10.1016/0730-725x(92)90450-e. [DOI] [PubMed] [Google Scholar]
- 18.Dixon WT. Simple proton spectroscopic imaging. Radiology. 1984;153(1):189–194. doi: 10.1148/radiology.153.1.6089263. [DOI] [PubMed] [Google Scholar]
- 19.Gaeta M, Scribano E, Mileto A, Mazziotti S, Rodolico C, Toscano A, Settineri N, Ascenti G, Blandino A. Muscle fat fraction in neuromuscular disorders: dual-echo dual-flip-angle spoiled gradient-recalled MR imaging technique for quantification--a feasibility study. Radiology. 2011;259(2):487–494. doi: 10.1148/radiol.10101108. [DOI] [PubMed] [Google Scholar]
- 20.Wren TA, Bluml S, Tseng-Ong L, Gilsanz V. Three-point technique of fat quantification of muscle tissue as a marker of disease progression in Duchenne muscular dystrophy: preliminary study. AJR American journal of roentgenology. 2008;190(1):W8–12. doi: 10.2214/AJR.07.2732. [DOI] [PubMed] [Google Scholar]
- 21.Hiba B, Richard N, Hebert LJ, Cote C, Nejjari M, Vial C, Bouhour F, Puymirat J, Janier M. Quantitative assessment of skeletal muscle degeneration in patients with myotonic dystrophy type 1 using MRI. Journal of magnetic resonance imaging : JMRI. 2012;35(3):678–685. doi: 10.1002/jmri.22849. [DOI] [PubMed] [Google Scholar]
- 22.Belabbas H, Zalvidea S, Casellas D, Moles JP, Galbes O, Mercier J, Jover B. Contrasting effect of exercise and angiotensin II hypertension on in vivo and in vitro cardiac angiogenesis in rats. American journal of physiology Regulatory, integrative and comparative physiology. 2008;295(5):R1512–1518. doi: 10.1152/ajpregu.00014.2008. [DOI] [PubMed] [Google Scholar]
- 23.Hines CD, Yu H, Shimakawa A, McKenzie CA, Brittain JH, Reeder SB. T1 independent, T2* corrected MRI with accurate spectral modeling for quantification of fat: validation in a fat-water-SPIO phantom. Journal of magnetic resonance imaging : JMRI. 2009;30(5):1215–1222. doi: 10.1002/jmri.21957. [DOI] [PMC free article] [PubMed] [Google Scholar]
- 24.Lee SS, Lee Y, Kim N, Kim SW, Byun JH, Park SH, Lee MG, Ha HK. Hepatic fat quantification using chemical shift MR imaging and MR spectroscopy in the presence of hepatic iron deposition: validation in phantoms and in patients with chronic liver disease. Journal of magnetic resonance imaging : JMRI. 2011;33(6):1390–1398. doi: 10.1002/jmri.22583. [DOI] [PubMed] [Google Scholar]
- 25.Kovanlikaya A, Guclu C, Desai C, Becerra R, Gilsanz V. Fat quantification using three-point dixon technique: in vitro validation. Academic radiology. 2005;12(5):636–639. doi: 10.1016/j.acra.2005.01.019. [DOI] [PubMed] [Google Scholar]
- 26.Reeder SB, Robson PM, Yu H, Shimakawa A, Hines CD, McKenzie CA, Brittain JH. Quantification of hepatic steatosis with MRI: the effects of accurate fat spectral modeling. Journal of magnetic resonance imaging : JMRI. 2009;29(6):1332–1339. doi: 10.1002/jmri.21751. [DOI] [PMC free article] [PubMed] [Google Scholar]
- 27.Guiu B, Loffroy R, Petit JM, Aho S, Ben Salem D, Masson D, Hillon P, Cercueil JP, Krause D. Mapping of liver fat with triple-echo gradient echo imaging: validation against 3. 0-T proton MR spectroscopy. European radiology. 2009;19(7):1786–1793. doi: 10.1007/s00330-009-1330-9. [DOI] [PubMed] [Google Scholar]
- 28.Fischer MA, Nanz D, Shimakawa A, Schirmer T, Guggenberger R, Chhabra A, Carrino JA, Andreisek G. Quantification of Muscle Fat in Patients with Low Back Pain: Comparison of Multi-Echo MR Imaging with Single-Voxel MR Spectroscopy. Radiology. 2012 doi: 10.1148/radiol.12120399. [DOI] [PubMed] [Google Scholar]
- 29.Yu H, Shimakawa A, McKenzie CA, Brodsky E, Brittain JH, Reeder SB. Multiecho water-fat separation and simultaneous R2* estimation with multifrequency fat spectrum modeling. Magnetic resonance in medicine : official journal of the Society of Magnetic Resonance in Medicine / Society of Magnetic Resonance in Medicine. 2008;60(5):1122–1134. doi: 10.1002/mrm.21737. [DOI] [PMC free article] [PubMed] [Google Scholar]
- 30.Alizai H, Nardo L, Karampinos DC, Joseph GB, Yap SP, Baum T, Krug R, Majumdar S, Link TM. Comparison of clinical semi-quantitative assessment of muscle fat infiltration with quantitative assessment using chemical shift-based water/fat separation in MR studies of the calf of post-menopausal women. European radiology. 2012;22(7):1592–1600. doi: 10.1007/s00330-012-2404-7. [DOI] [PMC free article] [PubMed] [Google Scholar]
- 31.Karampinos DC, Yu H, Shimakawa A, Link TM, Majumdar S. T(1)-corrected fat quantification using chemical shift-based water/fat separation: application to skeletal muscle. Magnetic resonance in medicine : official journal of the Society of Magnetic Resonance in Medicine / Society of Magnetic Resonance in Medicine. 2011;66(5):1312–1326. doi: 10.1002/mrm.22925. [DOI] [PMC free article] [PubMed] [Google Scholar]
- 32.Bydder M, Yokoo T, Hamilton G, Middleton MS, Chavez AD, Schwimmer JB, Lavine JE, Sirlin CB. Relaxation effects in the quantification of fat using gradient echo imaging. Magnetic resonance imaging. 2008;26(3):347–359. doi: 10.1016/j.mri.2007.08.012. [DOI] [PMC free article] [PubMed] [Google Scholar]
- 33.Yu H, McKenzie CA, Shimakawa A, Vu AT, Brau AC, Beatty PJ, Pineda AR, Brittain JH, Reeder SB. Multiecho reconstruction for simultaneous water-fat decomposition and T2* estimation. Journal of magnetic resonance imaging : JMRI. 2007;26(4):1153–1161. doi: 10.1002/jmri.21090. [DOI] [PubMed] [Google Scholar]
- 34.Mathur S, Vohra RS, Germain SA, Forbes S, Bryant ND, Vandenborne K, Walter GA. Changes in muscle T2 and tissue damage after downhill running in mdx mice. Muscle & nerve. 2011;43(6):878–886. doi: 10.1002/mus.21986. [DOI] [PMC free article] [PubMed] [Google Scholar]
- 35.Misra LK, Narayana PA. In vivo T1 characterization of genetically induced muscle atrophy. Magnetic resonance imaging. 1989;7(3):277–282. doi: 10.1016/0730-725x(89)90550-x. [DOI] [PubMed] [Google Scholar]
- 36.Liu CY, McKenzie CA, Yu H, Brittain JH, Reeder SB. Fat quantification with IDEAL gradient echo imaging: correction of bias from T(1) and noise. Magnetic resonance in medicine : official journal of the Society of Magnetic Resonance in Medicine / Society of Magnetic Resonance in Medicine. 2007;58(2):354–364. doi: 10.1002/mrm.21301. [DOI] [PubMed] [Google Scholar]
- 37.Hamilton G, Middleton MS, Bydder M, Yokoo T, Schwimmer JB, Kono Y, Patton HM, Lavine JE, Sirlin CB. Effect of PRESS and STEAM sequences on magnetic resonance spectroscopic liver fat quantification. Journal of magnetic resonance imaging : JMRI. 2009;30(1):145–152. doi: 10.1002/jmri.21809. [DOI] [PMC free article] [PubMed] [Google Scholar]
- 38.Forbes SC, Walter GA, Rooney WD, Wang DJ, Devos S, Pollaro J, Triplett W, Lott DJ, Willcocks RJ, Senesac C, Daniels MJ, Byrne BJ, Russman B, Finkel RS, Meyer JS, Sweeney HL, Vandenborne K. Skeletal Muscles of Ambulant Children with Duchenne Muscular Dystrophy: Validation of Multicenter Study of Evaluation with MR Imaging and MR Spectroscopy. Radiology. 2013 doi: 10.1148/radiol.13121948. [DOI] [PMC free article] [PubMed] [Google Scholar]
- 39.Walsh DO, Gmitro AF, Marcellin MW. Adaptive reconstruction of phased array MR imagery. Magnetic resonance in medicine : official journal of the Society of Magnetic Resonance in Medicine / Society of Magnetic Resonance in Medicine. 2000;43(5):682–690. doi: 10.1002/(sici)1522-2594(200005)43:5<682::aid-mrm10>3.0.co;2-g. [DOI] [PubMed] [Google Scholar]
- 40.Hernando D, Kellman P, Haldar JP, Liang ZP. Robust water/fat separation in the presence of large field inhomogeneities using a graph cut algorithm. Magnetic resonance in medicine : official journal of the Society of Magnetic Resonance in Medicine / Society of Magnetic Resonance in Medicine. 2010;63(1):79–90. doi: 10.1002/mrm.22177. [DOI] [PMC free article] [PubMed] [Google Scholar]
- 41.Miller AJ, Joseph PM. The use of power images to perform quantitative analysis on low SNR MR images. Magnetic resonance imaging. 1993;11(7):1051–1056. doi: 10.1016/0730-725x(93)90225-3. [DOI] [PubMed] [Google Scholar]
- 42.Bydder M, Girard O, Hamilton G. Mapping the double bonds in triglycerides. Magnetic resonance imaging. 2011;29(8):1041–1046. doi: 10.1016/j.mri.2011.07.004. [DOI] [PubMed] [Google Scholar]
- 43.Karampinos DC, Baum T, Nardo L, Alizai H, Yu H, Carballido-Gamio J, Yap SP, Shimakawa A, Link TM, Majumdar S. Characterization of the regional distribution of skeletal muscle adipose tissue in type 2 diabetes using chemical shift-based water/fat separation. Journal of magnetic resonance imaging : JMRI. 2012;35(4):899–907. doi: 10.1002/jmri.23512. [DOI] [PMC free article] [PubMed] [Google Scholar]
- 44.Huang Y, Majumdar S, Genant HK, Chan WP, Sharma KR, Yu P, Mynhier M, Miller RG. Quantitative MR relaxometry study of muscle composition and function in Duchenne muscular dystrophy. Journal of magnetic resonance imaging : JMRI. 1994;4(1):59–64. doi: 10.1002/jmri.1880040113. [DOI] [PubMed] [Google Scholar]
- 45.Akima H, Lott D, Senesac C, Deol J, Germain S, Arpan I, Bendixen R, Lee Sweeney H, Walter G, Vandenborne K. Relationships of thigh muscle contractile and non-contractile tissue with function, strength, and age in boys with Duchenne muscular dystrophy. Neuromuscul Disord. 2012;22(1):16–25. doi: 10.1016/j.nmd.2011.06.750. [DOI] [PMC free article] [PubMed] [Google Scholar]
- 46.Garrood P, Hollingsworth KG, Eagle M, Aribisala BS, Birchall D, Bushby K, Straub V. MR imaging in Duchenne muscular dystrophy: quantification of T1-weighted signal, contrast uptake, and the effects of exercise. Journal of magnetic resonance imaging : JMRI. 2009;30(5):1130–1138. doi: 10.1002/jmri.21941. [DOI] [PubMed] [Google Scholar]
- 47.Kim HK, Laor T, Horn PS, Racadio JM, Wong B, Dardzinski BJ. T2 mapping in Duchenne muscular dystrophy: distribution of disease activity and correlation with clinical assessments. Radiology. 2010;255(3):899–908. doi: 10.1148/radiol.10091547. [DOI] [PubMed] [Google Scholar]
- 48.Kim HK, Laor T, Horn PS, Wong B. Quantitative assessment of the T2 relaxation time of the gluteus muscles in children with Duchenne muscular dystrophy: a comparative study before and after steroid treatment. Korean J Radiol. 2010;11(3):304–311. doi: 10.3348/kjr.2010.11.3.304. [DOI] [PMC free article] [PubMed] [Google Scholar]
- 49.Glover GH, Schneider E. Three-point Dixon technique for true water/fat decomposition with B0 inhomogeneity correction. Magnetic resonance in medicine : official journal of the Society of Magnetic Resonance in Medicine / Society of Magnetic Resonance in Medicine. 1991;18(2):371–383. doi: 10.1002/mrm.1910180211. [DOI] [PubMed] [Google Scholar]
- 50.Fischmann A, Hafner P, Gloor M, Schmid M, Klein A, Pohlman U, Waltz T, Gonzalez R, Haas T, Bieri O, Fischer D. Quantitative MRI and loss of free ambulation in Duchenne muscular dystrophy. Journal of neurology. 2012 doi: 10.1007/s00415-012-6733-x. [DOI] [PubMed] [Google Scholar]
- 51.Gaeta M, Messina S, Mileto A, Vita GL, Ascenti G, Vinci S, Bottari A, Vita G, Settineri N, Bruschetta D, Racchiusa S, Minutoli F. Muscle fat-fraction and mapping in Duchenne muscular dystrophy: evaluation of disease distribution and correlation with clinical assessments. Preliminary experience Skeletal radiology. 2012;41(8):955–961. doi: 10.1007/s00256-011-1301-5. [DOI] [PubMed] [Google Scholar]
- 52.Wokke BH, Bos C, Reijnierse M, van Rijswijk CS, Eggers H, Webb A, Verschuuren JJ, Kan HE. Comparison of dixon and T1-weighted MR methods to assess the degree of fat infiltration in duchenne muscular dystrophy patients. Journal of magnetic resonance imaging : JMRI. 2013 doi: 10.1002/jmri.23998. [DOI] [PubMed] [Google Scholar]
- 53.Berglund J, Ahlstrom H, Kullberg J. Model-based mapping of fat unsaturation and chain length by chemical shift imaging--phantom validation and in vivo feasibility. Magnetic resonance in medicine : official journal of the Society of Magnetic Resonance in Medicine / Society of Magnetic Resonance in Medicine. 2012;68(6):1815–1827. doi: 10.1002/mrm.24196. [DOI] [PubMed] [Google Scholar]
- 54.Karampinos DC, Yu H, Shimakawa A, Link TM, Majumdar S. Chemical shift-based water/fat separation in the presence of susceptibility-induced fat resonance shift. Magnetic Resonance in Medicine. 2012;68(5):1495–1505. doi: 10.1002/mrm.24157. [DOI] [PMC free article] [PubMed] [Google Scholar]
- 55.Karampinos DC, Yu H, Shimakawa A, Link TM, Majumdar S. Chemical shift-based water/fat separation in the presence of susceptibility-induced fat resonance shift. Magnetic resonance in medicine : official journal of the Society of Magnetic Resonance in Medicine / Society of Magnetic Resonance in Medicine. 2012;68(5):1495–1505. doi: 10.1002/mrm.24157. [DOI] [PMC free article] [PubMed] [Google Scholar]
- 56.Liu CY, Redheuil A, Ouwerkerk R, Lima JA, Bluemke DA. Myocardial fat quantification in humans: Evaluation by two-point water-fat imaging and localized proton spectroscopy. Magnetic resonance in medicine : official journal of the Society of Magnetic Resonance in Medicine / Society of Magnetic Resonance in Medicine. 2010;63(4):892–901. doi: 10.1002/mrm.22289. [DOI] [PMC free article] [PubMed] [Google Scholar]
- 57.Reeder SB, Bice EK, Yu H, Hernando D, Pineda AR. On the performance of T2* correction methods for quantification of hepatic fat content. Magnetic resonance in medicine : official journal of the Society of Magnetic Resonance in Medicine / Society of Magnetic Resonance in Medicine. 2012;67(2):389–404. doi: 10.1002/mrm.23016. [DOI] [PMC free article] [PubMed] [Google Scholar]
- 58.Hansen KH, Schroeder ME, Hamilton G, Sirlin CB, Bydder M. Robustness of fat quantification using chemical shift imaging. Magnetic resonance imaging. 2012;30(2):151–157. doi: 10.1016/j.mri.2011.09.011. [DOI] [PMC free article] [PubMed] [Google Scholar]
- 59.Wen Z, Reeder SB, Pineda AR, Pelc NJ. Noise considerations of three-point water-fat separation imaging methods. Medical physics. 2008;35(8):3597–3606. doi: 10.1118/1.2952644. [DOI] [PMC free article] [PubMed] [Google Scholar]
- 60.Pineda AR, Reeder SB, Wen Z, Pelc NJ. Cramer-Rao bounds for three-point decomposition of water and fat. Magnetic resonance in medicine : official journal of the Society of Magnetic Resonance in Medicine / Society of Magnetic Resonance in Medicine. 2005;54(3):625–635. doi: 10.1002/mrm.20623. [DOI] [PubMed] [Google Scholar]
- 61.Huang Y, Majumdar S, Genant HK, Chan WP, Sharma KR, Yu P, Mynhier M, Miller RG. Quantitative MR relaxometry study of muscle composition and function in Duchenne muscular dystrophy. Journal of magnetic resonance imaging : JMRI. 1994;4(1):59–64. doi: 10.1002/jmri.1880040113. [DOI] [PubMed] [Google Scholar]
- 62.Hines CD, Frydrychowicz A, Hamilton G, Tudorascu DL, Vigen KK, Yu H, McKenzie CA, Sirlin CB, Brittain JH, Reeder SB. T(1) independent, T(2) (*) corrected chemical shift based fat-water separation with multi-peak fat spectral modeling is an accurate and precise measure of hepatic steatosis. Journal of magnetic resonance imaging : JMRI. 2011;33(4):873–881. doi: 10.1002/jmri.22514. [DOI] [PMC free article] [PubMed] [Google Scholar]
- 63.Torriani M, Townsend E, Thomas BJ, Bredella MA, Ghomi RH, Tseng BS. Lower leg muscle involvement in Duchenne muscular dystrophy: an MR imaging and spectroscopy study. Skeletal Radiol. 2012;41(4):437–445. doi: 10.1007/s00256-011-1240-1. [DOI] [PMC free article] [PubMed] [Google Scholar]
- 64.Paradas C, Llauger J, Diaz-Manera J, Rojas-Garcia R, De Luna N, Iturriaga C, Marquez C, Uson M, Hankiewicz K, Gallardo E, Illa I. Redefining dysferlinopathy phenotypes based on clinical findings and muscle imaging studies. Neurology. 2010;75(4):316–323. doi: 10.1212/WNL.0b013e3181ea1564. [DOI] [PubMed] [Google Scholar]