
Figure 5.
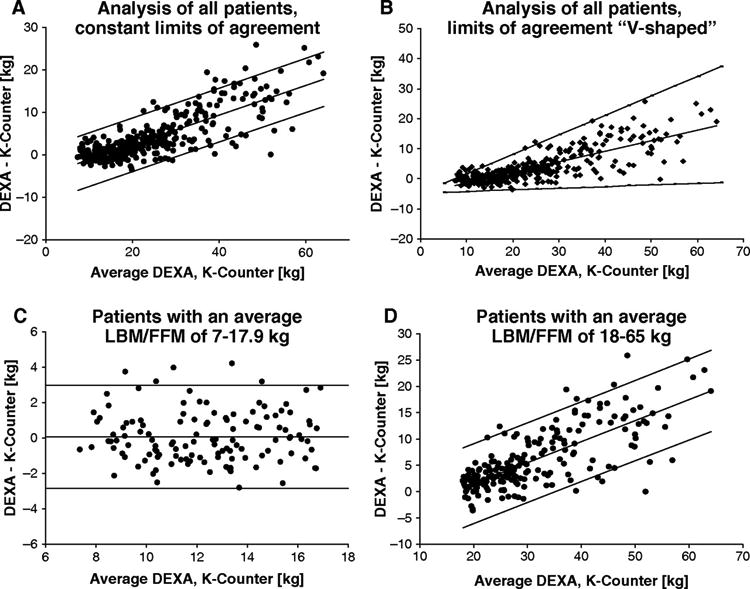
Agreement between lean body mass (LBM; DEXA) and fat-free mass (FFM; K count). The difference between each data pairs is plotted against their mean value (Bland-Altman method).35 Within the plot, the mean bias between the methods is expressed by the middle line and the upper and lower 95% limits of agreement by the respective upper and lower line. (A) Analysis of all patients, constant limits of agreement. (B) Analysis of all patients, limits of agreement V-shaped around the regression line of the differences (mean bias, equation: y = 0.3506x – 4.7275, R2 = 0.6551). (C) Patients with an average LBM/FFM of 7-17.9 kg. (D) Patients with an average LBM/FFM of 18-65 kg.