

Abstract
The Hedgehog (Hh) pathway regulates the growth of a subset of adult gliomas and better definition of Hh-responsive subtypes could enhance the clinical utility of monitoring and targeting this pathway in patients. Somatic mutations of the isocitrate dehydrogenase (IDH) genes occur frequently in WHO grades II and III gliomas and WHO grade IV secondary glioblastomas. Hh pathway activation in WHO grades II and III gliomas suggests that it might also be operational in glioblastomas that developed from lower grade lesions. To evaluate this possibility and to better define the molecular and histopathological glioma subtypes that are Hh-responsive, IDH genes were sequenced in adult glioma specimens assayed for an operant Hh pathway. The proportions of grades II–IV specimens with IDH mutations correlated with the proportions that expressed elevated levels of the Hh gene target PTCH1. Indices of an operational Hh pathway were measured in all primary cultures and xenografts derived from IDH-mutant glioma specimens, including IDH-mutant glioblastomas. In contrast, the Hh pathway was not operational in glioblastomas that lacked IDH mutation or history of antecedent lower-grade disease. IDH mutation is not required for an operant pathway however, as significant Hh pathway modulation was also measured in grade III gliomas with wild-type IDH sequences. These results indicate that the Hh pathway is operational in grades II and III gliomas and glioblastomas with molecular or histopathological evidence for evolvement from lower-grade gliomas. Lastly, these findings suggest that gliomas sharing this molecularly defined route of progression arise in Hh-responsive cell types.
Introduction
The Hedgehog (Hh) pathway is one signaling mechanism that regulates cellular differentiation and whose activity has been implicated in the growth of malignancies [1]. Cellular responses to Hh signaling are regulated by Patched-1 (PTCH1) and Smoothened proteins. PTCH1 functions to suppress the activity of Smoothened and Hh ligand binding to PTCH1 inhibits this function to activate the GLI family of transcription factors [2]. PTCH1 and GLI1 are transcriptional gene targets of Hh signaling, and in the proper context their expression levels can be used to monitor Hh pathway activity in malignancies. Definitive molecular markers of an activated Hh pathway have not been identified, and static measurements of PTCH1 and GLI1 levels in tumor specimens serve only as indicators of potential pathway activation. A role for aberrant Hh signaling in tumorigenesis was first appreciated with the discovery of mutations in Hh signal transduction components conferring ligand-independent pathway activation in medulloblastoma and basal cell carcinoma [3–7]. In contrast to these two tumor types in which clonal deregulation of Hh signaling is driven by mutations in pathway components, ligand-dependent activation of the Hh pathway has been identified in a broader array of malignancies, including those of the lung [8], gut [9, 10], prostate [11, 12], blood [13, 14], and brain [15–21]. In these tumors, the Hh pathway appears to be activated in a small population of cells as reflected by marked cellular heterogeneity in the expression of Hh pathway components. Malignant gliomas contain a population of stem-like cells that manifest enhanced resistance to chemoradiation, promote angiogenesis, and can be prospectively identified by the expression of CD133 among other surface markers [22]. The Hh pathway regulates CD133+ tumor cells [15, 16, 20] and may thus be a target for novel therapeutic strategies. The clinical utility of monitoring and targeting this pathway in patients, however, could be enhanced by better definition of the malignantglioma subtypes that manifest an operational Hh pathway. Where as our prior studies have indicated that Hh signaling is confined to WHO grade II (GII) and III (GIII) oligodendrogliomas, oligoastrocytomas and astrocytomas [17, 20], other groups have reported evidence for pathway activation in some GIV glioblastomas [15, 16, 21]. Taken together, these findings suggest that the Hh pathway may be operational in secondary glioblastomas (sGBM) that evolve from lower grade gliomas. Primary glioblastomas (pGBM), which occur without evidence of antecedent disease, represent >90% of glioblastomas [23, 24]. As clinical trials for Hh antagonists emerge, determining the glioma subtypes in which the pathway is operational could impact inclusion criteria and outcome interpretation. Somatic mutations of the IDH1 and IDH2 genes occur in more than 70% of diffuse astrocytomas, oligodendrogliomas, oligoastrocytomas and secondary glioblastomas, and less than 7% of primary glioblastomas [25–28]. The high frequency of IDH mutations in GII and GIII gliomas and their occurrence in patient tumor specimens prior to the acquisition of either TP53 mutation or loss of 1p/19q has been interpreted to suggest that IDHI mutations are an early event in gliomagenesis in a cell type that can give rise to astrocytic and oligodendroglial tumors [28, 29]. In this study, we sequenced IDH1 and IDH2 in glioma specimens previously annotated for Hh pathway activity [17, 20] and in a larger set of clinical specimens as part of an extensive survey to define the malignant glioma subtypes that manifest an operational Hh pathway.
2. Materials and methods
2.1. Tissue procurement
Brain tumor and epilepsy specimens from adult patients treated at Vanderbilt Medical Center from 2003 to 2008 were obtained in accordance with Institutional Review Board approval. Primary brain tumors were phenotyped and graded using World Health Organization criteria. RNA was extracted for qRT-PCR studies from specimens for which excess tissue was available for banking in a research tissue repository. Gene sequencing was performed and primary cell cultures and direct orthotopic xenograft models were generated from tumor specimens for which adequate excess tissue was available.
2.2. RNA extraction, cDNA synthesis, and qRT-PCR
Total RNA was extracted from brain tissue or primary cell cultures with the RNeasy Mini Kit (QIAGEN). Genomic DNA was removed (RNase-Free DNase Set, QIAGEN) and purified RNA was quantified (RiboGreen RNA Quantitation Kit, Life Technologies). First-strand cDNA synthesis was performed with total RNA (500 ng) using oligo (dT) and random hexamer primers (SuperScript VILO cDNA Synthesis Kit, Life Technologies). For negative controls, reverse transcriptase was omitted from the synthesis reaction (−RT). For all measurements, qRT-PCR was performed in triplicate for each sample and on the corresponding −-RT control. For primary brain tumor and epilepsy specimens, qRT-PCR reactions were performed with SYBR Green Supermix (Bio-Rad), cDNA template, and 200 nM primers for human PTCH1 (exons 20 and 21) and GAPDH [17]. Additionally, measurements in primary brain tumors were corroborated using probes for PTCH1 (Hs00970979_m1, Life Technologies) and GAPDH (Hs99999905_m1, Life Technologies). For qRT-PCR analysis of primary cell cultures and xenografted tumors, reactions were performed with TaqMan Fast Universal PCR Master Mix (Life Technologies), cDNA template, and probes (TaqMan Gene Expression Assay, Life Technologies) for hGLI1 (Hs01110766_m1), hPROM1 (Hs01009261_m1) and hGAPDH (Hs99999905_m1) [20]. For all qRT-PCR measurements, standard curves were generated on serial dilutions of a human cDNA mixture [17]. For each amplicon, quantities were determined according to the standard curve method (User Bulletin #2, PE Applied Biosystems).
2.3. Glioma cell culture and Hh signaling assays
Tumor samples for one GII, four GIII and seven GIV gliomas were dissociated (Papain, Worthington Biochemical Corporation) and plated in DMEM/F12, 10% heat-inactivated FBS, and 1× Penicillin–Streptomycin (Life Technologies) for 1–2 days to allow viable cells to adhere and for the removal of non-adherent debris. Adherent cells were then recovered and plated in non-treated polystyrene flasks (BD-Falcon) in NeuroCult medium with supplements (NeuroCult NS-A Proliferation Kit, Stem Cell Technologies), 2 lg/ml heparin (Sigma), 20 ng/ml EGF (Stem Cell Technologies), 10 ng/ml bFGF (Stem Cell Technologies), and 1× Penicillin–Streptomycin (Life Technologies). The resulting spheres of cells were transferred to non-treated polystyrene multiwell plates (BD-Falcon) and cultured in triplicate either alone, with 50 nM SAG (Smoothened agonist, [30]), with 500 nM SAG or 200 nM SANT1 (Smoothened antagonist 1, ChemBridge). Human GLI1 and GAPDH levels were measured by qRT-PCR as described above.
2.4. Anchorage-independent growth
Growth in soft agar was assayed for low-passage primary cell cultures derived from 4 GII, 7 GIII, and 5 GIV gliomas, an epilepsy specimen (negative control, passage 4) and U87 MG cells (ATCC, positive control). 6-well culture plates were layered with 1.5 ml of 0.4% UltraPure agarose/DMEM/8% heat-inactivated FBS/ Penicillin–Streptomycin (Life Technologies) and allowed to dry. For each well, 10,000 cells were resuspended in 1.5 ml of 0.4% agarose medium, layered onto the 6-well plates and allowed to solidify. Culture medium (DMEM/8% heat-inactivated FBS/Penicillin–Streptomycin, 2 ml) was added to each well and replaced twice weekly. After 6 weeks, cell colonies were counted by phase-contrast imaging with a 10× objective in 10 fields per well. Colonies that were P50 lm in diameter were scored as positive, to discern individual cells that failed to divide from colonies that contained a median number of 10 cells [31, 32].
2.5. IDH1 and IDH2 sequencing
Glioma cDNA libraries were used as templates for specific amplification of IDH1 and IDH2 sequences with primer sequences 50TTCGCCAGCATATCATCCCGGC (IDH1fwd), 50GCAAGCAGCCAAGTCCTTGGTC (IDH1rev), 50TCACCCCTGATGAGGCC CGT (IDH2fwd) and 50TGTACATGCCCATGCCCACGC (IDH2rev). Sanger sequencing was performed on both strands using internal primers 50TGTTGGCGTCAAATGTGCC ACT (IHD1seqF), 50AGCCATTTGGAAGGAACTGTGTGC (IDH1seqR), 50TCACCCCTGAT GAGGCCCGT (IDH2fwd) or 50TGTACATGCCCATGCCCACGC (IDH2rev). IDH sequencing was performed for 116 glioma specimens that included the 26 specimens from which primary cell lines were generated and assayed for Hh signaling (12 Hh signaling assays reported in this study and 14 Hh signaling assays reported else where) [17, 19, 20] and the two specimens from which primary orthotopic glioma xenografts were generated. IDH sequencing was also performed on the derived primary glioma cell lines and primary orthotopic glioma xenografts.
2.6. Cell sorting from primary orthotopic glioma xenografts and gliomas
Primary tumor samples were dissociated with papain (Worthington Biochemical Corporation), and passed through a 40 lm filter. Cells were labeled with a CD133/1 (15 lg/ml, Miltenyi Biotec) antibody crosslinked to magnetic nanoparticles and subjected to immunomagnetic cell separation using the EasySep Magnetic Selection Kit (Stem Cell Technologies). CD133-enriched cells (104–105) were transplanted into the striatum of NSG mice (NOD-scid IL2Rg null, Jackson Laboratory) according to a protocol approved by the Vanderbilt Medical Center Institutional Animal Care and Use Committee. Mice were anesthetized with ketamine and xylazine, and securely placed on a stereotactic frame. Using aseptic surgical procedures, an incision was made in the scalp and a small burr-hole was drilled 2.5 mm lateral to the bregma. CD133-enriched cells were implanted 2.5 mm into the right striatum using a Hamilton syringe. Mice were euthanized after developing symptoms of tumor engraftment (significant and sustained weight loss over time). Harvested brains were placed in a slicer matrix (Zivic Instruments) and tumor was dissected from 1 mm coronal slices for papain dissociation. Dissociated cells from xenografted material or primary gliomas were labeled with CD133/1-APC antibody (1:10, Miltenyi Biotec) and fluorescence-activated cell sorting was performed (FACSAria II, BD Biosciences). qRT-PCR for hGLI1, hPROM1 and hGAPDH was performed on unsorted and sorted cells as described above.
2.7. Immunohistochemistry
Formalin-fixed paraffin-embedded tissue sections were processed for antigen retrieval in a pressure cooker with 10 mM Citrate Buffer/0.05% Tween-20, pH 6.0, and then treated with 0.01% H2O2 and 0.01% donkey serum (Jackson Labs). Slides were stained with IDH1 R132H antibody (1:50, Dianova) and immunoenzymatic detection was achieved with the HiDef HRP Polymer System (Cell Marque) according to the manufacturer’s instructions, using 3, 30-diaminobenzidine (half-strength) as the chromogen. For slides stained with PTCH antibody (1:100, Everest Biotech), immunoenzymatic detection was performed with the ImmPRESS Anti-Goat Peroxidase Polymer Detection Kit (Vector Laboratories) according to the manufacturer’s instructions. The slides were then counter stained with Hematoxylin QS (Vector Laboratories).
2.8. IDH1 mutagenesis, cell transfection and metabolite extraction
Point mutations (R132H, R132G, R132S and Y183C) were introduced into the IDH1 open reading frame by PCR site-specific mutagenesis (Quick change II XL Site Directed Mutagenesis Kit, Strata gene) using pCMV6-Entry wild-type IDH1 vector (OriGene) as a cDNA template. All mutations were verified by sequence analysis (GenePASS). Human embryonic kidney cells (HEK 293T/17, ATCC) plated in 6-well plates were co-transfected (FuGene 6, Roche) with IDH1 R132H expression plasmid over a range of 12.5–3200 ng, in two fold increments, and variable amounts of empty vector (pCMV6-Entry vector) to normalize the total DNA quantity in each well. In subsequent experiments, HEK 293T cells cultured in 6-well plates were transfected with 4 lg per well of IDH1 plasmid containing wild-type sequences or point mutations (Y183C, R132H, R132S or R132G). After 48h metabolites were extracted using 80% aqueous methanol as described [33, 34] and processed by LC-MS/MS. Total protein was calculated (Micro BCA Protein Assay Kit, Pierce Thermo Scientific) in cell lysates and culture medium. 2-hydroxyglutarate measured in cell lysates was normalized to total protein in the cell lysate and in the medium it was normalized to the volume analyzed.
2.9. 2-Hydroxyglutarate measurements by LC-MS/MS
A novel isotope-labeled 13C4-2HG was synthesized by chemical reduction of 13C4-aKG (Cambridge Isotope Laboratories, Inc.). Briefly, 13C4-aKG was dissolved in ethanol at room temperature and stirred with equimolar sodium borohydride for 30 min. A calculated 90% yield was determined by LC-MS for this isotopically labeled internal standard product (1,2,3,4-13C4-2HG), and no residual unlabeled 2HG was observed in this synthetic standard. The internal standard was found to be stable when stored in water at −20°C until use. Additions of 13C4-2HG internal standard were made to 0.30 ml cell growth media and/or 0.05 ml cell lysate. Cell lysates were further diluted with 0.05 ml water, and all samples were centrifuged to remove insoluble media components. The supernatants were deproteinized by membrane dialysis (5kDa MWCO, 1h, 15°C, 10,000 µg). The clear filtrate was removed and injected for analysis. Cell culture samples were analyzed for 2HG on a Thermo Scientific LTQ linear ion trap mass spectrometer (Thermo Scientific) equipped with an Ion Max HESI source and software-controlled 6-port divert valve. The instrument was tuned and calibrated monthly over a mass range of m/z 195–1822 using a mixture of caffeine, MRPhA and Ultramark 1621 according to the manufacturer’s autotune procedure. A dual SAX-reverse phase HPLC system consisting of two Survey or MS Pumps, a Thermo-Pal HTC Auto sampler (Thermo-Fisher), and a tributylammonium acetate (TBAA) ion pair reagent was used for all chromatographic separations. A schematic illustration of the dual HPLC system (Supplementary Fig. 2A) and characterization of LC-MS/MS assay accuracy and precision (Supplementary Fig. 2B) are available in Supplementary Information.
2.10. IDH1 expression and Hh signaling assays in NIH 3T3 cells
Hh signaling assays in NIH 3T3 cells were performed as previously described [35]. Briefly, mouse embryonic fibroblasts (NIH 3T3) plated in 12-well plates were transfected (FuGene 6, Roche) with 600 ng of Gli-reporter (pGL3–8×Gli-luciferase) and pCMV-LacZ, (a transfection control with a 9:1 ratio of Gli-reporter:LacZ) and 700 ng of IDH1 plasmid per well (pCMV6-Entry vector, IDH1, R132S, R132G, and Y183C). Twelve hours later, cells were induced with varying amounts of Shh protein in low-serum medium (0.5% calf serum) and cultured for an additional forty hours. Data shown was normalized with the highest value set at 100. In additional experiments, NIH 3T3 cells were transfected (FuGene 6, Roche) with IDH constructs (IDH1, R132S, R132G, and Y183C) over a range of 100 –1600 ng in two fold increments, 700 ng of Gli-reporter and pCMV-LacZ (9:1 ratio of Gli-reporter:LacZ), and variable amounts of empty vector (pCMV6-Entry) to normalize the total DNA quantity in each well. Twelve hours later, cells were induced with Shh protein in low-serum medium (0.5% calf serum) and cultured for an additional forty hours. Chemiluminescence (Dual-Light Luciferase and b-Galactosidase Reporter Gene Assay System, Life Technologies) was measured in lysed (Passive Lysis Buffer, Promega) NIH 3T3 cells as directed by the manufacturer (FLUOstar Omega, BMG Labtech).
2.11. Statistical analysis
PTCH1 mRNA levels in gliomas were analyzed by one-way ANOVA with Tukey–Kramer post test. Significance for Anchorage independent growth assays was determined by unpaired T-test. The half-maximal excitatory concentrations (EC50) were determined by obtaining the non-linear regression (sigmoidal dose response curves with variable slope) of transformed (X=Log(X)) and normalized (highest value set at 100) data. Significance was determined using one-way ANOVA with Bonferroni’s post test. Data are presented as either ± SEM or ± SD and specified within the text. P 60.05 was considered significant. All statistical analyses were performed using GraphPad Prism.
3. Results
3.1. Similar pattern of elevated PTCH1 expression and IDH gene mutation in World Health Organization grades II, III and IV gliomas
PTCH1 and GLI1 are Hh pathway components and gene targets whose expression levels have been most commonly measured as indicators of pathway activation. As metrics of pathway activation, the selection of either gene target can be optimized according to experimental context. At the outset of our studies, PTCH1 and GLI1 expression were measured in epilepsy specimens to determine baseline levels for comparison with measurements in glioma specimens. PTCH1 transcript expression was detected and measured at relatively similar levels in all of the epilepsy specimens (Fig. 1A) whereas GLI1 transcript could not be detected in a third of the epilepsy specimens and detectable expression levels were more variable (Supplementary Fig. 1A). Discordant PTCH1 and GLI1 expression levels have been reported in tumor specimens [16, 36], and GLI1 expression has been detected in the absence of PTCH1 expression in colon tumors that are not Hh-responsive in signaling assays [9]. Based upon these observations, in this study PTCH1 levels were measured in tumor specimens as a static indicator of pathway activity. In signaling assays with mouse embryonic fibroblasts (Supplementary Fig. 1B) and glioma cells [17], where basal levels of PTCH1 and GLI1 can be measured for comparison, GLI1 expression is induced to higher levels than PTCH1 by pathway activation. Therefore, in this study GLI1 expression levels were measured in signaling assays and isolated tumor cells as a more sensitive indicator of pathway activation.
Fig. 1.
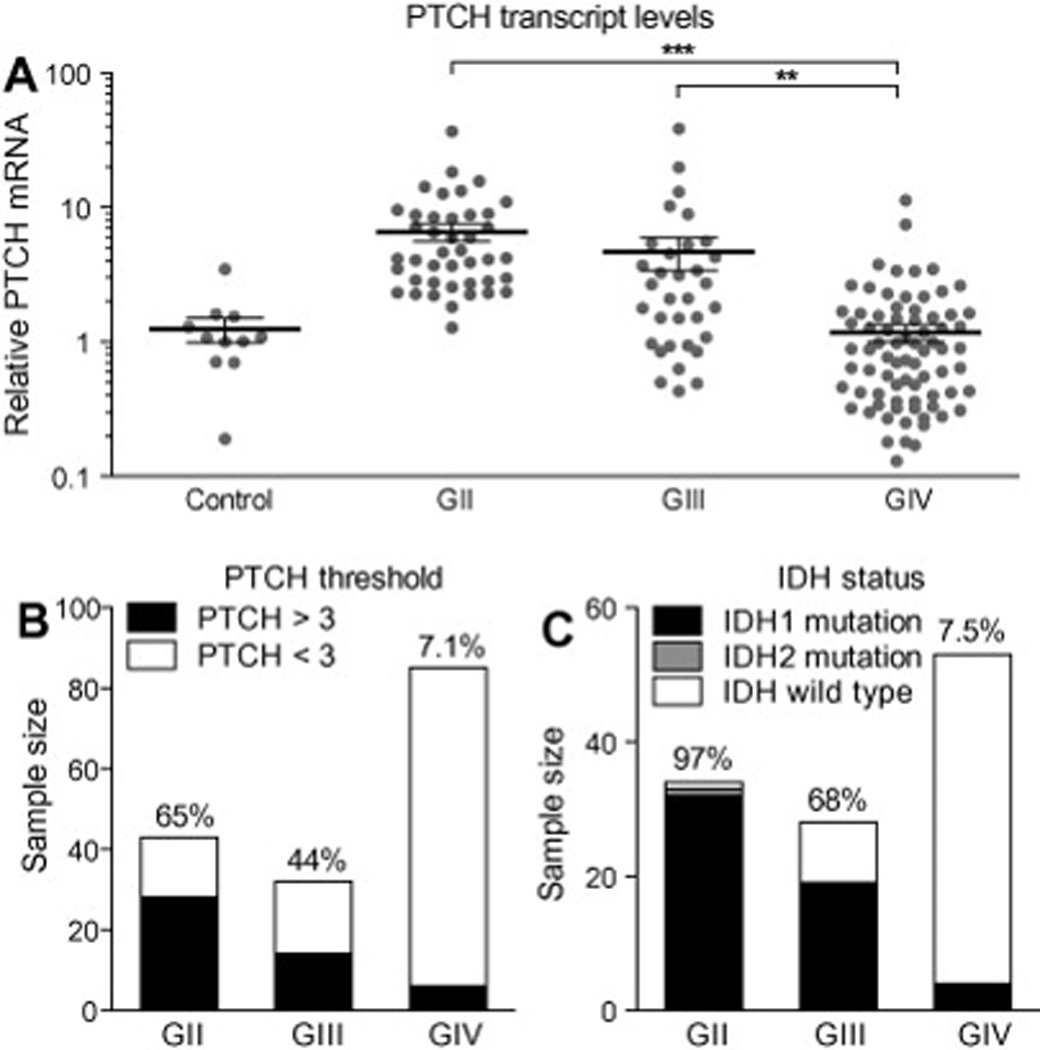
Similar pattern of elevated PTCH1 expression and IDH gene mutation in World Health Organization grades II, III and IV gliomas. (A) Scatter plot of PTCH1 expression levels measured in control and glioma specimens revealed significant elevation of PTCH1 levels in GII and GIII gliomas. For each group, the mean expression level and standard error of measurement is represented with black lines. (B) PTCH1 mRNA levels were three fold greater than those of control epilepsy specimens in 28/43 GII, 14/34 of GIII and 6/ 83 GIV glioma specimens. (C) Heterozygous mutations at arginine R132 of IDH1 were detected in 32/34 GII, 19/28 GIII and 4/54 GIV gliomas. Heterozygous mutation at arginine R172 of IDH2 was detected in one GII oligodendroglioma. ## P<0.01; ### P<0.001 (Post-hoc analysis of one-way ANOVA).
To extend the prior analysis of 46 glioma specimens[17], PTCH1 mRNA levels were measured by quantitative real time PCR (qRTPCR) in 114 adult GII–IV glioma specimens. In all glioma (n=160) and control (n=11) specimens, PTCH1 levels were normalized to endogenous GAPDH levels and expressed as the fold difference relative to control samples resected from patients with epilepsy. The relative PTCH1 mRNA levels were 1.24±0.25 in control tissues (n=11) and 6.56±0.97 in GII (n=43), 4.69±1.28 in GIII (n=33) and 1.17±0.18 in GIV (n=84) gliomas (mean±s.e.m.) (Fig. 1A). One-way analysis of variance revealed significant differences in the mean glioma PTCH1 levels (P<0.0001), with significantly elevated mean PTCH1 values measured in GII and GIII gliomas compared to GIV gliomas (P<0.01) by post hoc analysis. Within GII and GIII tumors, elevated PTCH1 expression was measured in astrocytomas and oligodendrogliomas with equal frequency (data not shown). To estimate the proportion of gliomas in which the Hh pathway might be activated, threshold analysis was applied. Among control epilepsy specimens, the highest relative PTCH1 level measured was threefold greater than the mean (Fig. 1A). Glioma PTCH1 mRNA levels were elevated above the mean for control epilepsy samples by a level of >3 fold in 65% of GII, 44% of GIII and 7% of GIV glioma specimens (Fig.1B). The pattern of PTCH1 elevation in samples encompassing a larger cohort supported our prior interpretation that the Hh pathway is commonly activated in GII and GIII gliomas [17, 20]. Contrary to our prior findings and consistent with those of other studies [15, 16, 21], however, the pattern of PTCH1 elevation in a larger cohort of specimens suggests that the Hh pathway may also be activated in a subset of GIV glioblastomas. Furthermore, the pattern of elevated PTCH1 expression paralleled the pattern of IDH mutations reported in malignant glioma subtypes [25, 26, 28]. To evaluate this similarity, we sequenced IDH1 and IDH2 in 116 of the malignant glioma specimens selected to include those for which high and low levels of PTCH1 mRNA had been measured or for which primary cell cultures or xenografts had been generated. Mutations at arginine R132 of IDH1 or R172 of IDH2 were detected in 33 of 34 (97%) of GII gliomas, 19 of 28 (68%) of GIII gliomas and 4 of 49 (6.8%) glioblastomas (Fig. 1C). Of the four GBM with IDH1 mutations, by histopathological and clinical data, two were diagnosed as sGBM, one as pGBM and one as recurrent GBM (recGBM) with prior resection 14 months earlier. One of the sGBM in our collection had histopathological evidence of an anaplastic astrocytoma resected 15 months earlier, and both specimens were wild-type for IDH. The similar frequencies of GBM with elevated PTCH1 mRNA levels and IDH mutations suggest that the Hh pathway may be activated in a subset of GBM as well as GII and GIII gliomas. To evaluate this possibility and corroborate the qRT-PCR results, immunohistochemical staining for PTCH expression was performed on 11 adult gliomas. Scattered PTCH-positive cells were observed in 3/3 GII, 4/4 GIII and 1/4 GBM (Fig. 2 and data not shown). Consistent with the idea that the Hh pathway may be activated in a subset of GBM characterized by IDH mutation, PTCH staining was observed only in an IDH mutant GBM and not in three other GBM that were wild-type for IDH (Fig. 2E–H).
Fig. 2.
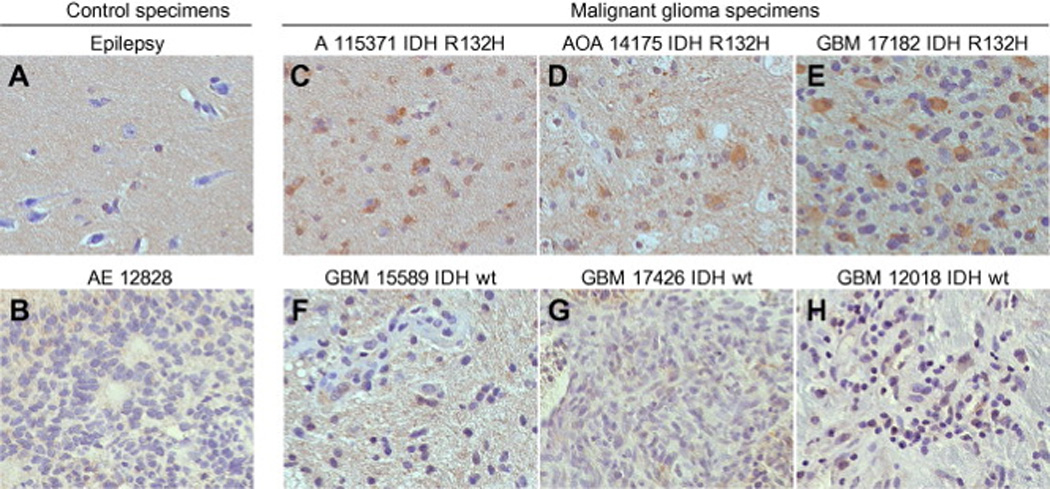
PTCH protein expression in World Health Organization grades II–IV gliomas. (A–H) PTCH staining in paraffin-embedded patient specimens. (A and B) Immunostaining to control for background signal in hypocellular and hypercellular patient material included an epilepsy specimen (A) and an anaplastic ependymoma specimen (B), respectively. (C–H) In gliomas with oligodendroglial and astrocytic differentiation, PTCH immunostaining was detected in 3/3 GII and 4/4 GIII specimens (C and D and data not shown). In GBM, PTCH staining was detected only in a specimen with an IDH mutation (E) and not in specimens with wild-type IDH (F–H).
3.2. Manifestation of an operational Hh pathway in secondary glioblastoma
We have previously concluded that the Hh pathway is not operant in pGBM based on the absence of a Hh response in signaling assays on primary cell cultures generated from 6 patient specimens [17, 20]. To assess further the operational status of the Hh pathway GIV gliomas, glioma sphere cultures were generated from IDH mutant (n=3) and IDH wild-type (n=4) GBM specimens and assayed under stem cell culture conditions [17]. Significant induction of GLI1 mRNA was measured in all 3 IDH mutant GBM cultures and an IDH wild-type sGBM (Fig. 3A–D). Interestingly, the level of GLI1 induction in the IDH wild-type sGBM (Fig. 3D) was very low and nearly identical to that measured in the anaplastic astrocytoma from which it evolved (Fig.3E). Conversely, GLI1 mRNA levels could not be modulated by the addition of Smoothened agonist or antagonist in glioma spheres generated from the three IDH wild type pGBM (Fig. 3F and data not shown).
Fig. 3.
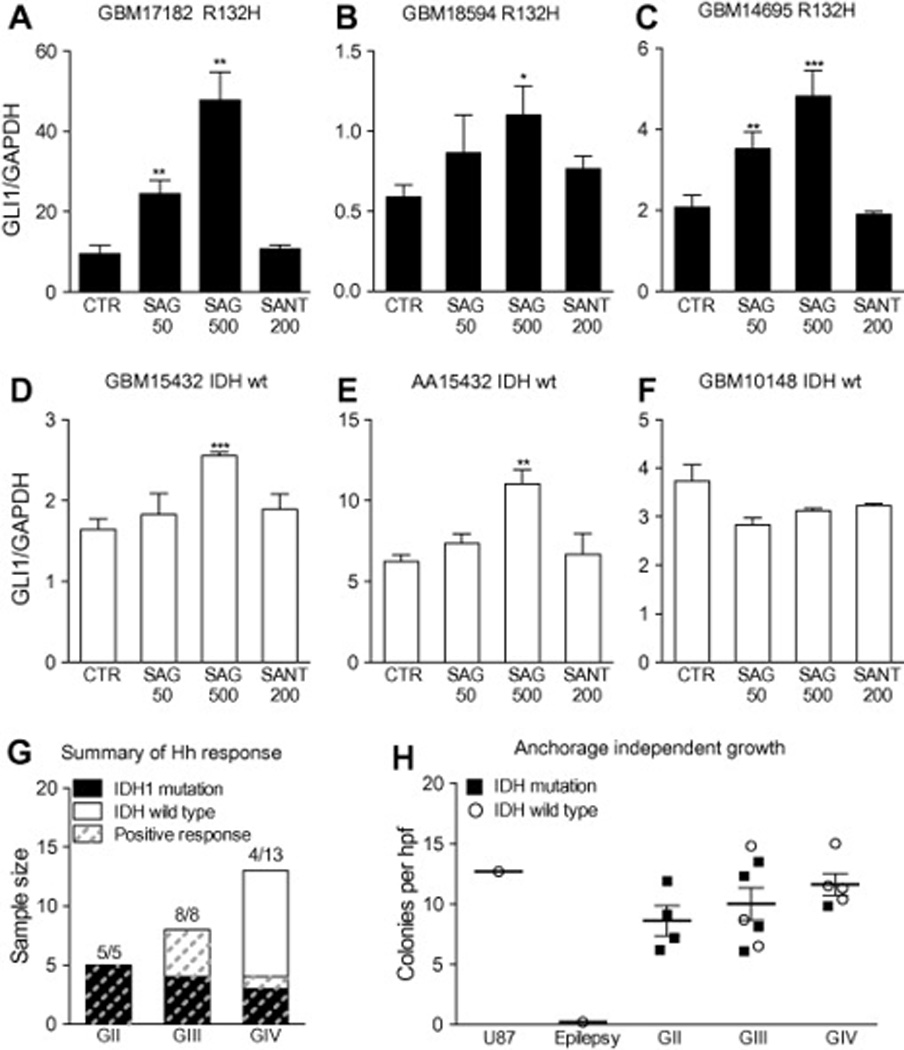
Manifestation of an operational Hh pathway in secondary glioblastoma characterized by IDH1 mutation or progression from an anaplastic astrocytoma. (A–F) Glioma spheres generated from three glioblastomas with R132H IDH1 mutation (GBM 17182, GBM 18594 and GBM 14695), a secondary glioblastoma without IDH1 or IDH2 mutations (GBM 15432), an anaplastic astrocytoma from which GBM 15432 evolved (AA 15432), and a primary glioblastoma without IDH mutation (GBM 10148). The glioma spheres were cultured for 36 h either alone (control, CTR), with Smoothened agonist (SAG 50 nM or 500 nM), or Smoothened antagonist 1 (SANT 200 nM). In triplicate wells for each cell line and culture condition, the GLI1 mRNA levels were normalized to GAPDH and expressed relative to the untreated control cultures with error bars denoting standard deviation. A dose-dependent response to SAG was measured in all of the glioma spheres except those cultured from pGBM 10148. (G) Summary of IDH sequence, histological grade and Hh response in 26 signaling assays. (H) Independent of IDH mutational status, primary cells cultured from GII–GIV gliomas form colonies in soft agar (number of colonies P50 lm per field). ! P<0.05; !! P<0.01; !!! P<0.001 (Unpaired T-test).
To examine more broadly the relationship between IDH mutation and the operational status of the Hh pathway in gliomas, IDH sequences were analyzed for the primary tumor specimens from which cell lines had been derived and assayed for Hh signaling in prior studies (n=14) and in this study (n=12) [17, 19, 20]. For these assays, significant induction of GLI1 mRNA measured in 5 of 5 GII, 8 of 8 GIII and 4 of 13 GIV glioma spheres (Fig. 3G). Analysis of IDH sequence with respect to WHO grade and Hh signal response revealed that an operational Hh pathway could be measured in all cultures derived from IDH mutant gliomas (Fig. 3G). Not all Hh-responsive GIII gliomas contained IDH mutations, however, suggesting that IDH mutation may not be required to manifest an operational pathway. In GIV gliomas, a responsive Hh pathway was measured only in GBM with IDH mutation or histopathological evidence of progression from a lower grade glioma (Fig. 3G). Thus, in the absence of histopathological evidence to support the diagnosis of sGBM, the presence of an IDH mutation may serve as a molecular marker of Hh-responsive high grade gliomas.
IDH mutation is commonly lost in glioma cell culture [37], and only two cell lines that retain IDH1 mutation in culture have been reported [38, 39]. Sequence analysis of the primary cell lines that we generated from IDH mutant gliomas revealed loss of the mutation in all instances (Fig. 4A and data not shown). The mechanism by which IDH mutation is lost in cell culture is unknown, though it has been suggested that only viable non-tumor cells remain in culture following the elimination of IDH mutant tumor cells [37]. To evaluate this possibility, we assayed primary cell lines derived from gliomas and an epilepsy specimen for the property of colony formation in soft agar. Anchorage-independent growth was observed only in the tumor cell lines, and independent of the IDH mutation status of the parent tumor (Fig. 3H). These results indicate that a transformed phenotype was maintained despite the loss of IDH mutation in cell culture. Although a transformed phenotype was maintained, clear interpretation of the influence of IDH mutation on Hh response in vitro is complicated by the loss of mutation in culture. The sequencing results, however, do not alter interpretation of the differential Hh responses measured in cell lines derived from gliomas with wild-type IDH sequences; the Hh pathway was modulated in cells cultured from IDH wild-type GIII gliomas, but not in cells cultured from IDH wild-type pGBM. We have previously reported that pharmacological inhibition of the Hh pathway in GIII glioma xenografts confers a survival advantage [20]. To gain a better appreciation of the influence of IDH mutation on Hh pathway modulation in vivo, we sequenced the tumors from three primary orthotopic glioma xenograft models that were characterized for pathway responsiveness [20]. The parent tumor and engrafted tumor specimens contained an IDH1 R132H mutation for the Hh-responsive GIII oligoastrocytoma model and wild-type IDH sequences for the Hh-responsive GIII astrocytoma and Hh-unresponsive pGBM models (Table 1). The retention of IDH1 R132H mutation in the Hh-responsive GIII oligoastrocytoma xenograft provides strong evidence for an operational Hh pathway in the presence of IDH mutation. Additionally, the wild-type IDH sequence of the Hh-responsive GIII astrocytoma xenograft is consistent with the interpretation that IDH mutation is not required for an operational pathway in lower grade gliomas.
Fig. 4.
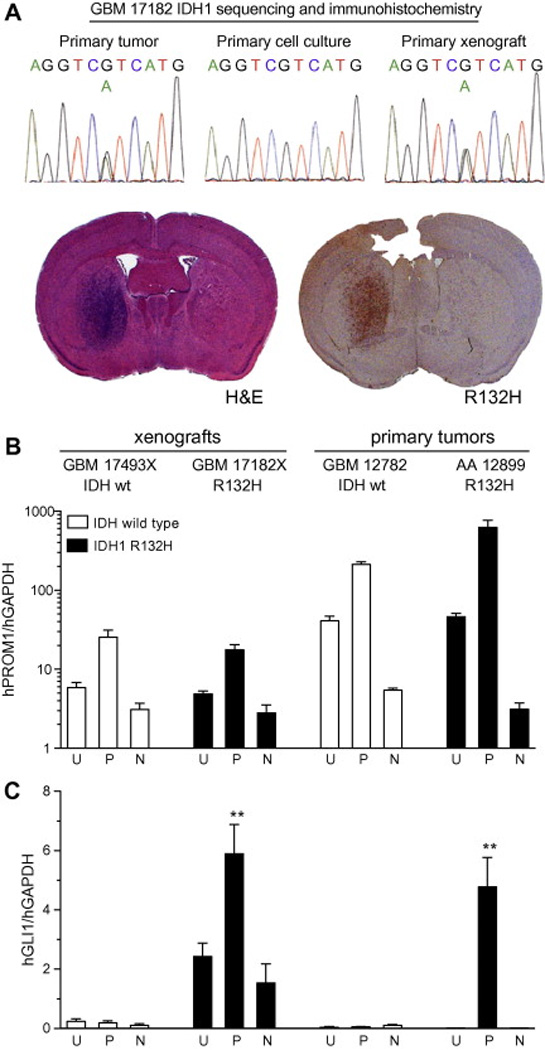
Elevated GLI1 transcript expression in CD133+ cells isolated from glioblastoma with IDH mutation. (A) IDH1 R132H mutation is maintained in a primary orthotopic GBM mouse xenograft (GBM 17182X), as demonstrated by gene sequencing and R132H antibody staining. (B–C) Cell suspensions generated from two orthotopic GBM xenografts (GBM 17493X without IDH mutation and GBM 17182X with IDH1 R132H mutation) and two primary gliomas (GBM 12782 without IDH mutation and AA 12899 with IDH1 R132H mutation), were stained with CD133/1 antibody, subjected to fluorescence-activated cell sorting and analyzed by quantitative RT-PCR with human-specific primers. (B) Compared to unsorted cells (U), human Prominin-1 (hPROM1) levels were enriched and depleted in cells sorted for positive (P) and negative (N) CD133 staining, respectively, from all tumors. (C) Relative human GLI1 (hGLI1) levels were low in IDH wild-type glioblastoma cells (GBM 17493X and GBM 12782) and not significantly altered by sorting. In the IDH1 R132H mutant glioblastoma xenograft (GBM 17182X) and anaplastic astrocytoma (AA 12899), hGLI1 levels were higher and enriched or depleted in cells sorted for positive or negative CD133 staining, respectively.
Table 1.
IDH sequence and status of Hh pathway in three primary glioma xenograft models.
| GIII oligoastrocytoma | GIII astrocytoma | GIV GBM | |
|---|---|---|---|
| Tumor sequence | R132H | Wild-type | Wild-type |
| Xenograft sequence | R132H | Wild-type | Wild-type |
| Hh responsivea | Yes | Yes | No |
3.3. Elevated GLI1 transcript expression in CD133+ cells isolated from glioblastoma with IDH mutation
In order to evaluate the relationship between the presence of IDH mutation and Hh pathway operational status in glioblastoma, we analyzed a GBM orthotopic xenograft that retained IDH1 R132H mutation in the engrafted tumor (Fig. 4A). Within the heterogeneous cell types of glioma, the Hh pathway regulates CD133+ cells [15, 16] and, correspondingly, Hh gene target expression segregates with CD133 expression in Hh-responsive gliomas [20]. CD133 positive and negative cells were isolated by fluorescence-activated cell sorting (FACS) from the IDH1 mutant GBM xenograft, two IDH wild-type GBMs (one xenograft and one tumor specimen) and an IDH1 mutant anaplastic astrocytoma specimen (positive control). In both IDH mutant and wild-type tumors, human Prominin-1 (hPROM1, which encodes CD133) transcript levels were greatly enriched and depleted in cells sorted for positive and negative CD133 antibody staining, respectively (Fig. 4B). Conversely, hGLI1 levels were enriched in CD133+ cells only when sorted from the IDH1 mutant GBM xenograft and analplastic astrocytoma (Fig. 3C). Taken together with sequencing results of tumors assayed for Hh signaling in vitro and in vivo, these findings fortify the utility of IDH mutation as a molecular marker to identify Hh responsive GBM.
3.4. IDH mutation is not required for Hh signal response
While IDH mutation can be used to identify Hh-responsive GBM, significant pathway modulation in GIII gliomas with wild type IDH sequences (Fig. 3G and Table 1) suggests that IDH mutation is not required for an operant pathway. To directly determine whether IDH mutation influences Hh signaling, pathway response was assayed in fibroblasts transfected with wild-type or mutant IDH1 expression constructs (Fig. 5A–D). The production of 2 hydroxyglutarate by expression of IDH1 with mutation at R132 was confirmed with LC-MS/MS (Fig. 5A and B). Overexpression of wild-type IDH1, IDH1 bearing a polymorphism at Y183 (an additional wild-type control), or IDH1 with mutation at R132 did not alter a dose-dependent response to Sonic hedgehog (Shh) ligand (Fig. 5C). Furthermore, the pathway response to a constant level of Shh stimulation was not enhanced or inhibited by the expression level of wild-type, polymorphic or mutant IDH1 constructs (Fig. 5D). Together, these data indicate that IDH1 mutation and 2-hydroxyglutarate levels do not impact Hh pathway response.
Fig. 5.
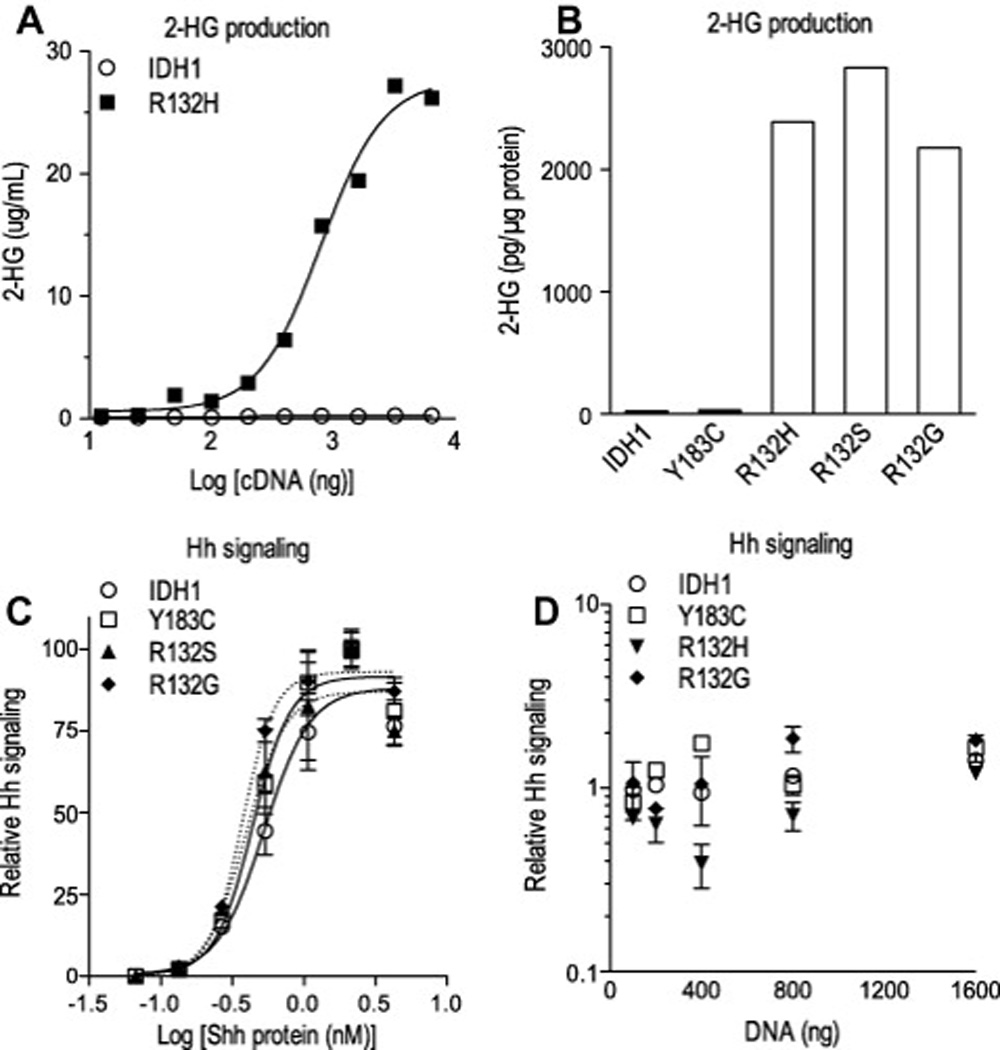
IDH mutation is not required for Hh signal response. (A–D) 2-hydroxyglutarate (2-HG) levels measured by mass spectrometry in the media (A) and lysate (B) of transfected HEK 293T cells confirm that IDH1 expression constructs mutated at arginine R132 (R132H, R132S and R132G) confer production of the on cometabolite whereas the introduction of a polymorphic mutation (Y183C) does not. (C–D) NIH 3T3 cells were co-transfected with expression plasmids for IDH1, Gli-reporter (8× Gli-luciferase) and LacZ, changed to low-serum medium containing Shh protein and then analyzed for chemiluminescence. Dose-dependent Gli-reporter activity to increasing levels of Shh protein was not altered by the co-expression of wild-type or mutant IDH1 cDNA. Differences in the half maximal effective concentration (EC50) of Shh ligand measured in presence of IDH1 wild type (0.53), Y183C polymorphism (0.44), R132G (0.37) and R132S (0.39) expression did not reach statistical significance (P>0.1; one-way ANOVA with Bonferroni’s post test) (C). At a constant level of Shh ligand exposure, Gli-reporter activity was not significantly increased or decreased by co-transfection of IDH1 expression plasmids over a broad range (100–1600 ng per well) of cDNA concentrations (D). Solid and dotted lines denote non-linear regression analysis.
4. Discussion
The Hh signaling pathway regulates glioma growth and is thus relevant for gaining a better understanding of glioma biology and identifying therapeutic targets. Defining glioma subgroups in which the Hh pathway is operational is therefore important for preclinical studies and their extension to clinical trials. Based upon an extensive survey of patient specimens, we report that the Hh pathway is operational in astrocytomas, oligodendrogliomas, and oligoastrocytomas, and in a subgroup of glioblastomas delineated by IDH1 mutation or clinical evidence for progression from a lower grade glioma. Determining whether a particular tumor is Hh responsive has been hindered by the lack of definitive assays for pathway activation and by tumor heterogeneity. For example, in several instances among GII and GIII gliomas we measured low Hh target gene expression and yet robust pathway induction in primary cell cultures generated from the same tumor specimen. This discrepancy is consistent with the presence of an operational Hh pathway that has not been activated, or heterogeneity with respect to gene target expression in the portion of tumor sampled for qRTPCR measurements and the portion used to generate a primary cell culture for a signaling assay. The reliance upon relative levels of Hh gene target expression in tumor specimens and the more cumbersome aspects of generating primary cell cultures or xenografts for signaling assays to define Hh-responsive gliomas underscore the need for a more readily applicable surrogate marker. In this study, we found evidence for an operant Hh pathway in every glioma harboring an IDH mutation, demonstrating that IDH mutation may serve as a marker to identify Hh-responsive gliomas. The value of this finding is particularly evident in the case of glioblastoma where we were able to identify Hh-responsive tumors by IDH mutation from within a larger collection of unresponsive IDH wild-type GIV gliomas. Sequence analysis for IDH mutations and immunohistochemistry with an IDH1 antibody specific for the most frequent mutation, R132H [40], represent highly specific and sensitive assays that are gaining routine use in the realms of histopathology, translational investigation and clinical trial [26, 41, 42]. The very high frequency of IDH mutation in oligodendrogliomas, oligoastrocytomas, astrocytomas and sGBM has been interpreted to suggest that it is an early genetic alteration in a common cell of origin that is distinct from the cellular origin for pGBM [28, 29, 43]. Our findings suggest a model where GII gliomas, GIII gliomas and sGBM arise from a Hh-responsive cell type, or types, whereas pGBM arise from cell types that are not Hh responsive (Fig. 6). In this context it is not surprising that some Hh responsive gliomas did not contain IDH mutations. Although the cellular origins of gliomas remain unknown, comprehensive genomic studies have identified robust glioma subgroups with molecular signatures reflecting distinct cellular types and perhaps origins [44]. In each instance, specific genetic alterations that characterize a particular glioma subgroup are not present in every tumor contained in that subgroup. In the Proneural subgroup that encompasses GIII gliomas and sGBM, for example, IDH mutation occurs in only a portion of the gliomas that otherwise share a common gene expression profile [45, 46]. Thus while IDH mutation typifies GII gliomas, GIII gliomas and sGBM, it is not required for classifying these glioma subtypes according to histopathological or transcriptome criteria. In this regard, IDH mutation characterizes Hh responsive gliomas encompassing a spectrum of ensuing grades of malignancy. The maintenance of an operational pathway in each grade supports the potential importance of Hh signaling in glioma progression.
Fig. 6.

Supplementary Material
Acknowledgements
This material is based upon work supported by the Department of Veterans Affairs, Veterans Health Administration, Office of Research and Development, Biomedical Laboratory Research and Development through grant 1 I01 BX000744-01. The contents do not represent the views of the Department of Veterans Affairs or the United States Government. We thank Dr. David L. Hachey for guidance on LC-MS/MS assay development, Dr. Claudio A. Mosse and Catherine E. Alford in the Veterans Affairs Tennessee Valley Healthcare System Flow Cytometry Research Facility for guidance and assistance with cell sorting, and Drs. Anna M. Kenney and Reid C. Thompson for discussions.
Appendix A. Supplementary data
Supplementary data associated with this article can be found, in the online version, at http://dx.doi.org/10.1016/j.canlet.2012. 10.002.
References
- 1.Barakat MT, Humke EW, Scott MP. Learning from Jekyll to control hyde: Hedgehog signaling in development and cancer. Trends Mol. Med. 2010;16:337–348. doi: 10.1016/j.molmed.2010.05.003. [DOI] [PMC free article] [PubMed] [Google Scholar]
- 2.Ingham PW, McMahon AP. Hedgehog signaling in animal development: paradigms and principles. Genes Dev. 2001;15:3059–3087. doi: 10.1101/gad.938601. [DOI] [PubMed] [Google Scholar]
- 3.Hahn H, Wicking C, Zaphiropoulous PG, Gailani MR, Shanley S, Chidambaram A, Vorechovsky I, Holmberg E, Unden AB, Gillies S, Negus K, Smyth I, Pressman C, Leffell DJ, Gerrard B, Goldstein AM, Dean M, Toftgard R, Chenevix-Trench G, Wainwright B, Bale AE. Mutations of the human homolog of Drosophila patched in the nevoid basal cell carcinoma syndrome. Cell. 1996;85:841–851. doi: 10.1016/s0092-8674(00)81268-4. [DOI] [PubMed] [Google Scholar]
- 4.Johnson RL, Rothman AL, Xie J, Goodrich LV, Bare JW, Bonifas JM, Quinn AG, Myers RM, Cox DR, Epstein EH, Jr, Scott MP. Human homolog of patched, a candidate gene for the basal cell nevus syndrome. Science. 1996;272:1668–1671. doi: 10.1126/science.272.5268.1668. [DOI] [PubMed] [Google Scholar]
- 5.Lam CW, Xie J, To KF, Ng HK, Lee KC, Yuen NW, Lim PL, Chan LY, Tong SF, McCormick F. A frequent activated smoothened mutation in sporadic basal cell carcinomas. Oncogene. 1999;18:833–836. doi: 10.1038/sj.onc.1202360. [DOI] [PubMed] [Google Scholar]
- 6.Taylor MD, Liu L, Raffel C, Hui CC, Mainprize TG, Zhang X, Agatep R, Chiappa S, Gao L, Lowrance A, Hao A, Goldstein AM, Stavrou T, Scherer SW, Dura WT, Wainwright B, Squire JA, Rutka JT, Hogg D. Mutations in SUFU predispose to medulloblastoma. Nat. Genet. 2002;31:306–310. doi: 10.1038/ng916. [DOI] [PubMed] [Google Scholar]
- 7.Zurawel RH, Allen C, Chiappa S, Cato W, Biegel J, Cogen P, de Sauvage F, Raffel C. Analysis of PTCH/SMO/SHH pathway genes in medulloblastoma. Genes Chromosomes Cancer. 2000;27:44–51. doi: 10.1002/(sici)1098-2264(200001)27:1<44::aid-gcc6>3.0.co;2-v. [DOI] [PubMed] [Google Scholar]
- 8.Watkins DN, Berman DM, Burkholder SG, Wang B, Beachy PA, Baylin SB. Hedgehog signalling within airway epithelial progenitors and in small-cell lung cancer. Nature. 2003;422:313–317. doi: 10.1038/nature01493. [DOI] [PubMed] [Google Scholar]
- 9.Berman DM, Karhadkar SS, Maitra A, Montes De Oca R, Gerstenblith MR, Briggs K, Parker AR, Shimada Y, Eshleman JR, Watkins DN, Beachy PA. Widespread requirement for Hedgehog ligand stimulation in growth of digestive tract tumours. Nature. 2003;425:846–851. doi: 10.1038/nature01972. [DOI] [PubMed] [Google Scholar]
- 10.Yauch RL, Gould SE, Scales SJ, Tang T, Tian H, Ahn CP, Marshall D, Fu L, Januario T, Kallop D, Nannini-Pepe M, Kotkow K, Marsters JC, Rubin LL, de Sauvage FJ. A paracrine requirement for Hedgehog signalling in cancer. Nature. 2008;455:406–410. doi: 10.1038/nature07275. [DOI] [PubMed] [Google Scholar]
- 11.Fan L, Pepicelli CV, Dibble CC, Catbagan W, Zarycki JL, Laciak R, Gipp J, Shaw A, Lamm ML, Munoz A, Lipinski R, Thrasher JB, Bushman W. Hedgehog signaling promotes prostate xenograft tumor growth. Endocrinology. 2004;145:3961–3970. doi: 10.1210/en.2004-0079. [DOI] [PubMed] [Google Scholar]
- 12.Karhadkar SS, Bova GS, Abdallah N, Dhara S, Gardner D, Maitra A, Isaacs JT, Berman DM, Beachy PA. Hedgehog signalling in prostate regeneration, neoplasia and metastasis. Nature. 2004;431:707–712. doi: 10.1038/nature02962. [DOI] [PubMed] [Google Scholar]
- 13.Peacock CD, Wang Q, Gesell GS, Corcoran-Schwartz IM, Jones E, Kim J, Devereux WL, Rhodes JT, Huff CA, Beachy PA, Watkins DN, Matsui W. Hedgehog signaling maintains a tumor stem cell compartment in multiple myeloma. Proc. Natl. Acad. Sci. USA. 2007;104:4048–4053. doi: 10.1073/pnas.0611682104. [DOI] [PMC free article] [PubMed] [Google Scholar]
- 14.Zhao C, Chen A, Jamieson CH, Fereshteh M, Abrahamsson A, Blum J, Kwon HY, Kim J, Chute JP, Rizzieri D, Munchhof M, Vanarsdale T, Beachy PA, Reya T. Hedgehog signalling is essential for maintenance of cancer stem cells in myeloid leukaemia. Nature. 2009 doi: 10.1038/nature07737. [DOI] [PMC free article] [PubMed] [Google Scholar]
- 15.Bar EE, Chaudhry A, Lin A, Fan X, Schreck K, Matsui W, Piccirillo S, Vescovi AL, DiMeco F, Olivi A, Eberhart CG. Cyclopamine-mediated Hedgehog pathway inhibition depletes stem-like cancer cells in glioblastoma. Stem Cells. 2007;25:2524–2533. doi: 10.1634/stemcells.2007-0166. [DOI] [PMC free article] [PubMed] [Google Scholar]
- 16.Clement V, Sanchez P, de Tribolet N, Radovanovic I, Ruiz i Altaba A. HEDGEHOG-GLI1 signaling regulates human glioma growth, cancer stem cell self-renewal, and tumorigenicity. Curr. Biol. 2007;17:165–172. doi: 10.1016/j.cub.2006.11.033. [DOI] [PMC free article] [PubMed] [Google Scholar]
- 17.Ehtesham M, Sarangi A, Valadez JG, Chanthaphaychith S, Becher MW, Abel TW, Thompson RC, Cooper MK. Ligand-dependent activation of the Hedgehog pathway in glioma progenitor cells. Oncogene. 2007;26:5752–5761. doi: 10.1038/sj.onc.1210359. [DOI] [PubMed] [Google Scholar]
- 18.Monje M, Mitra SS, Freret ME, Raveh TB, Kim J, Masek M, Attema JL, Li G, Haddix T, Edwards MS, Fisher PG, Weissman IL, Rowitch DH, Vogel H, Wong AJ, Beachy PA. Hedgehog-responsive candidate cell of origin for diffuse intrinsic pontine glioma. Proc. Natl. Acad. Sci. USA. 2011;108:4453–4458. doi: 10.1073/pnas.1101657108. [DOI] [PMC free article] [PubMed] [Google Scholar]
- 19.Rush SZ, Abel TW, Valadez JG, Pearson M, Cooper MK. Activation of the hedgehog pathway in pilocytic astrocytomas. Neuro-oncology. 2010;12:790–798. doi: 10.1093/neuonc/noq026. [DOI] [PMC free article] [PubMed] [Google Scholar]
- 20.Sarangi A, Valadez JG, Rush S, Abel TW, Thompson RC, Cooper MK. Targeted inhibition of the Hedgehog pathway in established malignant glioma xenografts enhances survival. Oncogene. 2009;28:3468–3476. doi: 10.1038/onc.2009.208. [DOI] [PMC free article] [PubMed] [Google Scholar]
- 21.Xu Q, Yuan X, Liu G, Black KL, Yu JS. Hedgehog signaling regulates brain tumor-initiating cell proliferation and portends shorter survival for patients with PTEN-coexpressing glioblastomas. Stem Cells. 2008;26:3018–3026. doi: 10.1634/stemcells.2008-0459. [DOI] [PubMed] [Google Scholar]
- 22.Venere M, Fine HA, Dirks PB, Rich JN. Cancer stem cells in gliomas: identifying and understanding the apex cell in cancer’s hierarchy. Glia. 2011;59:1148–1154. doi: 10.1002/glia.21185. [DOI] [PMC free article] [PubMed] [Google Scholar]
- 23.Dropcho EJ, Soong SJ. The prognostic impact of prior low grade histology in patients with anaplastic gliomas: a case-control study. Neurology. 1996;47:684–690. doi: 10.1212/wnl.47.3.684. [DOI] [PubMed] [Google Scholar]
- 24.Ohgaki H, Dessen P, Jourde B, Horstmann S, Nishikawa T, Di Patre PL, Burkhard C, Schuler D, Probst-Hensch NM, Maiorka PC, Baeza N, Pisani P, Yonekawa Y, Yasargil MG, Lutolf UM, Kleihues P. Genetic pathways to glioblastoma: a population-based study. Cancer Res. 2004;64:6892–6899. doi: 10.1158/0008-5472.CAN-04-1337. [DOI] [PubMed] [Google Scholar]
- 25.Balss J, Meyer J, Mueller W, Korshunov A, Hartmann C, von Deimling A. Analysis of the IDH1 codon 132 mutation in brain tumors. Acta Neuropathol. (Berl.) 2008;116:597–602. doi: 10.1007/s00401-008-0455-2. [DOI] [PubMed] [Google Scholar]
- 26.Hartmann C, Meyer J, Balss J, Capper D, Mueller W, Christians A, Felsberg J, Wolter M, Mawrin C, Wick W, Weller M, Herold-Mende C, Unterberg A, Jeuken JW, Wesseling P, Reifenberger G, von Deimling A. Type and frequency of IDH1 and IDH2 mutations are related to astrocytic and oligodendroglial differentiation and age: a study of 1010 diffuse gliomas. Acta Neuropathol. (Berl.) 2009;118:469–474. doi: 10.1007/s00401-009-0561-9. [DOI] [PubMed] [Google Scholar]
- 27.Parsons DW, Jones S, Zhang X, Lin JC, Leary RJ, Angenendt P, Mankoo P, Carter H, Siu IM, Gallia GL, Olivi A, McLendon R, Rasheed BA, Keir S, Nikolskaya T, Nikolsky Y, Busam DA, Tekleab H, Diaz LA, Jr, Hartigan J, Smith DR, Strausberg RL, Marie SK, Shinjo SM, Yan H, Riggins GJ, Bigner DD, Karchin R, Papadopoulos N, Parmigiani G, Vogelstein B, Velculescu VE, Kinzler KW. An integrated genomic analysis of human glioblastoma multiforme. Science. 2008;321:1807–1812. doi: 10.1126/science.1164382. [DOI] [PMC free article] [PubMed] [Google Scholar]
- 28.Yan H, Parsons DW, Jin G, McLendon R, Rasheed BA, Yuan W, Kos I, Batinic-Haberle I, Jones S, Riggins GJ, Friedman H, Friedman A, Reardon D, Herndon J, Kinzler KW, Velculescu VE, Vogelstein B, Bigner DD. IDH1 and IDH2 mutations in gliomas. New Engl. J. Med. 2009;360:765–773. doi: 10.1056/NEJMoa0808710. [DOI] [PMC free article] [PubMed] [Google Scholar]
- 29.Watanabe T, Nobusawa S, Kleihues P, Ohgaki H. IDH1 mutations are early events in the development of astrocytomas and oligodendrogliomas. Am. J. Pathol. 2009;174:1149–1153. doi: 10.2353/ajpath.2009.080958. [DOI] [PMC free article] [PubMed] [Google Scholar]
- 30.Chen JK, Taipale J, Young KE, Maiti T, Beachy PA. Small molecule modulation of smoothened activity. Proc. Natl. Acad. Sci. USA. 2002;99:14071–14076. doi: 10.1073/pnas.182542899. [DOI] [PMC free article] [PubMed] [Google Scholar]
- 31.Colburn NH, Bruegge WF, Bates JR, Gray RH, Rossen JD, Kelsey WH, Shimada T. Correlation of anchorage-independent growth with tumorigenicity of chemically transformed mouse epidermal cells. Cancer Res. 1978;38:624–634. [PubMed] [Google Scholar]
- 32.Meyskens FL, Jr, Thomson SP, Moon TE. Quantitation of the number of cells within tumor colonies in semisolid medium and their growth as oblate spheroids. Cancer Res. 1984;44:271–277. [PubMed] [Google Scholar]
- 33.Dang L, White DW, Gross S, Bennett BD, Bittinger MA, Driggers EM, Fantin VR, Jang HG, Jin S, Keenan MC, Marks KM, Prins RM, Ward PS, Yen KE, Liau LM, Rabinowitz JD, Cantley LC, Thompson CB, Vander Heiden MG, Su SM. Cancer-associated IDH1 mutations produce 2hydroxyglutarate. Nature. 2009;462:739–744. doi: 10.1038/nature08617. [DOI] [PMC free article] [PubMed] [Google Scholar]
- 34.Gross S, Cairns RA, Minden MD, Driggers EM, Bittinger MA, Jang HG, Sasaki M, Jin S, Schenkein DP, Su SM, Dang L, Fantin VR, Mak TW. Cancer associated metabolite 2-hydroxyglutarate accumulates in acute myelogenous leukemia with isocitrate dehydrogenase 1 and 2 mutations. J. Exp. Med. 2010;207:339–344. doi: 10.1084/jem.20092506. [DOI] [PMC free article] [PubMed] [Google Scholar]
- 35.Grover VK, Valadez JG, Bowman AB, Cooper MK. Lipid modifications of Sonic Hedgehog ligand dictate cellular reception and signal response. PloS One. 2011;6:e21353. doi: 10.1371/journal.pone.0021353. [DOI] [PMC free article] [PubMed] [Google Scholar]
- 36.Sanchez P, Hernandez AM, Stecca B, Kahler AJ, DeGueme AM, Barrett A, Beyna M, Datta MW, Datta S, Ruiz i Altaba A. Inhibition of prostate cancer proliferation by interference with SONIC HEDGEHOG-GLI1 signaling. Proc. Natl. Acad. Sci. USA. 2004;101:12561–12566. doi: 10.1073/pnas.0404956101. [DOI] [PMC free article] [PubMed] [Google Scholar]
- 37.Piaskowski S, Bienkowski M, Stoczynska-Fidelus E, Stawski R, Sieruta M, Szybka M, Papierz W, Wolanczyk M, Jaskolski DJ, Liberski PP, Rieske P. Glioma cells showing IDH1 mutation cannot be propagated in standard cell culture conditions. Br. J. Cancer. 2011;104:968–970. doi: 10.1038/bjc.2011.27. [DOI] [PMC free article] [PubMed] [Google Scholar]
- 38.Kelly JJ, Blough MD, Stechishin OD, Chan JA, Beauchamp D, Perizzolo M, Demetrick DJ, Steele L, Auer RN, Hader WJ, Westgate M, Parney IF, Jenkins R, Cairncross JG, Weiss S. Oligodendroglioma cell lines containing t(1;19) (q10;p10) Neuro-oncology. 2010;12:745–755. doi: 10.1093/neuonc/noq031. [DOI] [PMC free article] [PubMed] [Google Scholar]
- 39.Luchman HA, Stechishin OD, Dang NH, Blough MD, Chesnelong C, Kelly JJ, Nguyen SA, Chan JA, Weljie AM, Cairncross JG, Weiss S. An in vivo patient derived model of endogenous IDH1-mutantglioma. Neuro-oncology. 2012;14:184–191. doi: 10.1093/neuonc/nor207. [DOI] [PMC free article] [PubMed] [Google Scholar]
- 40.Capper D, Weissert S, Balss J, Habel A, Meyer J, Jager D, Ackermann U, Tessmer C, Korshunov A, Zentgraf H, Hartmann C, von Deimling A. Characterization of R132H mutation-specific IDH1 antibody binding in brain tumors. Brain Pathol. 2010;20:245–254. doi: 10.1111/j.1750-3639.2009.00352.x. [DOI] [PMC free article] [PubMed] [Google Scholar]
- 41.van den Bent MJ, Dubbink HJ, Marie Y, Brandes AA, Taphoorn MJ, Wesseling P, Frenay M, Tijssen CC, Lacombe D, Idbaih A, van Marion R, Kros JM, Dinjens WN, Gorlia T, Sanson M. IDH1 and IDH2 mutations are prognostic but not predictive for outcome in anaplastic oligodendroglial tumors: a report of the European organization for research and treatment of cancer brain tumor group. Clin. Cancer Res. Off. J. Am. Assoc. Cancer Res. 2010;16:1597–1604. doi: 10.1158/1078-0432.CCR-09-2902. [DOI] [PubMed] [Google Scholar]
- 42.Xu W, Yang H, Liu Y, Yang Y, Wang P, Kim SH, Ito S, Yang C, Xiao MT, Liu LX, Jiang WQ, Liu J, Zhang JY, Wang B, Frye S, Zhang Y, Xu YH, Lei QY, Guan KL, Zhao SM, Xiong Y. Oncometabolite 2-hydroxyglutarate is a competitive inhibitor of alpha-ketoglutarate-dependent dioxygenases. Cancer Cell. 2011;19:17–30. doi: 10.1016/j.ccr.2010.12.014. [DOI] [PMC free article] [PubMed] [Google Scholar]
- 43.Ohgaki H, Kleihues P. Genetic profile of astrocytic and oligodendroglial gliomas. Brain Tumor Pathol. 2011;28:177–183. doi: 10.1007/s10014-011-0029-1. [DOI] [PubMed] [Google Scholar]
- 44.Gilbertson RJ. Mapping cancer origins. Cell. 2011;145:25–29. doi: 10.1016/j.cell.2011.03.019. [DOI] [PMC free article] [PubMed] [Google Scholar]
- 45.Phillips HS, Kharbanda S, Chen R, Forrest WF, Soriano RH, Wu TD, Misra A, Nigro JM, Colman H, Soroceanu L, Williams PM, Modrusan Z, Feuerstein BG, Aldape K. Molecular subclasses of high-grade glioma predict prognosis, delineate a pattern of disease progression, and resemble stages in neurogenesis. Cancer Cell. 2006;9:157–173. doi: 10.1016/j.ccr.2006.02.019. [DOI] [PubMed] [Google Scholar]
- 46.Verhaak RG, Hoadley KA, Purdom E, Wang V, Qi Y, Wilkerson MD, Miller CR, Ding L, Golub T, Mesirov JP, Alexe G, Lawrence M, O’Kelly M, Tamayo P, Weir BA, Gabriel S, Winckler W, Gupta S, Jakkula L, Feiler HS, Hodgson JG, James CD, Sarkaria JN, Brennan C, Kahn A, Spellman PT, Wilson RK, Speed TP, Gray JW, Meyerson M, Getz G, Perou CM, Hayes DN. Integrated genomic analysis identifies clinically relevant subtypes of glioblastoma characterized by abnormalities in PDGFRA, IDH1, EGFR, and NF1. Cancer Cell. 2010;17:98–110. doi: 10.1016/j.ccr.2009.12.020. [DOI] [PMC free article] [PubMed] [Google Scholar]
Associated Data
This section collects any data citations, data availability statements, or supplementary materials included in this article.