

Abstract
Background
Superior temporal cortices include brain regions dedicated to auditory processing and several lines of evidence suggest structural and functional abnormalities in both schizophrenia and bipolar disorder within this brain region. However, possible glutamatergic dysfunction within this region has not been investigated in adult patients.
Methods
Thirty patients with schizophrenia (38.67 ± 12.46 years of age), 28 euthymic patients with bipolar I disorder (35.32 ± 9.12 years of age), and 30 age-, gender- and education- matched healthy controls were enrolled. Proton Magnetic Resonance Spectroscopy data were acquired using a 3.0T Siemens MAGNETOM TIM Trio MR system and single voxel Point REsolved Spectroscopy Sequence (PRESS) in order to quantify brain metabolites within the left and right Heschl's Gyrus and Planum Temporale of superior temporal cortices.
Results
There were significant abnormalities in Glutamate (Glu) (F(2,78)=8.52, p<0.0001), n-Acetyl Aspartate (tNAA) (F(2,81)=5.73, p=0.005), Creatine (tCr) (F(2,83)=5.91, p=0.004) and Inositol (Ins) (F(2,82)=8.49, p<0.0001) concentrations in the left superior temporal cortex. In general, metabolite levels were lower for bipolar disorder patients when compared to healthy participants. Moreover, patients with bipolar disorder exhibited significantly lower tCr and Ins concentrations when compared to schizophrenia patients. In addition, we have found significant correlations between the superior temporal cortex metabolites and clinical measures.
Conclusion
As the left auditory cortices are associated with language and speech, left hemisphere specific abnormalities may have clinical significance. Our findings are suggestive of shared glutamatergic abnormalities in schizophrenia and bipolar disorder.
Keywords: Schizophrenia, Bipolar Disorder, Glutamate, Glutamine, Magnetic Resonance Spectroscopy, Superior Temporal Cortex
Introduction
Emil Kraepelin's dichotomous approach to discriminate schizophrenia and bipolar disorder relies on their different clinical courses. However, there has been discrepancy between Kraepelin's approach and studies showing co-aggregation of schizophrenia and bipolar disorder in families as well as shared susceptibility genes (Bramon and Sham, 2001; Craddock and Owen, 2005). The challenge arises due to the presence of overlapping symptoms between schizophrenia and bipolar disorder, but yet the desire for clear diagnostic categorization. Dimensional concepts suggest focusing on symptom domains rather than diagnostic categories (Cuthbert, 2014; Keshavan and Ongur, 2014). These symptom domains in conjunction with biological findings may provide insight for shared and distinct mechanisms underlying the disorders.
Superior temporal cortices host primary, secondary and association auditory cortices and have been implicated in the pathophysiology of schizophrenia. Both postmortem and in vivo measurements have shown reductions in volume, thickness and gray matter content of the superior temporal cortex in schizophrenia (Modinos et al., 2013; Vita et al., 2012). Longitudinal studies report progressive gray matter loss in the superior temporal gyrus and more precisely the Heschl's Gyrus and Planum Temporale with progression to psychosis and development of delusions (Vita et al., 2012). Moreover, left superior temporal cortices have been associated with symptom domains such as auditory hallucinations (Dierks et al., 1999; Jardri et al., 2011; Kuhn and Gallinat, 2012; Modinos et al., 2013; Shinn et al., 2013) and thought disorder (Seese et al., 2011; Shenton et al., 1992) in psychosis. These findings suggest the superior temporal gyrus as a highly relevant location for the neurobiology and development of psychosis (Rajarethinam et al., 2000; Seese et al., 2011; Shenton et al., 1992; Takahashi et al., 2006)-. On the other hand, two meta-analyses of volumetric studies of superior temporal cortices did not report any significant differences between patients with bipolar disorder and healthy participants (Arnone et al., 2009; Kempton et al., 2008). However, primary and secondary auditory cortices are located in the region and functional studies consistently reported auditory processing disturbances in both schizophrenia (Dierks et al., 1999; Domjan et al., 2012; Umbricht and Krljes, 2005) and bipolar disorder (Hall et al., 2009; Oribe et al., 2010).
Since glutamate is the major excitatory neurotransmitter and since the EEG signal consists of excitatory end synaptic potentials, auditory processing deficits detected in both schizophrenia (Oribe et al., 2010; Umbricht and Krljes, 2005) and bipolar disorder (Atagun et al., 2014; Ethridge et al., 2012; Hall et al., 2009) could potentially be due to glutamatergic dysfunction in the auditory cortices (Javitt, 2009). Glutamate-modulating agents have been found to be efficacious in the treatment of mood disorders both in pre-clinical (Skolnick et al., 2009) and clinical studies (Machado-Vieira et al., 2012; Sanacora et al., 2008). Current psychotomimetics also modulate different components of the glutamatergic system (for reviews: (Machado-Vieira et al., 2012; Sanacora et al., 2008)). Chronic treatment with lamotrigine, valproate or lithium is likely to effect glutamatergic system through a variety of mechanisms (for reviews: (Colla et al., 2009; Gigante et al., 2012; Schifitto et al., 2009; Soeiro-de-Souza et al., 2013; Yatham et al., 2009)). Therefore, the nature and extent of the glutamatergic system abnormalities in patients with schizophrenia and mood disorders require further clarification.
Proton magnetic resonance spectroscopy (1H MRS) is a non-invasive neuroimaging technique that can quantify in vivo neurochemical metabolites, including those related to the glutamatergic system. Glutamatergic neurotransmission is thought to be disturbed in both schizophrenia (Goff and Coyle, 2001; Javitt, 2009; Paz et al., 2008) and bipolar disorder (Machado-Vieira et al., 2012; Sanacora et al., 2008). Moreover, altered glutamatergic metabolites have been reported both in schizophrenia (Brugger et al., 2011; Marsman et al., 2013; Poels et al., 2014a; Poels et al., 2014b) and bipolar disorder (Moore et al., 2007; Ongur et al., 2011; Yildiz-Yesiloglu and Ankerst, 2006; Yuksel and Ongur, 2010). Frontal, anterior cingulate and hippocampal regions are the most frequently studied brain regions and the findings were consistent across these brain regions. Only one study has investigated brain metabolites within the superior temporal gyrus (Seese et al., 2011) and reported a correlation between N-acetyl aspartate (NAA) concentrations and thought disorder in children with schizophrenia. However, to our knowledge, no single 1H MRS study has investigated the superior temporal region and compared the findings in adult patients with schizophrenia and patients with bipolar disorder.
Hence, in this study, we utilized 1H MRS to examine neurometabolic changes within superior temporal cortices of adults with schizophrenia or bipolar disorder. Studies by different research modalities consistently report structural and functional abnormalities of auditory cortices, thus we expected to see abnormalities within the neurochemical profile of this region in schizophrenia and/or bipolar disorder.
Methods
Participants and Study Procedures
Thirty-five stable patients with paranoid schizophrenia (male or female; between ages of 18-59 years old) and 37 euthymic patients with bipolar disorder (male or female; between ages of 20-54 years old) were recruited for the study from the outpatient unit of Ankara Ataturk Training and Education Hospital, Ankara, Turkey. Five of the schizophrenia and 3 of the bipolar patients could not attend the MRI session and hence were excluded. Moreover, 5 of the bipolar patients had bipolar disorder II and therefore were not included in the analysis and we could not acquire neuroimaging data from 1 of the bipolar patients due to technical issues. In addition, 30 age-, gender-, and education- matched healthy participants (male or female; between ages of 18-58 years old) were enrolled in the study. All participants provided written consent upon receiving detailed information about the study. The Ethical Committee of Yıldırım Beyazıt University approved the study.
All participants underwent a clinical interview administered by a psychiatrist (MIA) and diagnoses were checked with the Structured Clinical Interview according to the DSM-IV (SCID-I) (First et al., 1996). The clinical interview assessed the participants' demographics and medical/psychiatric history. Patients with bipolar disorder were evaluated using the Young Mania Rating Scale (YMRS) (Young et al., 1978) and the Hamilton Depression Rating Scale (HDRS) (Hamilton, 1960). Schizophrenia patients were evaluated with Scale for the Assessment of Positive Symptoms (SAPS) (including subscores for delusion and hallucination) (Andreasen, 1984) and Scale for the Assessment of Negative Symptoms (SANS) (Andreasen, 1983). All patients were also evaluated with the Brief Psychiatric Rating Scale (BPRS) (Overall and Gorham, 1962) and the Edinburgh Handedness Inventory (EHI) (Oldfield, 1971). All participants were free of any brain damage/surgeries or metabolic systemic diseases such as diabetes mellitus or hypertension or current or lifetime psychiatric comorbidity or substance abuse. Psychotropic medications except for benzodiazepines were allowed. Exclusion criteria also included any contraindications to MRI scan. In addition deafness or heading aids were excluded to avoid any possible plasticity effects as a result of hearing disabilities, as we are particularly interested in the temporal lobe. Finally, all participants completed an MRI scanning session.
NeuroImaging Data Acquisition
Data were acquired on a 3.0 Tesla Siemens MAGNETOM TIM Trio whole-body MR system (Siemens, Erlangen, Germany) with a thirty two-channel phased-array head coil at the UMRAM National Magnetic Resonance Research Center, Ankara, Turkey.
T1-weighted anatomical MRI (MPRAGE sequence, 256 × 256 voxels, TR: 2000 ms, TE: 3.02 ms, FOV read: 215, FOV phase: 100, slice thickness: 0.84, 192 slices) were collected for diagnostic and localization purposes. Voxels (20 mm × 20 mm × 20 mm) were placed consecutively in the left and right Heschl's Gyrus and Planum Temporale regions (Figure 1) and Proton Magnetic Resonance Spectroscopy (1H MRS) data were acquired using the single voxel Point REsolved Spectroscopy Sequence (PRESS) (TE=30 ms, TR=2000 ms, 128 averages) in order to quantify brain metabolites (Figure 1). Manually adjusted B0 shimming was applied around the voxel as implemented on our MR system.
Figure 1.
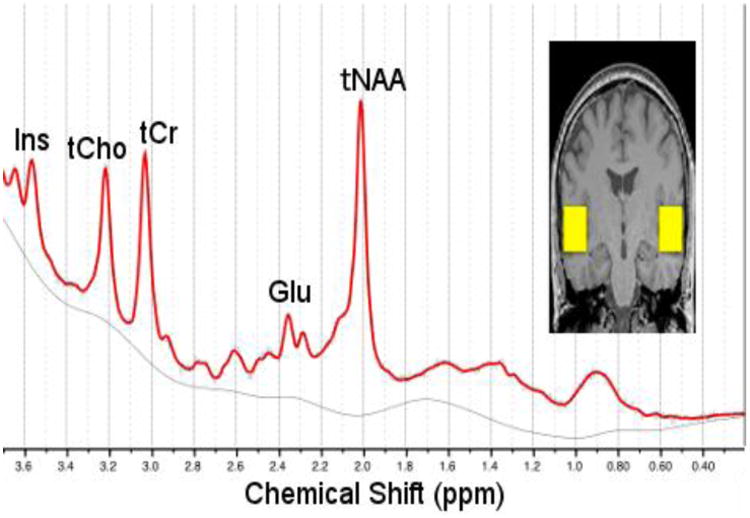
Representative proton spectrum and LCModel fit (red) with sample placement of voxels (yellow) in the left and right superior temporal gyri.
NeuroImaging Data Analysis
The proton spectra were fit using LCModel (Version 6.3.0) to quantify the metabolite concentrations. LCModel analyzes in vivo proton spectra as a linear combination of model in vitro spectra from individual metabolite solutions (Provencher, 1993, 2001) by utilizing built-in (simulated) radial basis sets. The basis set used for this study included alanine, aspartate, creatine (Cr), phosphocreatine (PCr), γ-aminobutyric acid (GABA), glucose, glutamate (Glu), glutamine (Gln), glycerophosphocholine (GPC), phosphocholine (PCh), glutathione (GSH), inositol (Ins), lactate, N-acetyl aspartate (NAA), N-acetyl aspartyl glutamate (NAAG), scyllo-inositol, taurine as well as macromolecules and lipids. Total NAA (tNAA, NAA and NAAG), Glu, Glx (Glu and Gln), total creatine (tCr, Cr and PCr), total choline (tCh, GPC and PCh), and Ins were quantified and fits with Cramer-Rao lower bounds (CRLB, estimated error of the metabolite quantification) of greater than 10% were classified as not reliably detected and excluded from further analysis.
The structural T1-weighted images were segmented using SPM8 (Statistical Parameter Mapping– Welcome Department of Imaging Neuroscience, London, UK; (http://www.fil.ion.ucl.ac.uk/spm/software/spm8/)) to determine the gray matter, white matter and CSF contributions to the voxel of interest.
Statistics
Statistical analysis was performed using SPSS 21 (Armonk, NY: IBM Corp.). First, we conducted an outlier analysis for each metabolite within each group of participants. The values that were two standard deviations away from the mean of their corresponding groups were eliminated from further analysis. The remaining data were subjected to univariate ANOVA to compare the findings across 3 groups, i.e. schizophrenia patients vs. patients with bipolar disorder vs. healthy participants; and metabolite levels were the dependent factors for each comparison. Since we have 6 different metabolites (i.e. tNAA, Glu, Glx, tCr, tCho and Ins), to account for the multiple comparisons we considered p<0.008 to be significant. We also performed post-hoc analyses with Bonferonni corrections and for this part of the analysis we considered p<0.05 to be significant. In addition, we conducted an ANCOVA to investigate the potential covariates that have clinical importance and cover a range of values within each group (i.e. age of onset and duration of disorder as well as medication effects). Further, we conducted a Pearson's correlation analysis to explore the relationship between the brain metabolites and the clinical measures and for these analyses we considered p<0.05 to be significant.
Results
Participant Demographics
Thirty remitted patients with paranoid schizophrenia (18 male; average age: 38.7 ± 12.5 years) and 28 euthymic patients with bipolar disorder (13 male; average age: 35.3 ± 9.1 years) and 30 healthy participants (13 male; average age: 32.8 ± 10.7 years) were included in the study. There were no significant differences in any of the demographic variables across the groups (p>0.05). Age of onset varied between the ages of 10 and 38 years for schizophrenia patients (average age of onset: 22.5 ± 6.4 years), and ages of 12 and 48 years (average age of onset: 23.6 ± 8.7 years) for patients with bipolar disorder. Schizophrenia patients scored significantly higher than patients with bipolar disorder in BPRS (F(1,56)=29.45, p<0.0001). The demographic and clinical characteristics of the sample are listed in Table 1.
Table 1.
Clinical characteristics of participants.
| Schizophrenia (n=30) | Bipolar Disorder (n=28) | Healthy Controls (n=30) | F/X2/t | p | ||
|---|---|---|---|---|---|---|
| Age | 38. 7 ± 12.5 | 35.3 ± 9.1 | 32.8 ± 10.7 | 2.22 | 0.115 | |
| Gender (F) | 12 | 15 | 17 | 1.88 | 0.391 | |
| Education | 9.30 ± 3.2 | 10.89 ± 4.9 | 10.20 ± 3.4 | 1.24 | 0.294 | |
| Age at Onset of Disorder (years) | 22.5 ± 6.4 | 23.6 ± 8.7 | 0.89 | 0.578 | ||
| Duration of Disorder (months) | 147.5 ± 132.1 | 92.2 ± 107.7 | 3.19 | 0.089 | ||
| Number of Previous Hospitalizations | 2.4 ± 5.1 | 1.4 ± 1.8 | 2.12 | 0.328 | ||
| Number of Previous Episodes | Total | 7.8 ± 5.4 | ||||
| Manic | 2.8 ± 2.2 | |||||
| Depressive | 4.2 ± 3.4 | |||||
| Chlorpromazine Equivalent (mg) | 259.90 ± 228.54 | 144.4 ± 231.83 | 0.005 | 0.061 | ||
| Serum Lithium Levels (mEq/L) (n=9) | 0.67 ± 0.22 | |||||
| Serum Valproate Levels (μg/ml) (n=10) | 73.53 ± 27.08 | |||||
| BPRS | 7.67 ± 4.29 | 2.43 ± 2.86 | 3.20 | <0.001 | ||
| YMRS | 1.07 ± 1.61 | |||||
| HDRS | 3.46 ± 3.51 | |||||
| SAPS | Total | 11.0 ± 6.66 | ||||
| Bizarre Behavior | 1.16 ± 1.52 | |||||
| Formal Thought Disorder | 0.47 ± 1.01 | |||||
| Inappropriate Affect | 1.23 ± 0.73 | |||||
| Delusions | 5.10 ± 3.79 | |||||
| Hallucination | 2.60 ± 3.84 | |||||
| SANS | Total | 14.13 ± 8.56 | ||||
| Avolution | 2.77 ± 2.83 | |||||
| Affective Flattening | 4.13 ± 2.49 | |||||
| Anhedonia | 2.87 ± 1.83 | |||||
| Alogia | 2.03 ± 2.27 | |||||
| Attention | 2.33 ± 1.86 | |||||
Averages are reported with standard deviations. One-way ANOVA, Chi-Square test and t test. BPRS: Brief Psychiatric Rating Scale, HDRS: Hamilton Depression Rating Scale, SANS: Schedule for the Assessment of Negative Symptoms, SAPS: Schedule for the Assessment of Positive Symptoms, YMRS: Young Mania Rating Scale.
In the schizophrenia group, there were three medication-free patients, 26 patients were on various mono-therapy antipsychotic medications and only 1 patient was taking both antipsychotic and valproate together. In the bipolar disorder group, there were five medication-free patients; the rest were on medication (valproate mono-therapy (n=3), combination therapy of valproate and antipsychotics (n=3), lithium monotherapy (n=6), combination therapy of lithium and antipsychotics (n=3), combination of valproate, lithium and antipsychotics (n=1), antipsychotic mono-therapy (n=7)).
Brain metabolites
We evaluated the brain metabolites from the left and right Heschl's Gyrus and Planum Temporale regions separately. Statistically significant findings are summarized in Table 2.
Table 2.
1H MRS findings.
| Schizophrenia (n=30) | Bipolar Disorder (n=28) | Healthy Controls (n=30) | F | p | ||
|---|---|---|---|---|---|---|
| Left Hemisphere | ||||||
| Glu | 0.00088 ± 0.00011 | 0.00082 ± 0.00010 | 0.00095 ± 0.00013 | F(2,78)=8.52 | <0.0001 | |
| Covariates: (related to disorder) | age onset | F(1,50)=4.39 | 0.041 | |||
| duration | F(1,50)=4.64 | 0.036 | ||||
| CPZE | F(1,36)=5.78 | 0.021 | ||||
| tNAA | 0.00111 ± 0.00016 | 0.00104 ± 0.00015 | 0.00117 ± 0.00013 | F(2,81)=5.73 | 0.005 | |
| Covariates: (related to disorder) | age onset | F(1,52)=3.53 | 0.066 | |||
| duration | F(1,52)=3.73 | 0.059 | ||||
| CPZE | F(1,36)=2.83 | 0.101 | ||||
| tCr | 0.00080 ± 0.00011 | 0.00071 ± 0.00011 | 0.00080 ± 0.00011 | F(2,83)=5.91 | 0.004 | |
| Covariates: (related to disorder) | age onset | F(1,52)=8.91 | 0.004 | |||
| duration | F(1,52)=7.26 | 0.009 | ||||
| CPZE | F(1,36)=6.40 | 0.016 | ||||
| Ins | 0.00067 ± 0.00010 | 0.00057 ± 0.00012 | 0.00067 ± 0.00011 | F(2,82)=8.49 | <0.0001 | |
| Covariates: (related to disorder) | age onset | F(1,52)=14.48 | <0.0001 | |||
| duration | F(1,52)=11.25 | 0.001 | ||||
| CPZE | F(1,35)=6.64 | 0.014 |
Absolute quantity averages are reported with standard deviations. Univariate ANOVA. CPZE: chlorpromazine Equivalent.
Within the left hemisphere voxel, Glu (F(2,78)=8.52, p<0.0001) (Figure 2A), tNAA (F(2,81)=5.73, p=0.005) (Figure 2C), tCr (F(2,83)=5.91, p=0.004) (Figure 2E) and Ins (F(2,82)=8.49, p<0.0001) (Figure 2G) levels were statistically significantly different among the three groups. Post-hoc analysis revealed that tNAA, tCr and Ins levels were similar between schizophrenia patients and healthy participants (p>0.1), but Glu levels were lower for schizophrenia patients than that of healthy comparisons at a trend level (p=0.1). For Glu, tNAA, tCr and Ins, patients with bipolar disorder exhibited lower levels when compared to healthy participants (Glu: p<0.0001; tNAA: p=0.004; tCr: p=0.008; Ins: p=0.003). In addition, tCr and Ins levels were higher for patients with schizophrenia when compared to patients with bipolar disorder (tCr: p=0.016; Ins: p=0.001). Due to the wide ranges in age at onset, duration of illness, and medication status, we further investigated the differences in Glu, tNAA, tCr and Ins among patients with bipolar disorder and schizophrenia patients by accounting for age onset, duration of disorder and the chlorpromazine equivalent values of medicated patients; results are summarized in Table 2.
Figure 2.
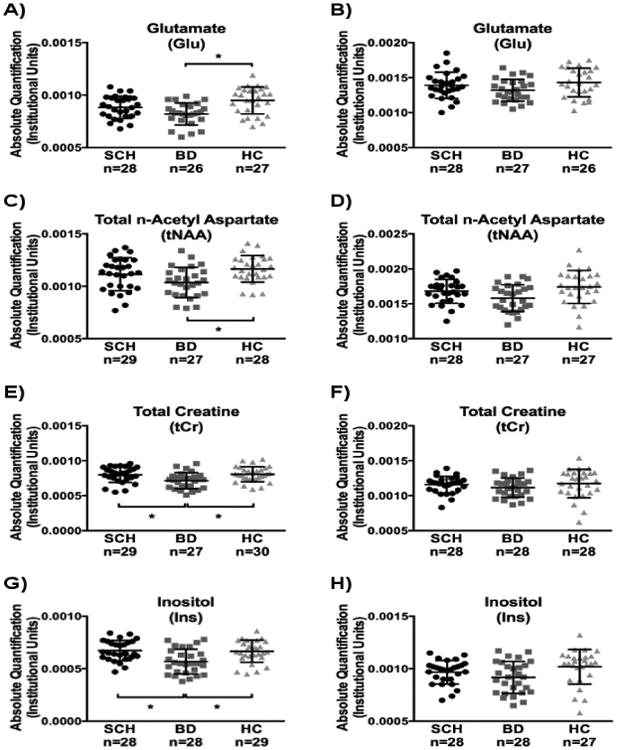
Absolute metabolite concentrations for patients with schizophrenia (SCH), bipolar disorder (BD), and healthy control participants (HC) acquired from the superior temporal gyrus using 1H MRS. Glutamate (Glu) from (A) Left and (B) Right superior temporal gyri; Total n-Aceltyl Aspartate (tNAA) from (C) Left and (D) Right superior temporal gyri; Total Creatine (tCr) from (E) Left and (F) Right superior temporal gyri; Inositol (Ins) from (G) Left and (H) Right superior temporal gyri. * denotes statistically significant difference between groups (p<0.008).
On the other hand, there were no statistically significant metabolite differences within the right hemisphere voxel (Glu: Figure 2B; tNAA: Figure 2D; tCr: Figure 2F; Ins: Figure 2H).
Since there was no statistically significant differences between groups in terms of voxel tissue content (Left hemisphere: gray matter- (F(2,84)=0.73, p=0.48), white matter- (F(2,84)=0.22, p=0.81, csf- F(2,84)=0.78, p=0.46; Right hemisphere: gray matter- (F(2,84)=0.25, p=0.78), white matter- (F(2,84)=0.75, p=0.47, csf- F(2,84)=1.98, p=0.15) we did not factor gray matter/white matter/csf amounts into our analysis.
Association between brain metabolites and clinical measures
For schizophrenia patients, we performed exploratory correlation analyses to investigate the relationship between the brain metabolites and SAPS (total scores and subscores for bizarre behavior, formal thought disorder, inappropriate affect, delusion and hallucination) and SANS (total scores and subscores for avolition, affective flattening, anhedonia, alogia, and attention).
Glu showed relationships with SANS affective flattening (r=0.44, p=0.02) and attention (r=0.44, p=0.02) subscores, only for the right hemisphere. tNAA exhibited inverse relationships with SANS alogia (r=-0.44, p=0.02) and attention subscores (r=-0.44, p=0.02) in the left hemisphere. tCr had inverse correlations with SAPS total score (r=-0.37, p=0.05), SAPS delusion subscore (r=-0.46, p=0.01), SANS anhedonia (r=-0.46, p=0.01), SANS alogia (r=-0.37, p=0.05) in the left hemisphere. Ins showed inverse relationships with SAPS delusion subscore (r=-0.42 p=0.03), SANS anhedonia (r=-0.47, p=0.01), and SANS alogia (r=-0.39, p=0.04) in the left hemisphere.
For patients with bipolar disorder, we performed exploratory correlation analyses to investigate the relationship between the brain metabolites and YMRS, HDRS and BPRS. tNAA showed inverse relationships with with HDRS for left (r=-0.46, p=0.02) and right hemispheres (r=-0.41, p=0.03). tCr also exhibited inverse correlation with HDRS for left (r=-0.39, p=0.05) and right (r=-0.44, p=0.02) hemispheres. In addition, Ins and HDRS had a reverse relationship in the right hemisphere (r=-0.52, p=0.005).
Discussion
In this study, we observed decreased Glu concentrations within the left Heschl's Gyrus and Planum Temporale of the superior temporal gyrus of patients with schizophrenia and bipolar disorder when compared to healthy participants. On the other hand, Glu, tNAA, tCr and Ins concentrations of the bipolar disorder group were lower when compared to schizophrenia patients and healthy participants. Moreover, tCr and Ins concentrations in the left superior temporal gyrus of schizophrenia patients were significantly higher than the concentrations measured from patients with bipolar disorder. All of these differences in metabolite levels between groups reached statistical significance only in the left superior temporal cortex, suggesting a possible location-specific abnormality within the dominant hemisphere of auditory cortices for schizophrenia and bipolar disorder patients. It has been shown that auditory cortices are functionally lateralized (Kell et al., 2011; Zatorre et al., 1992) and the auditory cortex of the dominant hemisphere is associated with psychiatric disorders (Dierks et al., 1999; Plaze et al., 2006; Shinn et al., 2013).
Previous studies have reported glutamatergic abnormalities related to clinical progression in schizophrenia observed within different brain regions such as the anterior cingulate cortex (Clinton and Meador-Woodruff, 2004; Goff and Coyle, 2001; Javitt et al., 2012; Kugaya and Sanacora, 2005). Specifically, schizophrenia patients have exhibited increased concentrations of glutamatergic metabolites if the patients were in a first-episode and conversely, decreased concentrations if the patients had a chronic disease (Marsman et al., 2013; Ohrmann et al., 2008; Ohrmann et al., 2005; Schwerk et al., 2014). A recent study, investigating schizophrenia patients showed elevated Gln and Gln-to-Glu ratio but no significant difference in Glu levels in patients when compared to healthy comparisons (Bustillo et al., 2014). Our findings in a cohort of chronic schizophrenia patients exhibited decreased Glu concentrations at trend level for schizophrenia patients when compared to healthy participants and no change for Glx concentrations were observed.
Previous reports did not find any difference in Glu concentrations between patients with bipolar disorder and healthy participants (Gigante et al., 2012); however they consistently showed increase in Glx concentration for bipolar disorder patients, regardless of mood state (Gigante et al., 2012; Yuksel and Ongur, 2010). Although alterations in Glx have been suggested to mostly reflect changes in Glu levels (Dager et al., 2004), previous reports are suggestive of abnormalities in other components of the composite Glx peak, such as Gln (Moore et al., 2007), rather than Glu. However, our findings showed significant difference in Glu levels but not in Glx concentrations.
Glutamate turnover may be altered in different ways, resulting in changes in Gln-to-Glu ratio, depending on the disease state, i.e. manic (Ongur et al., 2008) or depressive (Auer et al., 2000) phases of bipolar disorder (reviewed in (Yuksel and Ongur, 2010)). These findings suggest an alteration in glutamatergic dysfunction between mania and depression for bipolar disorder. Glial cells are responsible for Glu-Gln cycling (Cooper et al., 2003; Tansey et al., 1991); therefore glial abnormalities are potentially the basis of differences between mania and depression in bipolar disorder (Ongur et al., 1998). Unfortunately, the field strength of the MRI scanner used in the current study did not allow us to reliably quantify Gln concentrations. We can only speculate that since the Glx levels did not differ between groups, but Glu concentrations were lower for both schizophrenia and bipolar disorder patients when compared to healthy participants, Gln levels may have been elevated. Taken together, it is possible to suggest that abnormalities in the Gln/Glu cycle might be a cause of the observed reduction in Glu levels for the patients with bipolar disorder.
NAA is known to be lower in schizophrenia and bipolar disorder patients (Kraguljac et al., 2012a; Kraguljac et al., 2012b; Steen et al., 2005; Yildiz-Yesiloglu and Ankerst, 2006). Our investigation did not reveal any significant abnormality in tNAA concentrations in schizophrenia patients, possibly due to medication effects (Kraguljac et al., 2012a; Szulc et al., 2011; Szulc et al., 2013), but exhibited reduced tNAA levels for bipolar patients. tCr and Ins levels remain unchanged in schizophrenia (Schwerk et al., 2014) and our findings confirm this statement. However, there are a few studies that found reduced tCr levels in dorsolateral prefrontal cortex, anterior cingulate cortex, hippocampus and basal ganglia of schizophrenia patients (Ohrmann et al., 2007; Ohrmann et al., 2005; Ongur et al., 2009). In addition, the literature is not conclusive about the concentrations of Cr and Ins for patients with bipolar disorder (Frey et al., 2007; Kraguljac et al., 2012a; Ongur et al., 2009; Sikoglu et al., 2013; Silverstone and McGrath, 2009; Theberge et al., 2007; Yildiz-Yesiloglu and Ankerst, 2006). The decrease in tNAA, tCr and Ins that we observed in patients with bipolar disorder compared to healthy participants may be a region specific disturbance in this disorder, as we investigated an understudied brain area, i.e. the left superior temporal cortex. Regardless, these abnormalities are suggestive of abnormalities in neurochemicals other than glutamate in bipolar disorder.
The comparison of findings from patients with schizophrenia and bipolar disorder revealed significant differences only for tCr and Ins levels. The auditory system may show different abnormalities at multiple levels both in schizophrenia and bipolar disorder (Skold et al., 2014). Our observations may imply that there exist common, i.e. glutamatergic dysfunction, as well as distinct abnormalities, i.e. in brain bioenergetics in schizophrenia and bipolar disorder within the auditory system.
Previous studies have focused primarily on higher order cortices, such as the frontal lobe where different channels of information converge and hence conduct serial and parallel processing together. However, lower order sensory areas, such as the auditory cortices have simpler receptive fields with only serial processing capabilities (Homan et al., 2014; Rauschecker and Scott, 2009; Yamada and Wilber, 1990). Given the fact that the pathophysiology of psychiatric disorders is so complicated and these disorders may have different influences on different neural systems and circuits, investigating the primary sensory areas may provide an advantage. Therefore, in this study we focused on the superior temporal gyrus to acquire 1H MRS data.
Previous studies in the left STG in schizophrenia revealed correlations with clinical data, which suggests a relationship between the region and the effects of clinical factors. A 31P MRS study reported correlation between the hallucination score of the Positive and Negative Syndrome Scale (PANSS) and phosphomonoesters and phosphodiesters (Nenadic et al., 2014). A recent 1H MRS study comparing hallucinations in the STG reported that NAA/Cr ratio correlated with total and negative subscore of the PANSS in schizophrenia (Homan et al., 2014). Neuronal activation patterns for patients with auditory hallucinations were more prominent for the left hemisphere when compared to non-hallucinating patients as shown by functional neuroimaging studies with auditory tasks (Dierks et al., 1999; Shinn et al., 2013), which may indicate the relevance of the left auditory cortex. Besides, the auditory processing deficits in functional studies (Atagun et al., 2014; Atagun et al., 2013; Domjan et al., 2012; Hall et al., 2009; Oribe et al., 2010) point to abnormalities of the auditory cortices both in schizophrenia and bipolar disorder. In this study, both schizophrenia and bipolar disorder patients exhibited relationships between the studied metabolites and some of the clinical measures, especially on the left hemisphere. For example, HDRS scores correlated tCr and Ins concentrations in superior temporal cortices. This is particularly important as it may indicate a relationship between the metabolite levels and mood status.
Limitations
The current study had several limitations. First, our patients were patients with chronic disease and all were medicated. Although there was no statistically significant medication effect, small numbers of patients were taking each individual medication; therefore we cannot exclude medication effects conclusively. It is still possible that some of the metabolites were altered due to medications. Second, at 3T magnetic field strength, some of the metabolite peaks in the 1H-MRS spectrum cannot be decomposed. In spite of the high quality of the glutamate output, it is difficult to completely discriminate glutamate from glutamine and GABA signal amplitudes, thus we could only identify Glu and Glx levels. Third, 8 cm3 voxel volumes cover an area larger than the auditory cortices alone.
Conclusion
Overlapping symptoms and intermediate diagnoses suggest that schizophrenia and bipolar disorder are disorders on a continuum. Genome wide association studies have identified shared risk genes in schizophrenia and bipolar disorder involving glutamatergic metabolism and cascades (see review (Coyle, 2006)), which are in line with the glutamatergic abnormalities we have observed. Given that neurotransmission and intracellular functions are two major functions of glutamatergic metabolites, future studies focusing on glutamatergic abnormalities may provide novel targets for treatment development for both schizophrenia and bipolar disorder. In addition, this study reports a significant difference between creatine and inositol levels in patients with schizophrenia and bipolar disorder in the left superior temporal region. Taken together, there may be both shared and distinct mechanistic abnormalities within auditory cortices underlying pathophysiologies of schizophrenia and bipolar disorder. Therefore, our findings may suggest biological markers that may quantitatively distinguish the two disorders, and might be of importance for future studies.
Acknowledgments
MRI scans were conducted at the National Magnetic Resonance Research Center (UMRAM) of the Bilkent University (Ankara, Turkey) with support from the staff led by Prof. Dr. Ergin Atalar. In addition, we also appreciate technical help regarding voxel segmentation provided by Dinesh Deelchand, Dr. Uzay Emir and Dr. Gulin Oz from the Center for Magnetic Resonance Research, Minneapolis, MN, USA.
Role of Funding Source: The study was funded by the Scientific Research Projects Committee of the Yıldırım Beyazıt University (project #803) and NIMH grants to CMM (MH073998) and to DÖ (MH094594).
Footnotes
Contributions: MİA: Conceptualized and designed the study, prepared the initial protocol, conducted the psychiatric assessments of the participants, acquired the MRI data with support from MR technicians, helped with the statistical analysis, interpreted the data and wrote the manuscript.
EMS: Aided the design of the study, analyzed the MRS data, performed the statistical analysis, prepared figures and tables, helped with interpretation of the data and writing the manuscript.
SSC: Referred patients and helped Dr. Atagün to enroll participants.
GKU: Referred patients and helped Dr. Atagün to enroll participants.
SUK: Referred patients and helped Dr. Atagün to enroll participants.
AÇ: Supervised the study and the department which patients were enrolled.
OA: Helped the adjustments of the MRI protocol, checked the T1 and T2 images of the subjects.
MLP: Provided scientific supervision of the study, reviewed the initial protocol and the manuscript.
CMM: Provided scientific supervision for designing the study, analyzing and interpreting the data, critically reviewed the manuscript.
DÖ: Provided scientific supervision for conceptualizing and designing the study and the initial protocol, as well as interpreting the data, critically reviewed the manuscript.
Conflict of Interest: The author DÖ participated in the Scientific Advisory Board for Lilly Inc. in 2013. Other authors do not report any conflict of interest.
Publisher's Disclaimer: This is a PDF file of an unedited manuscript that has been accepted for publication. As a service to our customers we are providing this early version of the manuscript. The manuscript will undergo copyediting, typesetting, and review of the resulting proof before it is published in its final citable form. Please note that during the production process errors may be discovered which could affect the content, and all legal disclaimers that apply to the journal pertain.
References
- Andreasen NC. The scale for assessment of negative symptoms (SANS) University of Iowa; Iowa City, IA: 1983. [Google Scholar]
- Andreasen NC. The scale for the assessment of positive symptoms (SAPS) University of Iowa; Iowa City, IA: 1984. [Google Scholar]
- Arnone D, Cavanagh J, Gerber D, Lawrie SM, Ebmeier KP, McIntosh AM. Magnetic resonance imaging studies in bipolar disorder and schizophrenia: meta-analysis. Br J Psychiatry. 2009;195(3):194–201. doi: 10.1192/bjp.bp.108.059717. [DOI] [PubMed] [Google Scholar]
- Atagun MI, Guntekin B, Masali B, Tulay E, Basar E. Decrease of event-related delta oscillations in euthymic patients with bipolar disorder. Psychiatry Res. 2014;223(1):43–48. doi: 10.1016/j.pscychresns.2014.04.001. [DOI] [PubMed] [Google Scholar]
- Atagun MI, Guntekin B, Ozerdem A, Tulay E, Basar E. Decrease of theta response in euthymic bipolar patients during an oddball paradigm. Cognitive neurodynamics. 2013;7(3):213–223. doi: 10.1007/s11571-012-9228-7. [DOI] [PMC free article] [PubMed] [Google Scholar]
- Auer DP, Putz B, Kraft E, Lipinski B, Schill J, Holsboer F. Reduced glutamate in the anterior cingulate cortex in depression: an in vivo proton magnetic resonance spectroscopy study. Biological psychiatry. 2000;47(4):305–313. doi: 10.1016/s0006-3223(99)00159-6. [DOI] [PubMed] [Google Scholar]
- Bramon E, Sham PC. The common genetic liability between schizophrenia and bipolar disorder: a review. Curr Psychiatry Rep. 2001;3(4):332–337. doi: 10.1007/s11920-001-0030-1. [DOI] [PubMed] [Google Scholar]
- Brugger S, Davis JM, Leucht S, Stone JM. Proton magnetic resonance spectroscopy and illness stage in schizophrenia--a systematic review and meta-analysis. Biol Psychiatry. 2011;69(5):495–503. doi: 10.1016/j.biopsych.2010.10.004. [DOI] [PubMed] [Google Scholar]
- Bustillo JR, Chen H, Jones T, Lemke N, Abbott C, Qualls C, Canive J, Gasparovic C. Increased glutamine in patients undergoing long-term treatment for schizophrenia: a proton magnetic resonance spectroscopy study at 3 T. JAMA Psychiatry. 2014;71(3):265–272. doi: 10.1001/jamapsychiatry.2013.3939. [DOI] [PMC free article] [PubMed] [Google Scholar]
- Clinton SM, Meador-Woodruff JH. Abnormalities of the NMDA Receptor and Associated Intracellular Molecules in the Thalamus in Schizophrenia and Bipolar Disorder. Neuropsychopharmacology. 2004;29(7):1353–1362. doi: 10.1038/sj.npp.1300451. [DOI] [PubMed] [Google Scholar]
- Colla M, Schubert F, Bubner M, Heidenreich JO, Bajbouj M, Seifert F, Luborzewski A, Heuser I, Kronenberg G. Glutamate as a spectroscopic marker of hippocampal structural plasticity is elevated in long-term euthymic bipolar patients on chronic lithium therapy and correlates inversely with diurnal cortisol. Mol Psychiatry. 2009;14(7):696–704. 647. doi: 10.1038/mp.2008.26. [DOI] [PubMed] [Google Scholar]
- Cooper J, Bloom F, Roth R. The Biochemical Basis of Neuropharmacology. Oxford University Press; New York: 2003. [Google Scholar]
- Coyle JT. Glutamate and schizophrenia: beyond the dopamine hypothesis. Cell Mol Neurobiol. 2006;26(4-6):365–384. doi: 10.1007/s10571-006-9062-8. [DOI] [PMC free article] [PubMed] [Google Scholar]
- Craddock N, Owen MJ. The beginning of the end for the Kraepelinian dichotomy. Br J Psychiatry. 2005;186:364–366. doi: 10.1192/bjp.186.5.364. [DOI] [PubMed] [Google Scholar]
- Cuthbert BN. The RDoC framework: facilitating transition from ICD/DSM to dimensional approaches that integrate neuroscience and psychopathology. World Psychiatry. 2014;13(1):28–35. doi: 10.1002/wps.20087. [DOI] [PMC free article] [PubMed] [Google Scholar]
- Dager SR, Friedman SD, Parow A, Demopulos C, Stoll AL, Lyoo IK, Dunner DL, Renshaw PF. Brain metabolic alterations in medication-free patients with bipolar disorder. Archives of general psychiatry. 2004;61(5):450–458. doi: 10.1001/archpsyc.61.5.450. [DOI] [PubMed] [Google Scholar]
- Dierks T, Linden DE, Jandl M, Formisano E, Goebel R, Lanfermann H, Singer W. Activation of Heschl's gyrus during auditory hallucinations. Neuron. 1999;22(3):615–621. doi: 10.1016/s0896-6273(00)80715-1. [DOI] [PubMed] [Google Scholar]
- Domjan N, Csifcsak G, Drotos G, Janka Z, Szendi I. Different patterns of auditory information processing deficits in chronic schizophrenia and bipolar disorder with psychotic features. Schizophrenia research. 2012;139(1-3):253–259. doi: 10.1016/j.schres.2012.06.002. [DOI] [PubMed] [Google Scholar]
- Ethridge LE, Hamm JP, Shapiro JR, Summerfelt AT, Keedy SK, Stevens MC, Pearlson G, Tamminga CA, Boutros NN, Sweeney JA, Keshavan MS, Thaker G, Clementz BA. Neural activations during auditory oddball processing discriminating schizophrenia and psychotic bipolar disorder. Biol Psychiatry. 2012;72(9):766–774. doi: 10.1016/j.biopsych.2012.03.034. [DOI] [PMC free article] [PubMed] [Google Scholar]
- First MD, Gibbon M, Spitzer RL, Gibbon M, Williams JBW. User's guide for the structured interview for DSM-IV axis I disorders research version (SCID-I, version 2.0) Biometrics Research; New York: 1996. [Google Scholar]
- Frey BN, Stanley JA, Nery FG, Monkul ES, Nicoletti MA, Chen HH, Hatch JP, Caetano SC, Ortiz O, Kapczinski F, Soares JC. Abnormal cellular energy and phospholipid metabolism in the left dorsolateral prefrontal cortex of medication-free individuals with bipolar disorder: an in vivo 1H MRS study. Bipolar Disord. 2007;9(Suppl 1):119–127. doi: 10.1111/j.1399-5618.2007.00454.x. [DOI] [PubMed] [Google Scholar]
- Gigante AD, Bond DJ, Lafer B, Lam RW, Young LT, Yatham LN. Brain glutamate levels measured by magnetic resonance spectroscopy in patients with bipolar disorder: a meta-analysis. Bipolar Disord. 2012;14(5):478–487. doi: 10.1111/j.1399-5618.2012.01033.x. [DOI] [PubMed] [Google Scholar]
- Goff DC, Coyle JT. The emerging role of glutamate in the pathophysiology and treatment of schizophrenia. Am J Psychiatry. 2001;158(9):1367–1377. doi: 10.1176/appi.ajp.158.9.1367. [DOI] [PubMed] [Google Scholar]
- Hall MH, Schulze K, Rijsdijk F, Kalidindi S, McDonald C, Bramon E, Murray RM, Sham P. Are auditory P300 and duration MMN heritable and putative endophenotypes of psychotic bipolar disorder? A Maudsley Bipolar Twin and Family Study. Psychol Med. 2009;39(8):1277–1287. doi: 10.1017/S0033291709005261. [DOI] [PubMed] [Google Scholar]
- Hamilton M. A rating scale for depression. J Neurol Neurosurg Psychiatry. 1960;23:56–62. doi: 10.1136/jnnp.23.1.56. [DOI] [PMC free article] [PubMed] [Google Scholar]
- Homan P, Vermathen P, Van Swam C, Federspiel A, Boesch C, Strik W, Dierks T, Hubl D, Kreis R. Magnetic resonance spectroscopy investigations of functionally defined language areas in schizophrenia patients with and without auditory hallucinations. Neuroimage. 2014;94:23–32. doi: 10.1016/j.neuroimage.2014.03.009. [DOI] [PubMed] [Google Scholar]
- Jardri R, Pouchet A, Pins D, Thomas P. Cortical activations during auditory verbal hallucinations in schizophrenia: a coordinate-based meta-analysis. Am J Psychiatry. 2011;168(1):73–81. doi: 10.1176/appi.ajp.2010.09101522. [DOI] [PubMed] [Google Scholar]
- Javitt DC. When doors of perception close: bottom-up models of disrupted cognition in schizophrenia. Annu Rev Clin Psychol. 2009;5:249–275. doi: 10.1146/annurev.clinpsy.032408.153502. [DOI] [PMC free article] [PubMed] [Google Scholar]
- Javitt DC, Zukin SR, Heresco-Levy U, Umbricht D. Has an angel shown the way? Etiological and therapeutic implications of the PCP/NMDA model of schizophrenia. Schizophr Bull. 2012;38(5):958–966. doi: 10.1093/schbul/sbs069. [DOI] [PMC free article] [PubMed] [Google Scholar]
- Kell CA, Morillon B, Kouneiher F, Giraud AL. Lateralization of speech production starts in sensory cortices--a possible sensory origin of cerebral left dominance for speech. Cereb Cortex. 2011;21(4):932–937. doi: 10.1093/cercor/bhq167. [DOI] [PubMed] [Google Scholar]
- Kempton MJ, Geddes JR, Ettinger U, Williams SC, Grasby PM. Meta-analysis, database, and meta-regression of 98 structural imaging studies in bipolar disorder. Arch Gen Psychiatry. 2008;65(9):1017–1032. doi: 10.1001/archpsyc.65.9.1017. [DOI] [PubMed] [Google Scholar]
- Keshavan MS, Ongur D. The journey from RDC/DSM diagnoses toward RDoC dimensions. World Psychiatry. 2014;13(1):44–46. doi: 10.1002/wps.20105. [DOI] [PMC free article] [PubMed] [Google Scholar]
- Kraguljac NV, Reid M, White D, Jones R, den Hollander J, Lowman D, Lahti AC. Neurometabolites in schizophrenia and bipolar disorder - a systematic review and meta-analysis. Psychiatry Res. 2012a;203(2-3):111–125. doi: 10.1016/j.pscychresns.2012.02.003. [DOI] [PMC free article] [PubMed] [Google Scholar]
- Kraguljac NV, Reid MA, White DM, den Hollander J, Lahti AC. Regional decoupling of N-acetyl-aspartate and glutamate in schizophrenia. Neuropsychopharmacology. 2012b;37(12):2635–2642. doi: 10.1038/npp.2012.126. [DOI] [PMC free article] [PubMed] [Google Scholar]
- Kugaya A, Sanacora G. Beyond monoamines: glutamatergic function in mood disorders. CNS Spectr. 2005;10(10):808–819. doi: 10.1017/s1092852900010403. [DOI] [PubMed] [Google Scholar]
- Kuhn S, Gallinat J. Quantitative meta-analysis on state and trait aspects of auditory verbal hallucinations in schizophrenia. Schizophr Bull. 2012;38(4):779–786. doi: 10.1093/schbul/sbq152. [DOI] [PMC free article] [PubMed] [Google Scholar]
- Machado-Vieira R, Ibrahim L, Henter ID, Zarate CA., Jr Novel glutamatergic agents for major depressive disorder and bipolar disorder. Pharmacology, biochemistry, and behavior. 2012;100(4):678–687. doi: 10.1016/j.pbb.2011.09.010. [DOI] [PMC free article] [PubMed] [Google Scholar]
- Marsman A, van den Heuvel MP, Klomp DW, Kahn RS, Luijten PR, Hulshoff Pol HE. Glutamate in schizophrenia: a focused review and meta-analysis of (1)H-MRS studies. Schizophr Bull. 2013;39(1):120–129. doi: 10.1093/schbul/sbr069. [DOI] [PMC free article] [PubMed] [Google Scholar]
- Modinos G, Costafreda SG, van Tol MJ, McGuire PK, Aleman A, Allen P. Neuroanatomy of auditory verbal hallucinations in schizophrenia: a quantitative meta-analysis of voxel-based morphometry studies. Cortex. 2013;49(4):1046–1055. doi: 10.1016/j.cortex.2012.01.009. [DOI] [PubMed] [Google Scholar]
- Moore CM, Frazier JA, Glod CA, Breeze JL, Dieterich M, Finn CT, Frederick B, Renshaw PF. Glutamine and glutamate levels in children and adolescents with bipolar disorder: a 4.0-T proton magnetic resonance spectroscopy study of the anterior cingulate cortex. J Am Acad Child Adolesc Psychiatry. 2007;46(4):524–534. doi: 10.1097/chi.0b013e31802f5f2c. [DOI] [PMC free article] [PubMed] [Google Scholar]
- Nenadic I, Dietzek M, Langbein K, Rzanny R, Gussew A, Reichenbach JR, Sauer H, Smesny S. Superior temporal metabolic changes related to auditory hallucinations: a (31)P-MR spectroscopy study in antipsychotic-free schizophrenia patients. Brain Struct Funct. 2014;219(5):1869–1872. doi: 10.1007/s00429-013-0604-9. [DOI] [PubMed] [Google Scholar]
- Ohrmann P, Kugel H, Bauer J, Siegmund A, Kolkebeck K, Suslow T, Wiedl KH, Rothermundt M, Arolt V, Pedersen A. Learning potential on the WCST in schizophrenia is related to the neuronal integrity of the anterior cingulate cortex as measured by proton magnetic resonance spectroscopy. Schizophr Res. 2008;106(2-3):156–163. doi: 10.1016/j.schres.2008.08.005. [DOI] [PubMed] [Google Scholar]
- Ohrmann P, Siegmund A, Suslow T, Pedersen A, Spitzberg K, Kersting A, Rothermundt M, Arolt V, Heindel W, Pfleiderer B. Cognitive impairment and in vivo metabolites in first-episode neuroleptic-naive and chronic medicated schizophrenic patients: a proton magnetic resonance spectroscopy study. J Psychiatr Res. 2007;41(8):625–634. doi: 10.1016/j.jpsychires.2006.07.002. [DOI] [PubMed] [Google Scholar]
- Ohrmann P, Siegmund A, Suslow T, Spitzberg K, Kersting A, Arolt V, Heindel W, Pfleiderer B. Evidence for glutamatergic neuronal dysfunction in the prefrontal cortex in chronic but not in first-episode patients with schizophrenia: a proton magnetic resonance spectroscopy study. Schizophr Res. 2005;73(2-3):153–157. doi: 10.1016/j.schres.2004.08.021. [DOI] [PubMed] [Google Scholar]
- Oldfield RC. The assessment and analysis of handedness: the Edinburgh inventory. Neuropsychologia. 1971;9(1):97–113. doi: 10.1016/0028-3932(71)90067-4. [DOI] [PubMed] [Google Scholar]
- Ongur D, Drevets WC, Price JL. Glial reduction in the subgenual prefrontal cortex in mood disorders. Proceedings of the National Academy of Sciences of the United States of America. 1998;95(22):13290–13295. doi: 10.1073/pnas.95.22.13290. [DOI] [PMC free article] [PubMed] [Google Scholar]
- Ongur D, Haddad S, Prescot AP, Jensen JE, Siburian R, Cohen BM, Renshaw PF, Smoller JW. Relationship between genetic variation in the glutaminase gene GLS1 and brain glutamine/glutamate ratio measured in vivo. Biol Psychiatry. 2011;70(2):169–174. doi: 10.1016/j.biopsych.2011.01.033. [DOI] [PMC free article] [PubMed] [Google Scholar]
- Ongur D, Jensen JE, Prescot AP, Stork C, Lundy M, Cohen BM, Renshaw PF. Abnormal glutamatergic neurotransmission and neuronal-glial interactions in acute mania. Biol Psychiatry. 2008;64(8):718–726. doi: 10.1016/j.biopsych.2008.05.014. [DOI] [PMC free article] [PubMed] [Google Scholar]
- Ongur D, Prescot AP, Jensen JE, Cohen BM, Renshaw PF. Creatine abnormalities in schizophrenia and bipolar disorder. Psychiatry Res. 2009;172(1):44–48. doi: 10.1016/j.pscychresns.2008.06.002. [DOI] [PMC free article] [PubMed] [Google Scholar]
- Oribe N, Onitsuka T, Hirano S, Hirano Y, Maekawa T, Obayashi C, Ueno T, Kasai K, Kanba S. Differentiation between bipolar disorder and schizophrenia revealed by neural oscillation to speech sounds: an MEG study. Bipolar Disord. 2010;12(8):804–812. doi: 10.1111/j.1399-5618.2010.00876.x. [DOI] [PubMed] [Google Scholar]
- Overall JE, Gorham DR. The brief psychiatric rating scale. Psychological Reports. 1962;10:799–812. [Google Scholar]
- Paz RD, Tardito S, Atzori M, Tseng KY. Glutamatergic dysfunction in schizophrenia: from basic neuroscience to clinical psychopharmacology. Eur Neuropsychopharmacol. 2008;18(11):773–786. doi: 10.1016/j.euroneuro.2008.06.005. [DOI] [PMC free article] [PubMed] [Google Scholar]
- Plaze M, Bartres-Faz D, Martinot JL, Januel D, Bellivier F, De Beaurepaire R, Chanraud S, Andoh J, Lefaucheur JP, Artiges E, Pallier C, Paillere-Martinot ML. Left superior temporal gyrus activation during sentence perception negatively correlates with auditory hallucination severity in schizophrenia patients. Schizophr Res. 2006;87(1-3):109–115. doi: 10.1016/j.schres.2006.05.005. [DOI] [PubMed] [Google Scholar]
- Poels EM, Kegeles LS, Kantrowitz JT, Javitt DC, Lieberman JA, Abi-Dargham A, Girgis RR. Glutamatergic abnormalities in schizophrenia: a review of proton MRS findings. Schizophr Res. 2014a;152(2-3):325–332. doi: 10.1016/j.schres.2013.12.013. [DOI] [PMC free article] [PubMed] [Google Scholar]
- Poels EM, Kegeles LS, Kantrowitz JT, Slifstein M, Javitt DC, Lieberman JA, Abi-Dargham A, Girgis RR. Imaging glutamate in schizophrenia: review of findings and implications for drug discovery. Mol Psychiatry. 2014b;19(1):20–29. doi: 10.1038/mp.2013.136. [DOI] [PubMed] [Google Scholar]
- Provencher SW. Estimation of metabolite concentrations from localized in vivo proton NMR spectra. Magn Reson Med. 1993;30(6):672–679. doi: 10.1002/mrm.1910300604. [DOI] [PubMed] [Google Scholar]
- Provencher SW. Automatic quantitation of localized in vivo 1H spectra with LCModel. NMR Biomed. 2001;14(4):260–264. doi: 10.1002/nbm.698. [DOI] [PubMed] [Google Scholar]
- Rajarethinam RP, DeQuardo JR, Nalepa R, Tandon R. Superior temporal gyrus in schizophrenia: a volumetric magnetic resonance imaging study. Schizophr Res. 2000;41(2):303–312. doi: 10.1016/s0920-9964(99)00083-3. [DOI] [PubMed] [Google Scholar]
- Rauschecker JP, Scott SK. Maps and streams in the auditory cortex: nonhuman primates illuminate human speech processing. Nat Neurosci. 2009;12(6):718–724. doi: 10.1038/nn.2331. [DOI] [PMC free article] [PubMed] [Google Scholar]
- Sanacora G, Zarate CA, Krystal JH, Manji HK. Targeting the glutamatergic system to develop novel, improved therapeutics for mood disorders. Nature reviews Drug discovery. 2008;7(5):426–437. doi: 10.1038/nrd2462. [DOI] [PMC free article] [PubMed] [Google Scholar]
- Schifitto G, Zhong J, Gill D, Peterson DR, Gaugh MD, Zhu T, Tivarus M, Cruttenden K, Maggirwar SB, Gendelman HE, Dewhurst S, Gelbard HA. Lithium therapy for human immunodeficiency virus type 1-associated neurocognitive impairment. J Neurovirol. 2009;15(2):176–186. doi: 10.1080/13550280902758973. [DOI] [PMC free article] [PubMed] [Google Scholar]
- Schwerk A, Alves FD, Pouwels PJ, van Amelsvoort T. Metabolic alterations associated with schizophrenia: a critical evaluation of proton magnetic resonance spectroscopy studies. Journal of neurochemistry. 2014;128(1):1–87. doi: 10.1111/jnc.12398. [DOI] [PubMed] [Google Scholar]
- Seese RR, O'Neill J, Hudkins M, Siddarth P, Levitt J, Tseng B, Wu KN, Caplan R. Proton magnetic resonance spectroscopy and thought disorder in childhood schizophrenia. Schizophr Res. 2011;133(1-3):82–90. doi: 10.1016/j.schres.2011.07.011. [DOI] [PMC free article] [PubMed] [Google Scholar]
- Shenton ME, Kikinis R, Jolesz FA, Pollak SD, LeMay M, Wible CG, Hokama H, Martin J, Metcalf D, Coleman M, et al. Abnormalities of the left temporal lobe and thought disorder in schizophrenia. A quantitative magnetic resonance imaging study. N Engl J Med. 1992;327(9):604–612. doi: 10.1056/NEJM199208273270905. [DOI] [PubMed] [Google Scholar]
- Shinn AK, Baker JT, Cohen BM, Ongur D. Functional connectivity of left Heschl's gyrus in vulnerability to auditory hallucinations in schizophrenia. Schizophr Res. 2013;143(2-3):260–268. doi: 10.1016/j.schres.2012.11.037. [DOI] [PMC free article] [PubMed] [Google Scholar]
- Sikoglu EM, Jensen JE, Vitaliano G, Liso Navarro AA, Renshaw PF, Frazier JA, Moore CM. Bioenergetic measurements in children with bipolar disorder: a pilot 31P magnetic resonance spectroscopy study. PLoS One. 2013;8(1):e54536. doi: 10.1371/journal.pone.0054536. [DOI] [PMC free article] [PubMed] [Google Scholar]
- Silverstone PH, McGrath BM. Lithium and valproate and their possible effects on themyo-inositol second messenger system in healthy volunteers and bipolar patients. Int Rev Psychiatry. 2009;21(4):414–423. doi: 10.1080/09540260902962214. [DOI] [PubMed] [Google Scholar]
- Skold M, Kallstrand J, Nehlstedt S, Nordin A, Nielzen S, Holmberg J, Adolfsson R. Thalamocortical abnormalities in auditory brainstem response patterns distinguish DSM-IV bipolar disorder type I from schizophrenia. J Affect Disord. 2014;169:105–111. doi: 10.1016/j.jad.2014.08.002. [DOI] [PubMed] [Google Scholar]
- Skolnick P, Popik P, Trullas R. Glutamate-based antidepressants: 20 years on. Trends in pharmacological sciences. 2009;30(11):563–569. doi: 10.1016/j.tips.2009.09.002. [DOI] [PubMed] [Google Scholar]
- Soeiro-de-Souza MG, Salvadore G, Moreno RA, Otaduy MC, Chaim KT, Gattaz WF, Zarate CA, Jr, Machado-Vieira R. Bcl-2 rs956572 polymorphism is associated with increased anterior cingulate cortical glutamate in euthymic bipolar I disorder. Neuropsychopharmacology. 2013;38(3):468–475. doi: 10.1038/npp.2012.203. [DOI] [PMC free article] [PubMed] [Google Scholar]
- Steen RG, Hamer RM, Lieberman JA. Measurement of brain metabolites by 1H magnetic resonance spectroscopy in patients with schizophrenia: a systematic review and meta-analysis. Neuropsychopharmacology. 2005;30(11):1949–1962. doi: 10.1038/sj.npp.1300850. [DOI] [PubMed] [Google Scholar]
- Szulc A, Galinska B, Tarasow E, Waszkiewicz N, Konarzewska B, Poplawska R, Bibulowicz D, Simonienko K, Walecki J. Proton magnetic resonance spectroscopy study of brain metabolite changes after antipsychotic treatment. Pharmacopsychiatry. 2011;44(4):148–157. doi: 10.1055/s-0031-1279739. [DOI] [PubMed] [Google Scholar]
- Szulc A, Galinska-Skok B, Waszkiewicz N, Bibulowicz D, Konarzewska B, Tarasow E. Proton magnetic resonance spectroscopy changes after antipsychotic treatment. Curr Med Chem. 2013;20(3):414–427. [PubMed] [Google Scholar]
- Takahashi T, Suzuki M, Zhou SY, Tanino R, Hagino H, Kawasaki Y, Matsui M, Seto H, Kurachi M. Morphologic alterations of the parcellated superior temporal gyrus in schizophrenia spectrum. Schizophr Res. 2006;83(2-3):131–143. doi: 10.1016/j.schres.2006.01.016. [DOI] [PubMed] [Google Scholar]
- Tansey FA, Farooq M, Cammer W. Glutamine synthetase in oligodendrocytes and astrocytes: new biochemical and immunocytochemical evidence. Journal of neurochemistry. 1991;56(1):266–272. doi: 10.1111/j.1471-4159.1991.tb02591.x. [DOI] [PubMed] [Google Scholar]
- Theberge J, Jensen JE, Rowland LM. Regarding “Increased prefrontal and hippocampal glutamate concentration in schizophrenia: evidence from a magnetic resonance spectroscopy study”. Biol Psychiatry. 2007;61(10):1218–1219. doi: 10.1016/j.biopsych.2006.05.037. author reply 1219-1220. [DOI] [PubMed] [Google Scholar]
- Umbricht D, Krljes S. Mismatch negativity in schizophrenia: a meta-analysis. Schizophr Res. 2005;76(1):1–23. doi: 10.1016/j.schres.2004.12.002. [DOI] [PubMed] [Google Scholar]
- Vita A, De Peri L, Deste G, Sacchetti E. Progressive loss of cortical gray matter in schizophrenia: a meta-analysis and meta-regression of longitudinal MRI studies. Transl Psychiatry. 2012;2:e190. doi: 10.1038/tp.2012.116. [DOI] [PMC free article] [PubMed] [Google Scholar]
- Yamada M, Wilber JF. Reciprocal regulation of preprothyrotropin-releasing hormone (TRH) mRNA in the rat anterior hypothalamus by thyroid hormone: dissociation from TRH concentrations during hypothyroidism. Neuropeptides. 1990;15(1):49–53. doi: 10.1016/0143-4179(90)90160-z. [DOI] [PubMed] [Google Scholar]
- Yatham LN, Kennedy SH, Schaffer A, Parikh SV, Beaulieu S, O'Donovan C, MacQueen G, McIntyre RS, Sharma V, Ravindran A, Young LT, Young AH, Alda M, Milev R, Vieta E, Calabrese JR, Berk M, Ha K, Kapczinski F. Canadian Network for Mood and Anxiety Treatments (CANMAT) and International Society for Bipolar Disorders (ISBD) collaborative update of CANMAT guidelines for the management of patients with bipolar disorder: update 2009. Bipolar Disord. 2009;11(3):225–255. doi: 10.1111/j.1399-5618.2009.00672.x. [DOI] [PubMed] [Google Scholar]
- Yildiz-Yesiloglu A, Ankerst DP. Neurochemical alterations of the brain in bipolar disorder and their implications for pathophysiology: a systematic review of the in vivo proton magnetic resonance spectroscopy findings. Prog Neuropsychopharmacol Biol Psychiatry. 2006;30(6):969–995. doi: 10.1016/j.pnpbp.2006.03.012. [DOI] [PubMed] [Google Scholar]
- Young RC, Biggs JT, Ziegler VE, Meyer DA. A rating scale for mania: reliability, validity and sensitivity. Br J Psychiatry. 1978;133:429–435. doi: 10.1192/bjp.133.5.429. [DOI] [PubMed] [Google Scholar]
- Yuksel C, Ongur D. Magnetic resonance spectroscopy studies of glutamate-related abnormalities in mood disorders. Biol Psychiatry. 2010;68(9):785–794. doi: 10.1016/j.biopsych.2010.06.016. [DOI] [PMC free article] [PubMed] [Google Scholar]
- Zatorre RJ, Evans AC, Meyer E, Gjedde A. Lateralization of phonetic and pitch discrimination in speech processing. Science. 1992;256(5058):846–849. doi: 10.1126/science.1589767. [DOI] [PubMed] [Google Scholar]