Abstract
Background and Purpose
DWI can reliably identify critically ischemic tissue (CIT) shortly after stroke onset. We tested if thresholded CT-CBF and CT-CBV maps are sufficiently accurate to substitute for DWI for estimating CIT volume.
Methods
Ischemic volumes of 55 patients with acute anterior circulation stroke were assessed on DWI by visual segmentation, and CT-CBF and CT-CBV with segmentation using 15% and 30% thresholds, respectively. The contrast-to-noise ratios (CNR) of ischemic regions on the DWI and CTP images were measured. Correlation and Bland-Altman analyses were used to assess reliability of CTP.
Results
Mean CNRs for DWI, CT-CBF and CT-CBV were 4.3, 0.9 and 0.4, respectively. CTP and DWI lesion volumes were highly correlated (R2=0.87 for CT-CBF; R2=0.83 for CT-CBV; p<0.001). Bland-Altman analyses revealed little systemic bias (−2.6 ml) but high measurement variability (95% CI ±56.7 ml) between mean CT-CBF and DWI lesion volumes, and systemic bias (−26 ml) and high measurement variability (95% CI ±64.0 ml) between mean CT-CBV and DWI lesion volumes. A simulated treatment study demonstrated that using CTP-CBF instead of DWI for detecting a statistically significant effect would require at least twice as many patients.
Conclusions
The poor CNRs of CT-CBV and CT-CBF compared to DWI result in large measurement error making it problematic to substitute CTP for DWI in selecting individual acute stroke patients for treatment. CTP could be used for treatment studies of patient groups, but the number of patients needed to identify a significant effect is much higher than if DWI is used.
Keywords: acute stroke, CT perfusion, DWI
Introduction
Anterior circulation strokes due to occlusions of the proximal middle cerebral artery (MCA), and the terminal internal carotid artery (ICA) constitute approximately one-third of ischemic strokes; if untreated, less than twenty percent have favorable outcomes.1 These strokes can be successfully treated by thrombolysis (IV or IA) or thrombectomy.2 Early infarct volume determinations on DWI have been used for triage of such individuals and for clinical trials.3, 4 The widespread availability of high speed CT with its ability to perform perfusion imaging has led to attempts to replace DWI with CT perfusion (CTP) imaging.5–7
This effort raises two important questions: Can CTP substitute for DWI in individual patient triage? And, can CTP replace DWI for stroke treatment trials? The answers depend on the signal characteristics of CTP. The critical issue is whether signal differences between severely ischemic regions and normal tissue are sufficiently distinct to distinguish the two areas with adequate precision to make a volume determination clinically useful. More specifically, are the signal-to-noise (SNR) and contrast-to-noise (CNR) ratios sufficiently high such that CTP can replace DWI for individual triage or for clinical trials? Our purpose is to attempt to answer these questions through an analysis of 55 patients who presented with occlusions of the terminal ICA, proximal MCA or both, and in whom CTP and DWI studies were performed within three hours of each other.
Methods
Patients
In this IRB approved, Health Insurance Portability and Accountability Act (HIPAA) compliant study, we reviewed the medical records of 200 consecutive patients with acute stroke over 2 years. Inclusion criteria were: (1) imaging within 9 hours of symptom onset including NCCT, head and neck CTA, CTP, and DWI within 3 hours of CTP; (2) anterior circulation large vessel occlusion (ICA terminus and/or MCA M1 or M2); and (3) available 3-month modified Rankin Score (mRS). Nine hours from symptom onset to imaging was chosen because multiple studies have shown the safe use of newer intra-arterial recanalization devices well beyond the standard 6 to 8 hour time window for symptom onset to groin puncture.3, 8
Fifty-five patients met inclusion criteria. Of 139 excluded patients: 52 had no proximal occlusion; 13 had posterior circulation strokes; 41 had no DWI; 21 had CTP-DWI interval >3 hours; 2 had inappropriate CTP location; 10 had uninterpretable images; and 6 did not have 3-month mRS. Patients were treated according to standard institutional protocols, including intravenous thrombolysis and endovascular therapy.
Image acquisition
CT was performed using a helical scanner (LightSpeed 64, GE Medical Systems, Milwaukee, WI). Head CT was obtained using helical mode (1.25 mm thickness, kV 120, mAs 250) reconstructed at 5 mm intervals.
CTA was performed with administration of 80–90 ml of nonionic contrast (Isovue Multipack-370; Bracco Diagnostics Inc., Princeton, NJ) followed by 40 ml of saline, both at 4 ml/s (1.25 mm thickness, 120 kV, auto mA, 0.5–0.7 s/rotation). Shuttle mode CTP used 35 ml of nonionic contrast (Isovue Multipack-370; Bracco Diagnostics Inc., Princeton, NJ) at 7 ml/s followed by 40 ml of saline at 4 ml/s (acquisition time 90 s, 80 kV, 500 mAs maximum), providing 16, 5-mm thick slices through the anterior circulation. Post-processing was performed with automated GE CTP 4D software.
MRI was performed on a 1.5 Tesla Signa scanner (GE Medical Systems, Milwaukee, WI). DWI used a single-shot echo-planar spin-echo sequence with two 180-degree radiofrequency pulses. Three images/slice were acquired at b=0 s/mm2, followed by 25 at b=1000 s/mm2. Imaging parameters were TR/TE 5000/80–110 ms, FOV 22 cm, matrix 128×128 zero-filled to 256×256, 5-mm section thickness, 1-mm gap.
Image analysis
DWI and thresholded CTP images were segmented by a radiologist with 2 years of dedicated neuroradiology experience, blinded to clinical histories and follow-up imaging. For each patient, a 15% threshold was applied to CT-cerebral blood flow (CBF) and a 30% threshold to CT-cerebral blood volume (CBV) maps. These thresholds were adopted from published methodology5 with slight modification based on normalization to thalamus, rather than to mean gray/white matter of the contralateral hemisphere. To determine quantitative CT-CBF and CT-CBV cut-off values, normalization was as follows: 0.7 cm2 regions-of-interest (ROIs) were placed on thalamus contralateral to the ischemic lesion. The thalamic ROI values were multiplied by 0.15 for CT-CBF and 0.30 for CT-CBV maps. Pixel values for each map were dichotomized such that pixels above the threshold were bright, and pixels below the threshold (CIT) were black. The black pixels were segmented.
Segmentation of DWI and CTP maps was performed by a radiologist using semi-automated software (Analyze 8.1, AnalyzeDirect, Mayo Clinic, Rochester, MN). ADC and FLAIR images were available during DWI segmentation to help distinguish acute from subacute/chronic ischemic DWI-hyperintense lesions. All concurrent CT, CTA, and non-thresholded CTP maps were available during CTP segmentation in order to provide occlusion site and presence of subacute/chronic infarction.
To assess inter-rater reliability, CT-CBF maps were thresholded and segmented by a research assistant, and reviewed by an experienced neuroradiologist who had not performed the initial analysis.
Signal-to-noise ratio and contrast-to-noise ratio measurements
SNR calculations for each patient were based on measurements from the image slice corresponding to the DWI lesion center. A ROI was drawn encompassing the lesion. The SNR was defined as the average of the signal intensities of voxels within the ROI divided by their standard deviation. For CNR calculations, a similar-sized ROI was drawn within normal appearing brain tissue in a similar contralateral hemisphere location. The CNR was defined as the absolute difference between the mean signal intensities of the lesion and normal ROI’s divided by the mean standard deviations of both ROI’s.
Statistical analysis
Continuous variables are shown as means (±SD or 95% CI), or medians (IQR). Linear regression was performed to determine (1) correlation between CT-CBF and CT-CBV CIT versus DWI lesion volumes; and (2) correlation between the inter-rater CTP-CBF CIT volume measurements. Bland-Altman plots were used to assess variability in the CTP lesion volume measurements. Analyses were performed using MedCalc (version 11.5.1.0; Mariakerke, Belgium); p<0.05 was considered significant. For simulation of a hypothetical treatment trial, the sample size was calculated using the online calculator of Rollin Brant (rollin@stat.ubc.ca) at http://www.stat.ubc.ca/~rollin/stats/ssize/b2.html.9
Results
Patient demographics and clinical and imaging characteristics are shown in Table 1. Mean time (±SD) from symptom onset to CTP was 3 hrs 48 min (±1:47). The median (IQR) time between CT and MRI studies was 51 minutes (41–65).
Table 1.
Admission Variables
| Variable | All patients, n = 55 |
|---|---|
| Female, n (%) | 26 (47%) |
| Age, y, mean (SD) | 66 (62–71) |
| Right hemisphere, n (%) | 23 (42%) |
| Baseline NIHSS, median (IQR) | 14 (6–18) |
| DWI volume (ml), mean (95% CI) | 58 (36–79) |
| 15% CBF volume (ml), mean (95% CI) | 60 (42–78) |
| 30% CBV volume (ml), mean (95% CI) | 32 (13 – 50) |
| Ictus to CTP (hr:min), mean (±SD) | 3:48 (±1:47) |
| CTP to DWI (min), median (IQR) | 51 (41–65) |
NIHSS, National Institutes of Health Stroke Scale; DWI, diffusion-weighted imaging; CBF, cerebral blood flow; CBV, cerebral blood volume; CTP, computed tomography perfusion; CI, confidence interval; IQR, interquartile range; SD, standard deviation.
Signal-to-noise and contrast-to-noise ratios of DWI and CTP ischemic lesions
Mean contrast-to-noise and signal-to-noise ratios are shown in Table 2. The mean DWI SNR is over 8 times higher and the mean DWI CNR is over 4 times higher than the corresponding CT-CBF and CT-CBV values. There was no correlation between the CNR of DWI and CTP-CBF (R2=0.00) or between the CNR of DWI and CTP-CBV (R2=0.00).
Table 2.
Signal-to-noise and contrast-to-noise ratios of ischemic lesions for DWI were significantly higher than those for CT-CBV and CT-CBF (all p<0.001).
| SNR (SD) | CNR (SD) | |
|---|---|---|
| DWI | 10.0 (3.6) | 4.3 (1.6) |
| CT-CBF | 0.8 (0.3) | 0.9 (0.5) |
| CT-CBV | 1.2 (0.5) | 0.4 (0.4) |
SNR, signal-to-noise ratio; CNR, contrast-to-noise ratio; SD, standard deviation; DWI, diffusion weighted image; CBF, cerebral blood flow; CBV, cerebral blood volume.
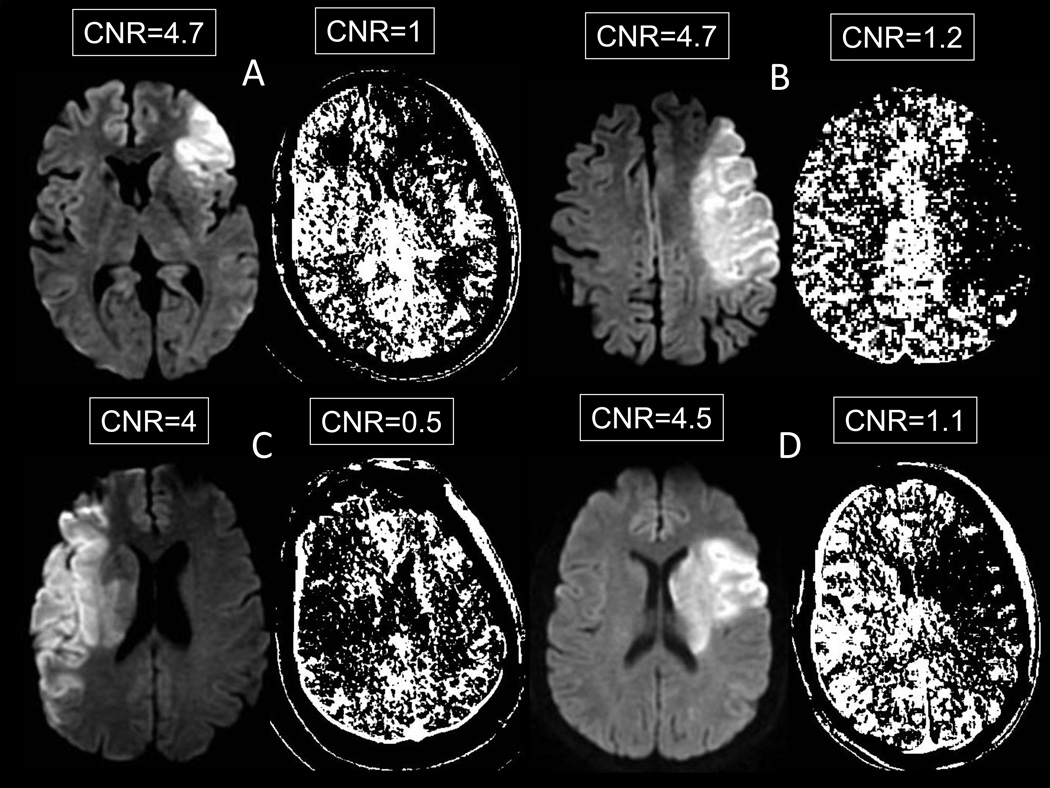
Figure 1 displays images from 4 patients with CNR values near the mean for DWI and CT-CBF. Visual inspection reveals that CT-CBF lesions correspond to the DWI lesion in each case. However, the correspondence is not perfect and the ischemic lesion margin is much easier to identify on DWI than on CT-CBF maps, particularly when the margin is in white matter. This difference is best explained by the lower CNR of the CT-CBF images. The relationship between lesion margin conspicuity and CNR is well illustrated by comparing the Figure 1C CT-CBF image to other CT-CBF and DWI images in Figure 1. This image has a CNR of 0.5, and the lesion margins are very difficult to ascertain. There appears to be another ischemic lesion in the contralateral hemisphere, where no DWI abnormality exists.
Figure 1.
Contrast-to-noise ratios on DWI versus CT-CBF in 4 patients (A – D). The CTP map pixels are dichotomized into white (above the corresponding 30% CT-CBV or 15% CT-CBF threshold) and black (below the threshold)
Relationship of CTP to DWI ischemic lesions
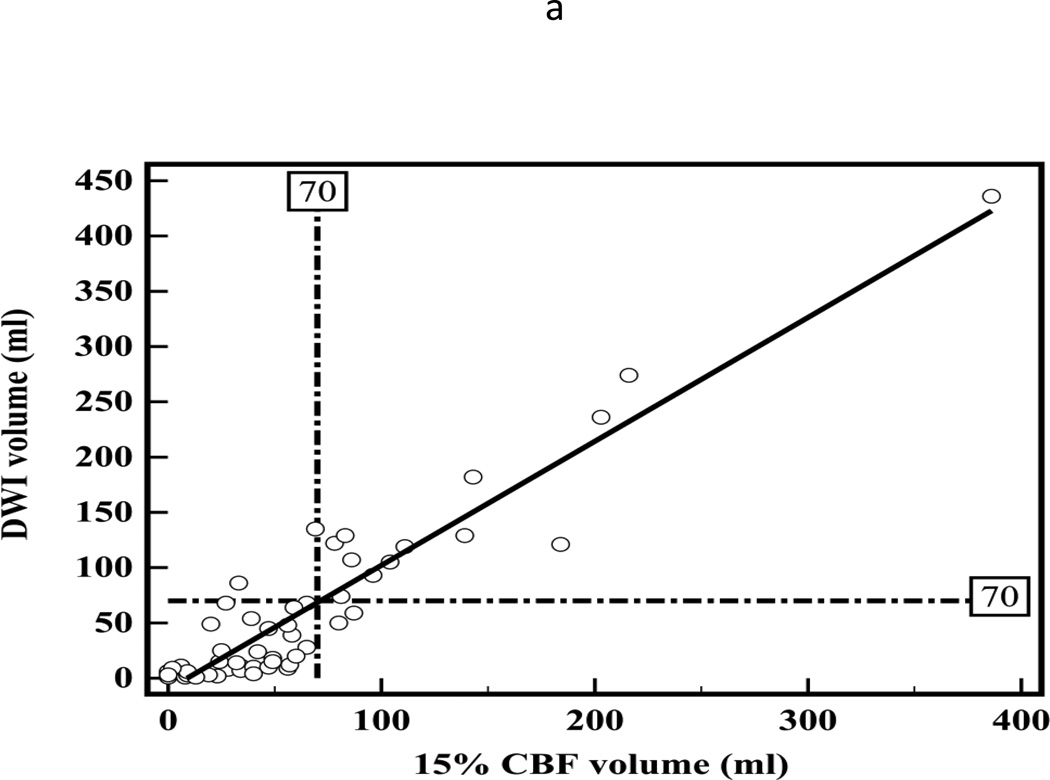
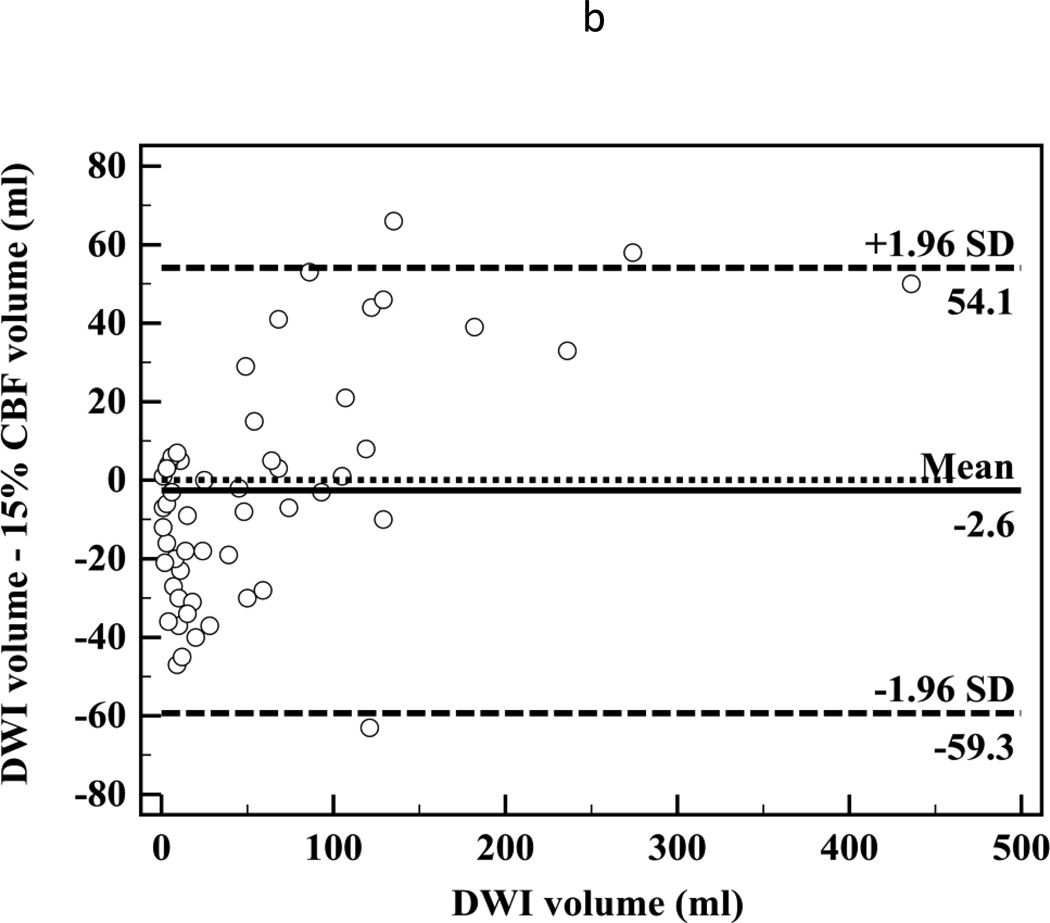
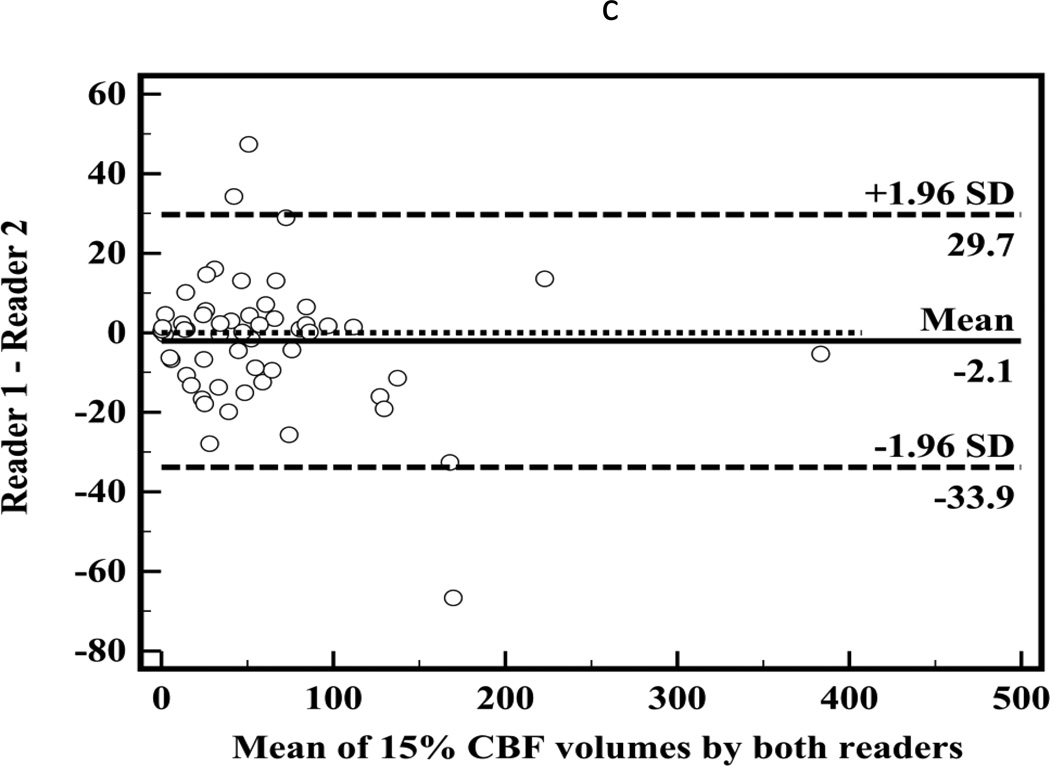
There was high correlation between segmented CT-CBF and DWI lesion volumes (R2=0.87, slope=1.1 for CBF; Figure 2a). Bland-Altman analyses showed high measurement variability (95% confidence intervals (CI) = ±56.7 ml, Figure 2b) with little systemic bias (mean difference −2.6 ml). There was high inter-observer correlation between segmented CT-CBF volumes (R2=0.93, slope=1.0). Bland-Altman analysis showed high inter-observer measurement variability (95% CI = ±31.8 ml) with little systemic bias (mean difference 2.1 ml, Figure 2c).
Figure 2.
(a) Linear regression showing correlation between DWI and 15% thresholded CT-CBF CIT volumes (R2=0.87, slope=1.1); (b) Bland-Altman plot showing differences between DWI and 15% thresholded CT-CBF; (c) Bland-Altman plot showing CT-CBF inter-reader differences.
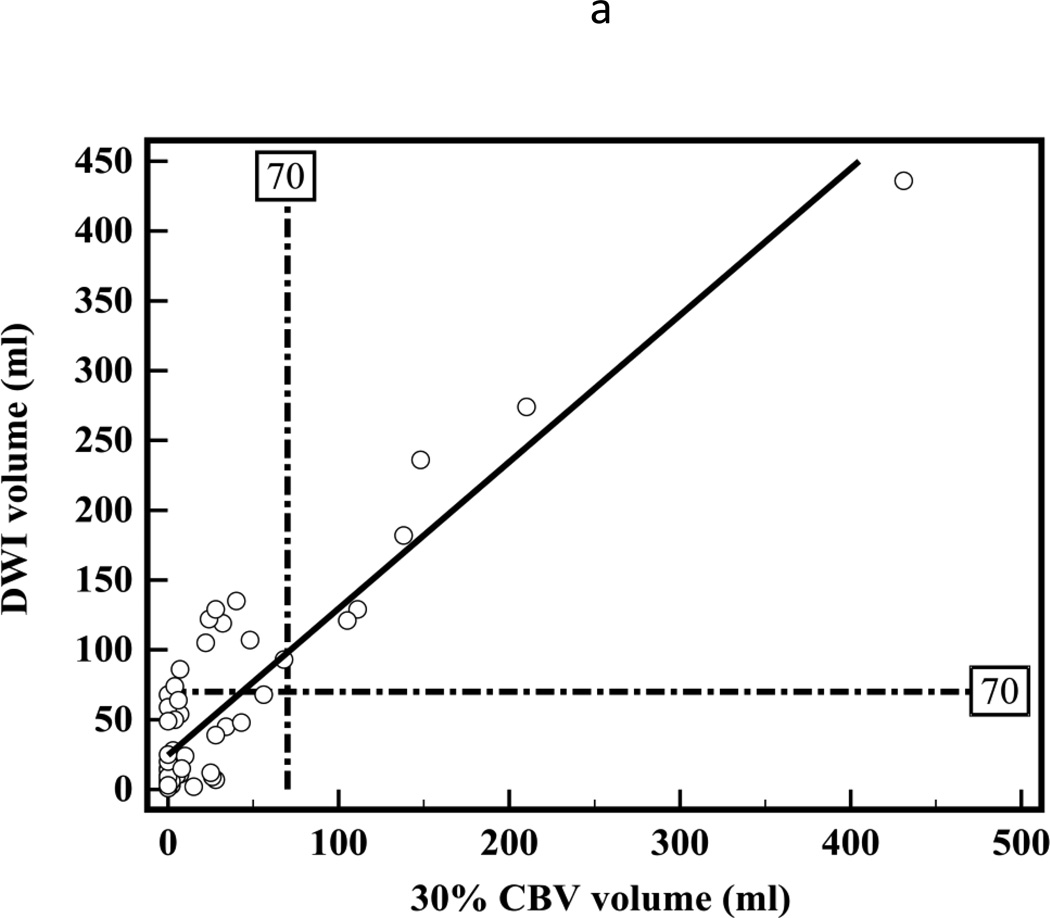
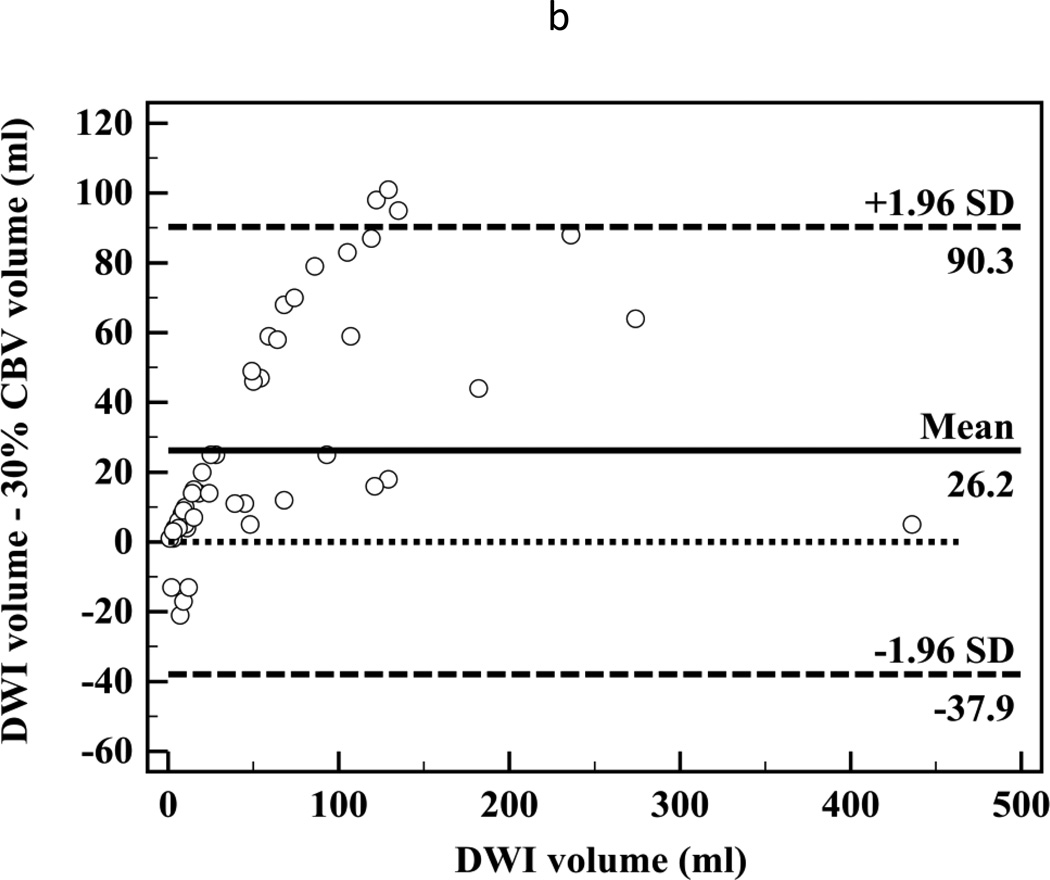
There was a high correlation between segmented CT-CBV and DWI lesion volumes (R2=0.83, slope=1.1; Figure 3a). Bland-Altman analyses showed high measurement variability (95% CI = ±64.1 ml, Figure 3b). The CT-CBV tended to underestimate the DWI lesion volumes (mean difference −26 ml).
Figure 3.
(a) Linear regression showing correlation between DWI and 30% thresholded CT-CBV CIT volumes (R2=0.83, slope=1.1). (b) Bland-Altman plot showing differences between DWI and 30% thresholded CT-CBV CIT volumes.
Patient numbers in simulated treatment trial using DWI and CT-CBF
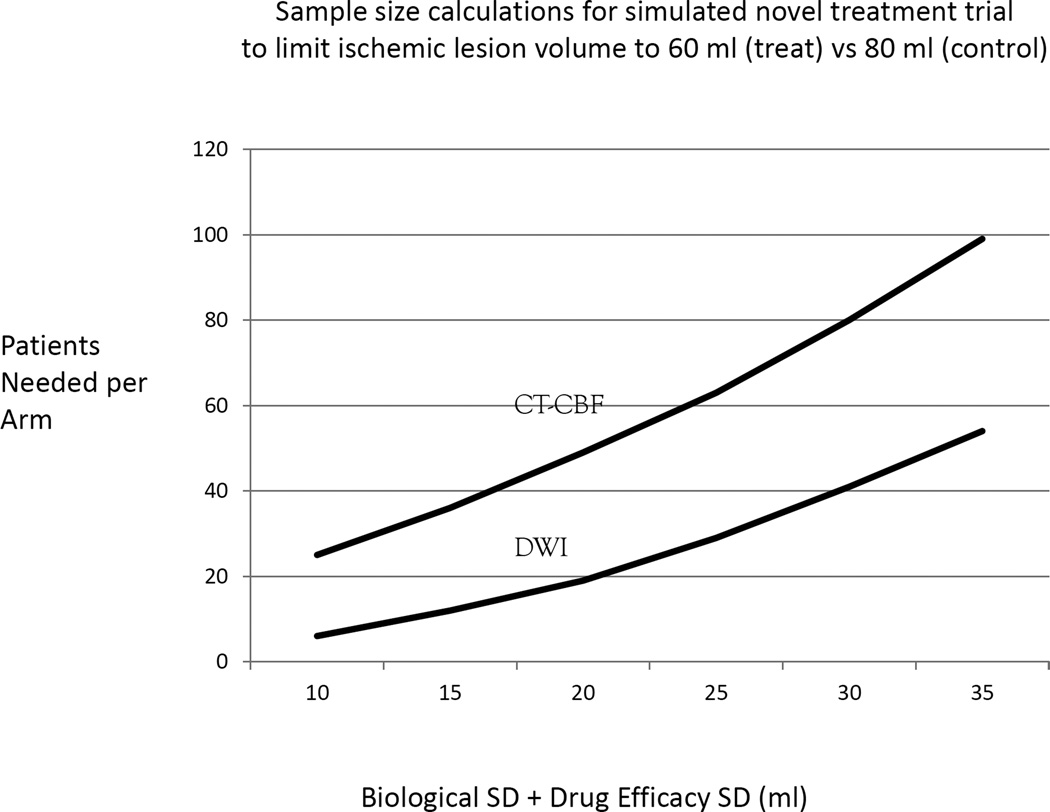
Because of high correlation between CT-CBF and DWI ischemic lesion volumes, it is possible to substitute CT-CBF measurements for DWI in studies involving a population. However, because of larger measurement error inherent in CT-CBF, more subjects would be necessary. To estimate the magnitude of the increased patient numbers needed, a simulated power calculation was performed on a hypothetical treatment study (Figure 4). In this study, the treatment goal is to reduce an ischemic lesion size on average by 20 ml, with a target mean ischemic lesion size of 60 ml for patients receiving the novel treatment compared to a mean of 80 ml for those in the control arm. DWI or CT-CBF is used to measure ischemic lesion sizes. Sources of error, aside from size measurement, include biological and treatment efficacy variability. The standard deviations for these sources can be summed together and estimated for a simulation of the patient number needed in each arm of the study. For this simulation, the sum of these SD’s range from 10 to 35 ml. The SD for measurement error of DWI is 5 ml,10 and the SD for the CT-CBF measurement error is 30 ml (Figure 2c). For both DWI and CT-CBF, we assume a power of 0.8 and seek to obtain statistical significance at the p<0.05 level.
Figure 4.
The study goal is to reduce an ischemic lesion size on average by 20 ml using the novel treatment.
Figure 4 depicts the patient number needed in each arm of the hypothetical trial. With low biological and treatment efficacy variability (sum of SD=10ml), a DWI based study would require 6 patients in each arm for a total of 12; for a CT-CBF study, 50 patients would be needed. At the high end of biological and treatment efficacy variability (sum of SD=35 ml), a DWI study would require 108 (54 per arm), and the CT-CBF based study would require 198 patients (99 per arm). Thus, using CT-CBF instead of DWI would require approximately 2 to 4 times the number of patients to test the treatment.
Discussion
We report an analysis of 55 patients with proximal anterior circulation occlusions that may be more informative than prior studies because CT and MRI were performed within an hour of each other on average. We found that ischemic lesion volume determination by CTP has large measurement error, and that this is most likely due to poor contrast-to-noise ratios of CTP compared to DWI. Consequently, CTP should not replace DWI in individual patient triage decisions or in clinical trials.
Severe cerebral ischemia produces signal abnormalities on DWI that have been studied in detail in animal models and validated in human stroke.11–13 The DWI abnormalities are highly reproducible across laboratories, and research and clinical MRI scanners.14–17 Ischemia produces high signal on DWI through two mechanisms: reduced diffusivity of water and increased water content. The SNR of an ischemic lesion is lower immediately after stroke onset because reduced diffusivity of water is the principle mechanism. However, it increases with time as increased water content in addition to reduced diffusivity contributes to the signal. Consequently, ischemic lesions have a high SNR and CNR within a few hours after stroke onset (Table 2).
The factors that produce CT-CBF and CT-CBV abnormalities in cerebral ischemia are complex. The SNR and CNR are dependent on many factors including the collateral circulation, contrast amount, cardiac output, quality and intensity of the X-ray beam, CTP reconstruction algorithm, and other factors.18–21 Moreover, there is no direct relationship between cerebral CBF and infarction; a combination of CBF and time produces infarction.22 SNR and CNR depend on the amount of contrast within the cerebral blood pool. The contrast attenuates the x-ray beam, and the decrease in the x-ray intensity detected is the basis for CTP image production.23 The change in intensity is small, approximately 1%, and there is even less attenuation in ischemic tissue. These factors produce noisy images, with SNRs and CNRs that are much lower than those for DWI (Table 2). Additionally, relatively few animal studies have validated CTP,24 and its use is based primarily on human correlation studies between CTP and DWI or follow-up CT studies performed days after the CTP study.5–7, 25, 26 Nevertheless, it has been repeatedly demonstrated that there is a strong positive correlation between CT-CBF and DWI images, albeit with low SNR and CNR.5, 6, 27
Similar to prior studies, we have shown a high correlation between CTP and DWI early ischemic lesion volumes, with CT-CBF volumes more closely approximating and CT-CBV volumes underestimating DWI volumes.5, 6 However, Bland-Altman analyses demonstrate that variability between CTP and DWI lesion volume measurements is very high. One contributory factor for such high variability is the poor contrast-to-noise ratios on CTP images.21 The Bland-Altman plot 95% confidence limits tell us how far apart new measurements may be for individuals compared to a reference standard. If the 95% confidence limits are substantial, the new method cannot substitute for the reference standard.28 For both CT-CBV and CT-CBF, 95 percent confidence intervals are more than ±55 ml. According to our data, if a DWI lesion volume is 70 ml, with 95 percent confidence, the CT-CBF lesion could range from 10.7 to 124.1 ml. Unless a CT-CBF lesion was larger than 124 ml, it would be difficult to determine confidently that a DWI lesion was greater than 70 ml for potential exclusion from intra-arterial therapy.29 Conversely, any lesion over 11 ml on CT-CBF could represent a DWI lesion greater than 70 ml and instituting intra-arterial therapy could cause harm. Thus if a 70 ml threshold is used, all cases in which CBF ischemic lesion volume measured between 10 and 125 ml would be indeterminate. In the cases analyzed for the present study approximately 45% would be indeterminate. The problem is similar if another volume threshold is used.
Our findings of CTP measurement variability are similar to those of other investigators. Campbell et al., comparing 31% relative CBF to DWI lesion volumes, found a mean difference of −11.3 ml with CIs of −46.7 to 24.2 ml.6 Thierfelder et al. found a mean difference of 4.86 with CIs of −41.20 to 50.87 ml for inter-reader whole brain CT-CBF measurements.30 By contrast, DWI measurement variability is considerably lower. In one article, the overall intra-rater and inter-rater percent differences in DWI lesion volume measurements were less than 5% and Bland-Altman plots showed 95% CIs in the range of ±12 ml.10 The data lead to the conclusion that CTP measurement variability is too high to make treatment decisions in individual patients if the treatment is potentially harmful to patients with an infarct above a certain threshold.
Because of the high correlation between CT-CBF and DWI lesion volumes, it could be scientifically valid to use CT-CBF in a clinical trial using ischemic lesion volume. However, a higher number of patients would be needed to properly power the trial. In the simulation shown in Figure 4, approximately 2 to 4 times the number of patients would be required if the trial inclusion used CT-CBF instead of DWI. In an actual clinical trial, the numbers would be different depending on trial design, but many more patients would be required for a CT-CBF based trial. This raises ethical issues. Can such a trial be justified if an alternative (DWI) requiring many fewer patients exists? Even if such a trial were successful, CT-CBF could not be used subsequently for individual patient triage for the reasons described above. If a therapy were shown to be successful using CT-CBF, then another trial using DWI would likely be necessary because it does have the reliability to be used in single patient triage.
Limitations of our study include the retrospective analysis of clinically acquired data. Because MRI scans were performed up to 3 hours after the CT, it is possible that CIT lesion volumes changed between acquisitions. In a widely cited paper, there is an estimated average infarct growth rate of 5.4 ml/hr.31 Since the median time between scans was 51 minutes, there was likely little lesion growth in the majority of cases. In addition, if there were substantial infarct growth, the DWI volumes would have been consistently larger than the CT-CBF volumes. Other limitations are the relatively small number of consecutive stroke patients, which was a consequence of our strict inclusion criteria of anterior circulation large vessel occlusion with admission CT/CTA/CTP obtained within 3 hours of DWI and within 9 hours of symptom onset; the heterogeneity in occlusion location for our study size; and the small lesion volumes in some patients.
Conclusions
Severely ischemic lesion volumes on thresholded CTP maps correlate highly with DWI lesion volumes in acute stroke patients with anterior circulation proximal vessel occlusions. However, large measurement error, likely due to poor CNR of ischemic lesions on CTP, severely limits their use in selecting patients for intra-arterial therapy.
Acknowledgments
Sources of funding
This work was supported by grants from the NIH SPOTRIAS (Special Program of Translational Research in Acute Stroke) Network (P50 NS051343), Agency for Healthcare Research and Quality (R01 HS11392), and MGH(Massachusetts General Hospital) Clinical Research Center (No. 1 UL1 RR025758-01).
Disclosures
AJY, research support from Penumbra, Inc. MHL, support from GE Healthcare and consultant to Millennium Pharmaceuticals.
References
- 1.Lima FO, Furie KL, Silva GS, Lev MH, Camargo EC, Singhal AB, et al. Prognosis of untreated strokes due to anterior circulation proximal intracranial arterial occlusions detected by use of computed tomography angiography. JAMA neurology. 2014;71:151–157. doi: 10.1001/jamaneurol.2013.5007. [DOI] [PubMed] [Google Scholar]
- 2.Jauch EC, Saver JL, Adams HP, Jr, Bruno A, Connors JJ, Demaerschalk BM, et al. Guidelines for the early management of patients with acute ischemic stroke: a guideline for healthcare professionals from the American Heart Association/American Stroke Association. Stroke; a journal of cerebral circulation. 2013;44:870–947. doi: 10.1161/STR.0b013e318284056a. [DOI] [PubMed] [Google Scholar]
- 3.Lansberg MG, Straka M, Kemp S, Mlynash M, Wechsler LR, Jovin TG, et al. MRI profile and response to endovascular reperfusion after stroke (DEFUSE 2): a prospective cohort study. Lancet neurology. 2012;11:860–867. doi: 10.1016/S1474-4422(12)70203-X. [DOI] [PMC free article] [PubMed] [Google Scholar]
- 4.Wisco D, Uchino K, Saqqur M, Gebel JM, Aoki J, Alam S, et al. Addition of hyperacute MRI AIDS in patient selection, decreasing the use of endovascular stroke therapy. Stroke; a journal of cerebral circulation. 2014;45:467–472. doi: 10.1161/STROKEAHA.113.003880. [DOI] [PubMed] [Google Scholar]
- 5.Kamalian S, Kamalian S, Maas MB, Goldmacher GV, Payabvash S, Akbar A, et al. CT cerebral blood flow maps optimally correlate with admission diffusion-weighted imaging in acute stroke but thresholds vary by postprocessing platform. Stroke; a journal of cerebral circulation. 2011;42:1923–1928. doi: 10.1161/STROKEAHA.110.610618. [DOI] [PMC free article] [PubMed] [Google Scholar]
- 6.Campbell BC, Christensen S, Levi CR, Desmond PM, Donnan GA, Davis SM, et al. Cerebral blood flow is the optimal CT perfusion parameter for assessing infarct core. Stroke; a journal of cerebral circulation. 2011;42:3435–3440. doi: 10.1161/STROKEAHA.111.618355. [DOI] [PubMed] [Google Scholar]
- 7.Wintermark M, Flanders AE, Velthuis B, Meuli R, van Leeuwen M, Goldsher D, et al. Perfusion-CT assessment of infarct core and penumbra: receiver operating characteristic curve analysis in 130 patients suspected of acute hemispheric stroke. Stroke; a journal of cerebral circulation. 2006;37:979–985. doi: 10.1161/01.STR.0000209238.61459.39. [DOI] [PubMed] [Google Scholar]
- 8.Zaidat OO, Castonguay AC, Gupta R, Sun CH, Martin C, Holloway WE, et al. North American Solitaire Stent Retriever Acute Stroke registry: post-marketing revascularization and clinical outcome results. Journal of neurointerventional surgery. 2014;6:584–588. doi: 10.1136/neurintsurg-2013-010895. [DOI] [PubMed] [Google Scholar]
- 9.Rosner B. Fundamentals of Biostatistics. Cengage Learning; 2010. Hypothesis Testing: Categorical Data; pp. 352–409. [Google Scholar]
- 10.Luby M, Bykowski JL, Schellinger PD, Merino JG, Warach S. Intra- and interrater reliability of ischemic lesion volume measurements on diffusion-weighted, mean transit time and fluid-attenuated inversion recovery MRI. Stroke; a journal of cerebral circulation. 2006;37:2951–2956. doi: 10.1161/01.STR.0000249416.77132.1a. [DOI] [PMC free article] [PubMed] [Google Scholar]
- 11.Mintorovitch J, Yang GY, Shimizu H, Kucharczyk J, Chan PH, Weinstein PR. Diffusion-weighted magnetic resonance imaging of acute focal cerebral ischemia: comparison of signal intensity with changes in brain water and Na+,K(+)-ATPase activity. Journal of cerebral blood flow and metabolism : official journal of the International Society of Cerebral Blood Flow and Metabolism. 1994;14:332–336. doi: 10.1038/jcbfm.1994.40. [DOI] [PubMed] [Google Scholar]
- 12.Mintorovitch J, Moseley ME, Chileuitt L, Shimizu H, Cohen Y, Weinstein PR. Comparison of diffusion- and T2-weighted MRI for the early detection of cerebral ischemia and reperfusion in rats. Magnetic resonance in medicine : official journal of the Society of Magnetic Resonance in Medicine / Society of Magnetic Resonance in Medicine. 1991;18:39–50. doi: 10.1002/mrm.1910180106. [DOI] [PubMed] [Google Scholar]
- 13.Moseley ME, Cohen Y, Mintorovitch J, Chileuitt L, Shimizu H, Kucharczyk J, et al. Early detection of regional cerebral ischemia in cats: comparison of diffusion- and T2-weighted MRI and spectroscopy. Magnetic resonance in medicine : official journal of the Society of Magnetic Resonance in Medicine / Society of Magnetic Resonance in Medicine. 1990;14:330–346. doi: 10.1002/mrm.1910140218. [DOI] [PubMed] [Google Scholar]
- 14.Lansberg MG, Norbash AM, Marks MP, Tong DC, Moseley ME, Albers GW. Advantages of adding diffusion-weighted magnetic resonance imaging to conventional magnetic resonance imaging for evaluating acute stroke. Archives of neurology. 2000;57:1311–1316. doi: 10.1001/archneur.57.9.1311. [DOI] [PubMed] [Google Scholar]
- 15.Fiebach JB, Schellinger PD, Jansen O, Meyer M, Wilde P, Bender J, et al. CT and diffusion-weighted MR imaging in randomized order: diffusion-weighted imaging results in higher accuracy and lower interrater variability in the diagnosis of hyperacute ischemic stroke. Stroke; a journal of cerebral circulation. 2002;33:2206–2210. doi: 10.1161/01.str.0000026864.20339.cb. [DOI] [PubMed] [Google Scholar]
- 16.Girot M, Leclerc X, Gauvrit JY, Verdelho A, Pruvo JP, Leys D. Cerebral magnetic resonance imaging within 6 hours of stroke onset: inter- and intra-observer reproducibility. Cerebrovascular diseases. 2003;16:122–127. doi: 10.1159/000070591. [DOI] [PubMed] [Google Scholar]
- 17.Ay H, Arsava EM, Vangel M, Oner B, Zhu M, Wu O, et al. Interexaminer difference in infarct volume measurements on MRI: a source of variance in stroke research. Stroke; a journal of cerebral circulation. 2008;39:1171–1176. doi: 10.1161/STROKEAHA.107.502104. [DOI] [PubMed] [Google Scholar]
- 18.Sanelli PC, Lev MH, Eastwood JD, Gonzalez RG, Lee TY. The effect of varying user-selected input parameters on quantitative values in CT perfusion maps. Academic radiology. 2004;11:1085–1092. doi: 10.1016/j.acra.2004.07.002. [DOI] [PubMed] [Google Scholar]
- 19.Kudo K, Christensen S, Sasaki M, Ostergaard L, Shirato H, Ogasawara K, et al. Accuracy and reliability assessment of CT and MR perfusion analysis software using a digital phantom. Radiology. 2013;267:201–211. doi: 10.1148/radiol.12112618. [DOI] [PMC free article] [PubMed] [Google Scholar]
- 20.Kudo K, Sasaki M, Yamada K, Momoshima S, Utsunomiya H, Shirato H, et al. Differences in CT perfusion maps generated by different commercial software: quantitative analysis by using identical source data of acute stroke patients. Radiology. 2010;254:200–209. doi: 10.1148/radiol.254082000. [DOI] [PubMed] [Google Scholar]
- 21.Gonzalez RG. Low signal, high noise and large uncertainty make CT perfusion unsuitable for acute ischemic stroke patient selection for endovascular therapy. Journal of neurointerventional surgery. 2012;4:242–245. doi: 10.1136/neurintsurg-2012-010404. [DOI] [PubMed] [Google Scholar]
- 22.Jones TH, Morawetz RB, Crowell RM, Marcoux FW, FitzGibbon SJ, DeGirolami U, et al. Thresholds of focal cerebral ischemia in awake monkeys. Journal of neurosurgery. 1981;54:773–782. doi: 10.3171/jns.1981.54.6.0773. [DOI] [PubMed] [Google Scholar]
- 23.Lev MH, Segal AZ, Farkas J, Hossain ST, Putman C, Hunter GJ, et al. Utility of perfusion-weighted CT imaging in acute middle cerebral artery stroke treated with intra-arterial thrombolysis: prediction of final infarct volume and clinical outcome. Stroke; a journal of cerebral circulation. 2001;32:2021–2028. doi: 10.1161/hs0901.095680. [DOI] [PubMed] [Google Scholar]
- 24.Nabavi DG, Cenic A, Henderson S, Gelb AW, Lee TY. Perfusion mapping using computed tomography allows accurate prediction of cerebral infarction in experimental brain ischemia. Stroke; a journal of cerebral circulation. 2001;32:175–183. doi: 10.1161/01.str.32.1.175. [DOI] [PubMed] [Google Scholar]
- 25.Schaefer PW, Roccatagliata L, Ledezma C, Hoh B, Schwamm LH, Koroshetz W, et al. First-pass quantitative CT perfusion identifies thresholds for salvageable penumbra in acute stroke patients treated with intra-arterial therapy. AJNR. American journal of neuroradiology. 2006;27:20–25. [PMC free article] [PubMed] [Google Scholar]
- 26.Kamalian S, Kamalian S, Konstas AA, Maas MB, Payabvash S, Pomerantz SR, et al. CT perfusion mean transit time maps optimally distinguish benign oligemia from true "at-risk" ischemic penumbra, but thresholds vary by postprocessing technique. AJNR. American journal of neuroradiology. 2012;33:545–549. doi: 10.3174/ajnr.A2809. [DOI] [PMC free article] [PubMed] [Google Scholar]
- 27.Bivard A, Spratt N, Levi C, Parsons M. Perfusion computer tomography: imaging and clinical validation in acute ischaemic stroke. Brain : a journal of neurology. 2011;134:3408–3416. doi: 10.1093/brain/awr257. [DOI] [PubMed] [Google Scholar]
- 28.Bland JM, Altman DG. Statistical methods for assessing agreement between two methods of clinical measurement. Lancet. 1986;1:307–310. [PubMed] [Google Scholar]
- 29.Yoo AJ, Verduzco LA, Schaefer PW, Hirsch JA, Rabinov JD, Gonzalez RG. MRI-based selection for intra-arterial stroke therapy: value of pretreatment diffusion-weighted imaging lesion volume in selecting patients with acute stroke who will benefit from early recanalization. Stroke; a journal of cerebral circulation. 2009;40:2046–2054. doi: 10.1161/STROKEAHA.108.541656. [DOI] [PMC free article] [PubMed] [Google Scholar]
- 30.Thierfelder KM, Sommer WH, Baumann AB, Klotz E, Meinel FG, Strobl FF, et al. Whole-brain CT perfusion: reliability and reproducibility of volumetric perfusion deficit assessment in patients with acute ischemic stroke. Neuroradiology. 2013;55:827–835. doi: 10.1007/s00234-013-1179-0. [DOI] [PubMed] [Google Scholar]
- 31.Saver JL. Time is brain--quantified. Stroke; a journal of cerebral circulation. 2006;37:263–266. doi: 10.1161/01.STR.0000196957.55928.ab. [DOI] [PubMed] [Google Scholar]


