

Abstract
Background
Dysphagia is considered an alarm symptom but detailed population-based data on dysphagia are lacking. We aimed to estimate in a representative US Caucasian population the prevalence of dysphagia and potential risk factors.
Methods
A modified version of the previously validated Bowel Disease Questionnaire was mailed to a population based cohort (n=7640) of Olmsted County, MN. Dysphagia was measured by one validated question “In the last year, how often have you had difficulty swallowing (a feeling that food sticks in your throat or chest)?” The medical records were reviewed for organic causes of dysphagia. The associations of reported frequency of dysphagia with potential risk factors were assessed using logistic regression models.
Results
The sex-specific, age-adjusted (US White 2000) prevalence for dysphagia experienced at least weekly was 3.0 % (95% CI: 2.2, 3.7) in females and 3.0 % (95% CI: 2.0, 4.0) in males. Those with frequent heartburn [OR=5.9 (4.0, 8.6)] and acid regurgitation [OR=10.6 (6.8, 16.6)] were significantly more likely to report frequent dysphagia. PPI use was significantly associated with frequent (3.1, 95% CI 2.2, 4.4) and infrequent dysphagia (1.5, 955 CI 1.3, 1.8). GERD was the most common diagnosis in those reporting dysphagia on the medical record; other organic explanations were rare and only found in the frequent dysphagia group.
Conclusions
Frequent dysphagia is not rare in the community (3%), occurs in both women and men across all adult age groups, and is most likely to indicate underlying GERD.
Keywords: Dysphagia, Prevalence, Epidemiology, Community studies
INTRODUCTION
Dysphagia is the sensation of food being hindered during the passage from the mouth through the esophagus into the stomach (1), and is considered a serious red flag or alarm symptom (2, 3). There are many causes of dysphagia classified into oropharyngeal or esophageal etiologies (4-6). Oropharyngeal dysphagia may arise from neurologic diseases including stroke, Parkinson’s disease, or amyotrophic lateral sclerosis, or a Zenker’s diverticula (4). Causes of esophageal dysphagia (5) include esophageal dysmotility (e.g. achalasia, diffuse esophageal spasm, nutcracker esophagus, or scleroderma), inflammation (e.g. eosinophilic esophagitis, radiation esophagitis), and structural abnormalities (e.g. malignancy, peptic strictures, esophageal rings, or external compression).
Little is known about the prevalence of dysphagia in the community or its risk factors. Most previous studies evaluating the epidemiology of dysphagia were performed in older individuals and failed to include all age groups (7-10). However, available data (7-11) suggest that dysphagia is surprisingly common, occurring in 8% to 22% of persons over age 50 years. Other studies (12, 13) in nursing homes estimate the prevalence of dysphagia may be as high as 60%. In a gastrointestinal symptom survey study of all ages in a Midwestern population, the prevalence of dysphagia was estimated to be 7% (14) but risk factors for dysphagia were not assessed. Thus, the purpose of this study was to estimate the population prevalence of dysphagia and to identify the characteristics associated with this important alarm symptom.
METHODS
This study is a population-based study of subjects sent a GI symptom survey in 2008 and 2009 that included dysphagia questions. This study was approved by the Institutional Review Boards of the Mayo Foundation and the Olmsted Medical Center.
Subjects
Subjects are residents of Olmsted County, Minnesota, contains approximately 120,000 residents. The population has been repeatedly studied, because it is one of few places in the United States where population-based studies can be conducted (15-17). By 2010 US census data, approximately 89% of the community are Caucasian. Because Olmsted County has been shown to be representative of U.S. Caucasians across a number of sociodemographic variables, and random population samples can be drawn, the results can be cautiously extrapolated to US Whites (15-20). The epidemiology of functional GI disorders and other non-GI diseases in this part of the United States has been investigated in a number of landmark epidemiological studies (14, 21-24).
Following approval by the Institutional Review Boards of the Mayo Clinic and Olmsted Medical Center, this study evaluated 3189 individuals from a previously assembled cohort. We used a previously assembled cohort (n=3189), which was identified in a series of random samples of Olmsted County residents stratified by age (5-year intervals between 20 and 94 years) and gender (equal numbers of men and women) using the Rochester Epidemiology Project system (22-24), and a new random sample (n=4451) (25, 26) of Olmsted County, MN, residents. Of the 7640 residents, 889 (12%) were 20-34, 3389 (44%) were 35-59, 1956 (26%) were 60-74, and 1406 (18%) were 75 years or older at the time of the survey.
Survey Methods
A validated study survey (Bowel Disease Questionnaire [BDQ]) (26) including a dysphagia question and an explanatory letter were mailed to a total of 7640 residents of Olmsted County in 2008 and 2009. One week before the actual survey, a letter introducing the gastrointestinal survey was mailed. After the survey, reminder letters were mailed at week 3 to 6 after the initial mailing to non-responders. Subjects who indicated at any point that they did not wish to complete the survey were not contacted further. Otherwise, non-responders were contacted by telephone at week 9 to request their participation and verify their residence within the County.
Study Questionnaire
The original BDQ (23) was designed to measure the gastrointestinal symptoms experienced over the previous year, collect past medical history data and assess non-gastrointestinal somatic symptoms. This study used the modified Talley BDQ, which has been shown to be a reliable and valid measurement of bowel symptoms (25). The current questionnaire comprised 27 gastrointestinal symptoms, the Somatic Symptom Checklist (SSC), and included a single dysphagia question.
The SSC consists of questions about relevant symptoms and illnesses (e.g. headaches, backaches, lethargy, insomnia), and subjects are instructed to indicate how often each occurred (0=not a problem to 4=occurs daily) and how bothersome each was (0=not a problem to 4=extremely bothersome when occurs) during the past year, using separate 5-point scales (27-29). Gastrointestinal items were excluded. The overall SSC score is calculated by averaging over the individual frequency of SSC item responses, separately the individual bothersome responses and then computing the mean of these two intermediate values. This score has been shown to be a reliable and valid measure of somatization (29, 30).
Definition of dysphagia
Dysphagia was measured by one question “In the last year, how often have you had difficulty swallowing (a feeling that food sticks in your throat or chest)?” The frequency was defined as follows.
No dysphagia;
Infrequent dysphagia: less than one day a week;
Frequent dysphagia: at least weekly.
We have shown this question is highly reliable (kappa 0.82, 95% CI 0.46-0.96) (25).
Data collection to determine the distribution of organic diseases
The presence of organic diseases was ascertained through medical record abstraction of all subjects with frequent dysphagia, 50 randomly selected subjects with infrequent dysphagia, and 50 randomly selected subjects without dysphagia. First, potential comorbidities linked to dysphagia within the timeframe of ± 2 years of the survey (in other words, two years before and two years after the date the questionnaire was returned) were abstracted using the ICD-9 codes and/or HICDA codes, which were diagnostic index and surgical procedure codes developed by the Rochester Epidemiology Project. The diagnostic or surgical procedure codes of the putative comorbid conditions were selected based on our a priori expectation that they could have an impact on dysphagia status in the population. Secondly, to confirm the presence of organic disease, one author (R.S.C.) conducted a thorough review of physicians’ comprehensive notes, medication history, past medical and surgical history, laboratory findings, as well as endoscopy and pathology reports, and was blinded to the dysphagia status. All information pertaining to diagnosis was then recorded in a specifically designed clinical data form.
Statistical Analyses
The associations of reported frequency of dysphagia with potential risk factors, including demographic (e.g. age, gender) and clinical characteristics (SSC score, physician visits, and GI conditions) were assessed using logistic regression models. These analyses were done with the “no dysphagia symptoms group” subgroup as the reference category (i.e. infrequent dysphagia, and separately, frequent dysphagia vs. no dysphagia). The sex-specific, age-adjusted and overall age-adjusted prevalence rates were directly adjusted to the US White 2000 population. All analyses were done with SAS version 9.3 (SAS Institute, Cary, NC). A significance level of 0.05 was used, and all tests were two-sided.
RESULTS
Prevalence of dysphagia
A total of 3669 of the 7640 subjects surveyed returned the questionnaire, corresponding to a response rate of 48%. Responders had a mean age of 61 years (±16), and 54 % were females. The odds for responding increased with increasing age and greater odds for response were observed in females. Table 1 summarizes the sociodemographic characteristics of the participants according to the frequency of dysphagia status. The mean age (±SD) in those reporting frequent dysphagia was 63 years (±16), and 57% were female, while the mean age (±SD) in those reporting infrequent dysphagia was 62 years (±15), and 53% were female. The mean age of the no dysphagia group was 61 years (±16), and 54 % were female.
Table 1.
Sociodemographic characteristics according to the frequency of dysphagia
| Frequent dysphagia (n=168) | Infrequent dysphagia (n=937) | Any dysphagia (n=1105) | No dysphagia (n=2490) | |
|---|---|---|---|---|
| Age (years, mean ± SD) | 63 ± 16 | 62 ± 15 | 62 ± 15 | 61 ± 16 |
| Female, n (%) | 96 (57.1%) | 496 (52.9%) | 592 (53.6%) | 1351 (54.3%) |
| SSC score (mean ± SD) | 1.5 ± 0.8 | 1.0 ± 0.7 | 1.1 ± 0.7 | 0.7 ± 0.5 |
| SSC Items (mean ± SD) | ||||
| Headaches | 1.2 ± 1.2 | 0.8 ± 0.9 | 0.8 ± 1.0 | 0.6 ± 0.8 |
| Backaches | 2.0 ± 1.3 | 1.4 ± 1.1 | 1.4 ± 1.2 | 0.9 ± 1.0 |
| Insomnia | 1.5 ± 1.3 | 1.2 ± 1.1 | 1.3 ± 1.2 | 0.9 ± 1.0 |
| General stiffness | 2.1 ± 1.3 | 1.6 ± 1.2 | 1.7 ± 1.2 | 1.1 ± 1.1 |
| Dizziness | 0.9 ± 1.1 | 0.5 ± 0.8 | 0.6 ± 0.9 | 0.2 ± 0.6 |
| Weakness | 1.1 ± 1.3 | 0.6 ± 0.7 | 0.7 ± 1.0 | 0.2 ± 0.7 |
| Visiting a physician in the last year > 5 times, n (%) | 38 (22.6%) | 118 (12.6%) | 156 (14.1%) | 219 (8.8%) |
| Medications, n (%) | ||||
| PPI* | 78 (46.4%) | 245 (26.2%) | 323 (29.2%) | 402 (16.1%) |
| Calcium channel blockers | 17 (10.1%) | 67 (7.2%) | 84 (7.6%) | 126 (5.1%) |
| Antidepressants | 39 (23.2%) | 161 (17.2%) | 200 (18.1%) | 322 (12.9%) |
| Antispasmodics | 6 (3.6%) | 28 (3.0%) | 34 (3.1%) | 21 (0.8%) |
| Narcotic pain medications | 29 (17.3%) | 136 (14.5%) | 165 (14.9%) | 254 (10.2%) |
PPI=Proton pump inhibitors;
SSC- somatic symptom checklist
The overall age-adjusted prevalence (US White 2000) of any dysphagia in the prior year was 19.5% (95% CI: 18.2, 20.8). Overall 16.7% reported infrequent dysphagia and 3% reported weekly dysphagia. The sex-specific age-adjusted (US White 2000) prevalence for dysphagia experienced at least weekly (frequent dysphagia) was 3.0 % (95% CI: 2.2, 3.7) in females and 3.0% (95% CI: 2.0, 4.0) in males (Figure 1). The prevalence of frequent dysphagia was not significantly associated with gender by age group.
Figure 1.
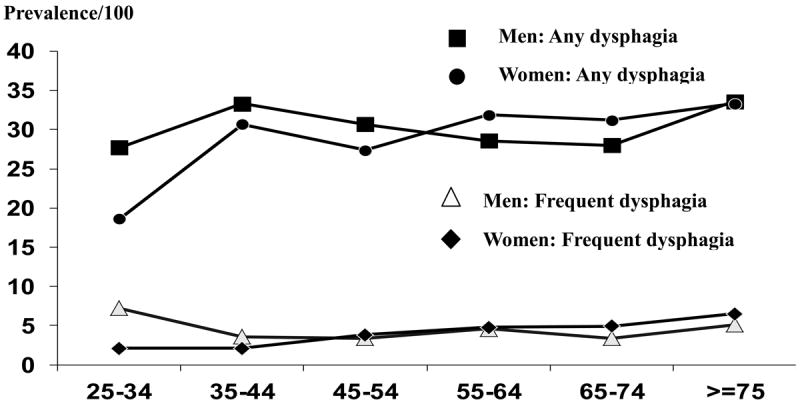
Age- and sex- specific prevalence rates (per 100) for any episodes of dysphagia and for at least weekly episodes.
Risk factors for dysphagia
Older age, high SSC score, and increased physician visits were more common in both the frequent and infrequent dysphagia group, compared to the no dysphagia group (Table 1). Notably, medications that were assessed (proton pump inhibitors [PPI], calcium channel blockers, antidepressants, antispasmodics, or narcotic pain medication) were more commonly taken by the frequent or infrequent dysphagia group, compared to the no dysphagia group.
The odds ratios corresponding to potential risk factors for any, frequent dysphagia, and infrequent dysphagia compared to the no dysphagia are shown in Table 2, after adjusting for age, gender, and SSC score.
Table 2.
Univariate predictors of any, infrequent dysphagia or frequent dysphagia compared to no dysphagia
| Frequent dysphagia vs. None* | Infrequent dysphagia vs. None* | Any dysphagia vs. None* | |
|---|---|---|---|
| Age per 10 years | 1.09 (0.98, 1.22) | 1.05 (0.99, 1.10) | 1.05 (1.0, 1.10) |
| Gender (Women vs Men) | 0.8 (0.6, 1.1) | 0.8 (0.7, 0.95) | 0.8 (0.7, 0.9) |
| SSC per unit | 5.9 (4.7, 7.4) | 2.6 (2.3, 3.0) | 3.0 (2.6, 3.4) |
| SSC items | |||
| Headaches + | 1.5 (1.4, 1.6) | 0.9 (0.8, 1.0) | 1.1 (0.9, 1.4) |
| Backaches + | 1.5 (1.4, 1.6) | 1.0 (0.9, 1.1) | 1.1 (0.9, 1.3) |
| Insomnia + | 1.4 (1.3, 1.5) | 1.0 (0.9, 1.0) | 0.8 (0.7, 0.9) |
| General stiffness + | 1.6 (1.5, 1.7) | 1.1 (1.0, 1.2) | 1.0 (0.8, 1.2) |
| Dizziness + | 1.8 (1.6, 1.9) | 1.1 (0.9, 1.2) | 1.2 (1.0, 1.4) |
| Weakness + | 1.8 (1.6, 1.9) | 1.1 (1.0, 1.2) | 1.0 (0.8, 1.2) |
| Visiting a physician in the last year > 5 times * | 1.5 (0.98, 2.3) | 1.1 (0.8, 1.4) | 1.1 (0.9, 1.4) |
| Medications | |||
| Proton pump inhibitors * | 3.1 (2.2, 4.4) | 1.5 (1.3, 1.8) | 1.7 (1.4, 2.0) |
| Calcium channel blockers * | 1.4 (0.8, 2.5) | 1.2 (0.9, 1.7) | 1.2 (0.9, 1.7) |
| Antidepressants * | 1.2 (0.8, 1.8) | 1.1 (0.9, 1.4) | 1.1 (0.9, 1.4) |
| Antispasmodics * | 2.2 (0.8, 6.1) | 2.7 (1.5, 4.8) | 2.6 (1.5, 4.7) |
| Narcotic pain medication * | 1.0 (0.6, 1.6) | 1.1 (0.9, 1.4) | 1.1 (0.9, 1.4) |
Odd ratios adjusted for age, gender and SSC score, (95% confidence intervals)
Odd ratios adjusted for age and gender, (95% confidence intervals)
SSC - somatic symptom checklist
PPI use was significantly associated with greater odds for frequent dysphagia compared to no dysphagia, after adjusting for age, gender, and SSC score. However, gender and other medication use were not associated with frequent dysphagia. In addition, higher SSC score, PPI use, and antispasmodics use were associated with a greater odds for reporting infrequent dysphagia or any dysphagia compared to no dysphagia.
Other gastrointestinal symptoms and dysphagia
Table 3 shows odds ratios in other gastrointestinal symptoms for any, frequent, or infrequent dysphagia after adjusting for age, gender, and SSC score, compared to no dysphagia. Frequent heartburn, acid regurgitation, and chest pain/discomfort were all significantly associated with frequent dysphagia, while infrequent bowel movements were not significantly associated with any dysphagia, infrequent dysphagia, or frequent dysphagia compared to no dysphagia. Notably, other gastrointestinal symptoms including nausea, vomiting, postprandial fullness, early satiety, and abdominal pain were associated with significantly greater odds for reporting frequent dysphagia compared to no dysphagia.
Table 3.
Association of other gastrointestinal symptoms with dysphagia among Olmsted County, Minnesota residents (OR*, 95% CI)
| Frequent dysphagia vs. None* | Infrequent dysphagia vs. None* | Any dysphagia vs. None* | |
|---|---|---|---|
| Abdominal pain+ | 1.9 (1.3, 2.8) | 1.7 (1.4, 2.0) | 1.7 (1.5, 2.0) |
| Frequent pain + | 3.2 (2.2, 4.8) | 1.5 (1.2, 1.9) | 1.7 (1.3, 2.1) |
| Frequent heartburn + | 5.9 (4.0, 8.6) | 1.5 (1.1, 1.9) | 1.9 (1.5, 2.5) |
| Acid regurgitation + | 10.6 (6.8,16.6) | 2.1 (1.5, 3.1) | 3.1 (2.2, 4.3) |
| Chest discomfort/pain + | 9.9 (6.4,15.2) | 1.4 (0.9, 2.0) | 2.3 (1.7, 3.2) |
| Unfinished regular sized meal + | 4.7 (2.9, 7.6) | 1.5 (1.1, 2.2) | 2.0 (1.4, 2.7) |
| Postprandial fullness + | 7.2 (4.8, 10.8) | 2.0 (1.5, 2.6) | 2.6 (2.0, 3.3) |
| Epigastric burning + | 6.2 (3.8, 10.1) | 1.4 (0.9, 2.0) | 2.0 (1.4, 2.8) |
| Nausea + | 3.9 (2.1, 7.1) | 1.1 (0.6, 1.8) | 1.5 (1.0, 2.4) |
| Vomiting + | 7.5 (2.4, 23.8) | 2.6 (0.9, 7.4) | 3.5 (1.3, 9.3) |
| Bloating + | 3.0 (2.0, 4.6) | 1.4 (1.1, 1.9) | 1.6 (1.2, 2.1) |
| Infrequent BM ++ | 1.3 (0.9, 1.9) | 1.1 (0.9, 1.3) | 1.1 (0.9, 1.3) |
| Fecal incontinence + | 2.0 (0.98, 4.2) | 1.5 (0.9, 2.4) | 1.6 (1.4, 2.5) |
| Constipation++ | 0.5 (0.3, 0.9) | 0.9 (0.7, 1.1) | 0.9 (0.7, 1.0) |
Odd ratios adjusted for age, gender and SSC score, (95% confidence interval);
at least weekly;
≥ sometimes
Associated organic diseases according to frequent dysphagia status
Table 4 summarizes the associated organic diseases that occurred around the time of survey according to the frequency of dysphagia status. Among 168 subjects with frequent dysphagia, 72 subjects (43%) had dysphagia associated organic diseases but 96 subjects (57%) did not have any recorded explanation. Gastroesophageal reflux disease (GERD) was identified significantly more commonly in the frequent dysphagia group compared to no dysphagia or infrequent dysphagia. This association of frequent dysphagia with GERD did not appear to be explained by an underlying stricture, Schatzki’s ring or co-existing eosinophilic esophagitis according to the detailed chart review (Table 4).
Table 4.
Distribution of organic diseases in all subjects with frequent dysphagia and randomly selected subjects with infrequent dysphagia or no dysphagia
| Organic diseases | Frequent dysphagia (N=168) | Infrequent dysphagia (N=50) | None (N=50) | p-value§ |
|---|---|---|---|---|
| Esophageal diseases | ||||
|
| ||||
| GERD | 53 (31.6%) | 9 (18.0%) | 7 (14.0%) | 0.02 |
|
| ||||
| Eosinophilic esophagitis | 3 (1.8%) | 0 (0%) | 0 (0%) | 1.00 |
|
| ||||
| Schatzki’s ring | 4 (2.4%) | 0 (0%) | 0 (0%) | 0.46 |
|
| ||||
| Achalasia | 1 (0.6%) | 0 (0%) | 0 (0%) | 1.00 |
|
| ||||
| Esophageal cancer or operation | 1 (0.6%) | 0 (0%) | 0 (0%) | 1.00 |
|
| ||||
| Stricture | 4 (2.4%) | 0 (0%) | 0 (0%) | 0.46 |
|
| ||||
| Neurologic diseases | ||||
|
| ||||
| Parkinson’s disease | 4 (2.4%) | 0 (0%) | 0 (0%) | 0.46 |
|
| ||||
| Multiple sclerosis | 1 (0.6%) | 0 (0%) | 0 (0%) | 1.00 |
|
| ||||
| Brain injury | 1 (0.6%) | 0 (0%) | 0 (0%) | 1.00 |
|
| ||||
| Stroke | 1 (0.6%) | 0 (0%) | 0 (0%) | 1.00 |
|
| ||||
| Myasthenia Gravis | 0 (0%) | 0 (0%) | 1 (2.0%) | 0.37 |
|
| ||||
| Chronic Inflammatory | 1 (0.6%) | 0 (0%) | 0 (0%) | 1.00 |
| Demyelinating | ||||
| Polyneuropathy (CIPD) | ||||
|
| ||||
| Connective tissue diseases | ||||
|
| ||||
| Sjogren’s disease | 3 (1.8%) | 1 (2.0%) | 0 0%) | 1.00 |
|
| ||||
| Systemic lupus (SLE) | 0 (0%) | 0 (0%) | 1 (2.0%) | 0.37 |
|
| ||||
| Polymyositis | 1 (0.6%) | 0 (0%) | 0 (0%) | 1.00 |
Fisher’s Exact test
DISCUSSION
In this study, the sex-specific age-adjusted (US White 2000) prevalence for dysphagia experienced at least weekly was 3.0 (95% CI: 2.2, 3.7) in females and 3.0 (95% CI: 2.0, 4.0) in males, which while less prevalent compared to other previous studies (7-10), but likely reflecting the true U.S. population rates at least in whites. Frequent dysphagia was significantly associated with PPI use and upper GI symptoms including heartburn, acid regurgitation, dyspepsia, epigastric burning, and vomiting. An association of uncomplicated GERD with frequent dysphagia was confirmed by chart review.
Although dysphagia is considered a key alarm symptom (2, 3), the epidemiology of dysphagia has been uncertain particularly in younger populations. Previous studies have suggested that the prevalence of dysphagia ranges somewhere between 5% and 22% (9, 31-34), although the majority of these studies only assessed dysphagia in older persons (over age 50 years). In a recent study of 672 Australian adults 18 years and older, Eslick et al. (34) observed that 16% had ever experienced dysphagia while 8% had dysphagia at least weekly; they also reported that dysphagia symptoms were not related to gender but were inversely related to aging with the peak prevalence occurring in 40 to 49 year olds. Our study found that 3% of the adult population experienced frequent dysphagia. Although difficulty swallowing may reflect different causes in younger and older subjects, we did not observe that either age or gender was associated with the reporting of frequent dysphagia (35).
We observed in the frequent dysphagia group that numerically GERD, eosinophilic esophagitis, strictures, Parkinson’s disease and Sjogren’s disease were increased but only GERD was significantly associated. A strength of the current population-based research was the ability to undertake a detailed chart review of all subjects with frequent dysphagia and a subset with infrequent and no dysphagia. In a study of the prevalence of dysphagia in subjects with GERD, Bollschweiler et al. (36) showed that dysphagia was significantly increased in the reflux group (28%) versus the normal group (3%), and this association may be explained by acid-induced inadequate peristalsis. Vakil et al. (37) studied the prevalence of dysphagia in 11,945 patients with erosive esophagitis and found 37% of these patients reported dysphagia. We observed that 30% of subjects with dysphagia had clinically diagnosed GERD. Others similarly have observed non-obstructive dysphagia in up to 46% of patients with GERD (38). We also found that a number of symptoms were positively associated with dysphagia including acid regurgitation, heartburn, postprandial fullness, and early satiety. Heartburn and acid regurgitation are classic symptoms of GERD (32) and recent data suggest that fundic disaccommodation may be linked not only to early satiety but also to gastroesophageal reflux (39). We further observed that PPI use is more commonly reported in subjects with dysphagia compared to the no dysphagia group consistent with the link to GERD. However, we did not find any association of other medications such as narcotics with frequent dysphagia status. The lack of association with medication use may reflect a type II error, and we were unable to obtain more detailed data (e.g., dose, chronicity, or frequency of medication use).
We were not able to ascertain more comprehensive characteristics of the dysphagia in this population-based study, such as the prevalence of food impaction. For example, eosinophilic esophagitis is an important albeit uncommon cause of intermittent dysphagia and food impaction in young adults (40-42), but in the present population sample, it was a very uncommon diagnosis. Further, frequent dysphagia, while considered an alarm symptom, was only linked to one case of cancer in this population sample. Others have shown dysphagia is a poor alarm symptom and our results are consistent with these observations (43). Very few community-based studies have assessed risk factors for dysphagia. We found a higher SSC score was independently associated with dysphagia symptoms (OR=5.9, 95% CI: 4.7-7.4). Several studies (34, 44, 45) have also shown a relationship between psychological disorders and dysphagia. Moreover, a number of studies (46-48) have similarly observed an association of somatization with GERD and functional gastrointestinal disorders. Eslick et al. (34) reported that the presence of progressive dysphagia was independently associated with depression, but we did not measure depression. Notably, Ekberg et al. (44) reported that dysphagia can have a severe impact on social and psychological aspects of quality of life.
The strengths of the current study include the investigation of a random community sample; we obtained a large representative sample of 3669 study participants. We have previously shown that responders in our Olmsted County population samples are very similar to non-responders based on a detailed chart review of all diagnoses (49). However, our data may not be generalized to the whole U.S. population because the racial composition of this community is predominantly white. The prevalence of dysphagia may vary by ethnic group, but at a minimum, our data are probably generalizable to the U.S. white population. There are also some other potential limitations of this study including that we were not able to distinguish oropharyngeal dysphagia from esophageal dysphagia and could not assess for the presence of a ‘globus sensation’ in this sample. The dysphagia question applied in our study has not been tested against measurements of esophageal transit but is reliable (30) and in this study appeared to have reasonable discriminant validity based on the diagnoses observed in those with frequent versus no dysphagia.
In conclusion, dysphagia is relatively common in the community and appears to be a poor alarm symptom even if frequent. Dysphagia is linked to GERD but a high somatization score is a risk factor for dysphagia.
Key Messages.
Conclusion of the Study: Dysphagia is common in the community equally affecting men and women. Gastroesophageal reflux disease is the most common underlying disease identified in these community subjects but many cases remain undiagnosed.
Aims & Goals: Estimate in a representative US White population the true population prevalence of dysphagia and potential risk factors.
Methodology: A validated questionnaire was mailed to a population based cohort (n=7640).
Results: The prevalence of dysphagia experienced at least weekly was 3.0 % (95% CI: 2.2, 3.7) in females and 3.0 % (95% CI: 2.0, 4.0) in males. PPI use, upper GI symptoms including frequent heartburn and acid regurgitation and higher somatization score were significantly associated with any, infrequent and frequent dysphagia. Based on medical record review, a diagnosis of GERD without stricture is by far the most common explanation identified for frequent dysphagia.
Acknowledgments
The authors wish to thank Lori R. Anderson for her assistance in the preparation of the manuscript.
Grant Support: This study was made possible in part using the resources of the Rochester Epidemiology Project, which is supported by the National Institute on Aging of the National Institutes of Health under Award Number R01- AG034676. The content is solely the responsibility of the authors and does not necessarily represent the official views of the National Institute of Health.
Footnotes
Specific Author Contributions: Rok Seon Choung, Alan R. Zinsmeister. Richard Locke III, and Nicholas J. Talley participated in the design, analysis, and writing of the manuscript. So Yang Cho and Yuri A. Saito involved in the analysis and writing of the manuscript. Alan R. Zinsmeister and Cathy D. Schleck provided the statistical analysis.
Disclosures: Dr. Talley and Mayo Clinic have licensed the Talley Bowel Disease Questionnaire.
References
- 1.Lind CD. Dysphagia: evaluation and treatment. Gastroenterol Clin North Am. 2003;32:553–575. doi: 10.1016/s0889-8553(03)00024-4. [DOI] [PubMed] [Google Scholar]
- 2.Kapoor N, Bassi A, Sturgess R, Bodger K. Predictive value of alarm features in a rapid access upper gastrointestinal cancer service. Gut. 2005;54:40–45. doi: 10.1136/gut.2004.039438. [DOI] [PMC free article] [PubMed] [Google Scholar]
- 3.Vakil N, Moayyedi P, Fennerty MB, Talley NJ. Limited value of alarm features in the diagnosis of upper gastrointestinal malignancy: systematic review and meta-analysis. Gastroenterology. 2006;131:390–401. doi: 10.1053/j.gastro.2006.04.029. quiz 659-360. [DOI] [PubMed] [Google Scholar]
- 4.Achem SR, Devault KR. Dysphagia in aging. Journal of clinical gastroenterology. 2005;39:357–371. doi: 10.1097/01.mcg.0000159272.88974.54. [DOI] [PubMed] [Google Scholar]
- 5.Lawal A, Shaker R. Esophageal dysphagia. Physical medicine and rehabilitation clinics of North America. 2008;19:729–745. viii. doi: 10.1016/j.pmr.2008.07.003. [DOI] [PubMed] [Google Scholar]
- 6.Humbert IA, Robbins J. Dysphagia in the elderly. Physical medicine and rehabilitation clinics of North America. 2008;19:853–866. ix–x. doi: 10.1016/j.pmr.2008.06.002. [DOI] [PMC free article] [PubMed] [Google Scholar]
- 7.Mann G, Hankey GJ, Cameron D. Swallowing function after stroke: prognosis and prognostic factors at 6 months. Stroke; a journal of cerebral circulation. 1999;30:744–748. doi: 10.1161/01.str.30.4.744. [DOI] [PubMed] [Google Scholar]
- 8.Finestone HM, Greene-Finestone LS. Rehabilitation medicine: 2. Diagnosis of dysphagia and its nutritional management for stroke patients. Cmaj. 2003;169:1041–1044. [PMC free article] [PubMed] [Google Scholar]
- 9.Lindgren S, Janzon L. Prevalence of swallowing complaints and clinical findings among 50-79-year-old men and women in an urban population. Dysphagia. 1991;6:187–192. doi: 10.1007/BF02493524. [DOI] [PubMed] [Google Scholar]
- 10.Tibbling L, Gustafsson B. Dysphagia and its consequences in the elderly. Dysphagia. 1991;6:200–202. doi: 10.1007/BF02493526. [DOI] [PubMed] [Google Scholar]
- 11.Cook IJ, Kahrilas PJ. AGA technical review on management of oropharyngeal dysphagia. Gastroenterology. 1999;116:455–478. doi: 10.1016/s0016-5085(99)70144-7. [DOI] [PubMed] [Google Scholar]
- 12.Shanley C, O’Loughlin G. Dysphagia among nursing home residents: an assessment and management protocol. Journal of gerontological nursing. 2000;26:35–48. doi: 10.3928/0098-9134-20000801-09. [DOI] [PubMed] [Google Scholar]
- 13.Park YH, Han HR, Oh BM, et al. Prevalence and associated factors of dysphagia in nursing home residents. Geriatr Nurs. 2013;34:212–217. doi: 10.1016/j.gerinurse.2013.02.014. [DOI] [PubMed] [Google Scholar]
- 14.Talley NJ, Weaver AL, Zinsmeister AR, Melton LJ., 3rd Onset and disappearance of gastrointestinal symptoms and functional gastrointestinal disorders. Am J Epidemiol. 1992;136:165–177. doi: 10.1093/oxfordjournals.aje.a116483. [DOI] [PubMed] [Google Scholar]
- 15.Kurland LT, Molgaard CA. The patient record in epidemiology. Scientific American. 1981;245:54–63. doi: 10.1038/scientificamerican1081-54. [DOI] [PubMed] [Google Scholar]
- 16.Melton LJ., 3rd History of the Rochester Epidemiology Project. Mayo Clin Proc. 1996;71:266–274. doi: 10.4065/71.3.266. [DOI] [PubMed] [Google Scholar]
- 17.Rocca WA, Yawn BP, St Sauver JL, Grossardt BR, Melton LJ., 3rd History of the Rochester Epidemiology Project: half a century of medical records linkage in a US population. Mayo Clin Proc. 2012;87:1202–1213. doi: 10.1016/j.mayocp.2012.08.012. [DOI] [PMC free article] [PubMed] [Google Scholar]
- 18.St Sauver JL, Grossardt BR, Leibson CL, Yawn BP, Melton LJ, 3rd, Rocca WA. Generalizability of epidemiological findings and public health decisions: an illustration from the Rochester Epidemiology Project. Mayo Clin Proc. 2012;87:151–160. doi: 10.1016/j.mayocp.2011.11.009. [DOI] [PMC free article] [PubMed] [Google Scholar]
- 19.St Sauver JL, Grossardt BR, Yawn BP, et al. Data resource profile: the Rochester Epidemiology Project (REP) medical records-linkage system. Int J Epidemiol. 2012;41:1614–1624. doi: 10.1093/ije/dys195. [DOI] [PMC free article] [PubMed] [Google Scholar]
- 20.St Sauver JL, Grossardt BR, Yawn BP, Melton LJ, 3rd, Rocca WA. Use of a medical records linkage system to enumerate a dynamic population over time: the Rochester epidemiology project. American journal of epidemiology. 2011;173:1059–1068. doi: 10.1093/aje/kwq482. [DOI] [PMC free article] [PubMed] [Google Scholar]
- 21.Talley NJ, Zinsmeister AR, Schleck CD, Melton LJ., 3rd Dyspepsia and dyspepsia subgroups: a population-based study. Gastroenterology. 1992;102:1259–1268. [PubMed] [Google Scholar]
- 22.Talley NJ, Zinsmeister AR, Van Dyke C, Melton LJ., 3rd Epidemiology of colonic symptoms and the irritable bowel syndrome. Gastroenterology. 1991;101:927–934. doi: 10.1016/0016-5085(91)90717-y. [DOI] [PubMed] [Google Scholar]
- 23.Talley NJ, Phillips SF, Melton J, 3rd, Wiltgen C, Zinsmeister AR. A patient questionnaire to identify bowel disease. Ann Intern Med. 1989;111:671–674. doi: 10.7326/0003-4819-111-8-671. [DOI] [PubMed] [Google Scholar]
- 24.Talley NJ, O’Keefe EA, Zinsmeister AR, Melton LJ., 3rd Prevalence of gastrointestinal symptoms in the elderly: a population-based study. Gastroenterology. 1992;102:895–901. doi: 10.1016/0016-5085(92)90175-x. [DOI] [PubMed] [Google Scholar]
- 25.Rey E, Locke GR, 3rd, Jung HK, et al. Measurement of abdominal symptoms by validated questionnaire: a 3-month recall timeframe as recommended by Rome III is not superior to a 1-year recall timeframe. Aliment Pharmacol Ther. 2010;31:1237–1247. doi: 10.1111/j.1365-2036.2010.04288.x. [DOI] [PubMed] [Google Scholar]
- 26.Choung RS, Locke GR, 3rd, Rey E, et al. Factors associated with persistent and nonpersistent chronic constipation, over 20 years. Clinical gastroenterology and hepatology : the official clinical practice journal of the American Gastroenterological Association. 2012;10:494–500. doi: 10.1016/j.cgh.2011.12.041. [DOI] [PMC free article] [PubMed] [Google Scholar]
- 27.Attanasio V, Andrasik F, Blanchard EB, Arena JG. Psychometric properties of the SUNYA revision of the Psychosomatic Symptom Checklist. J Behav Med. 1984;7:247–257. doi: 10.1007/BF00845390. [DOI] [PubMed] [Google Scholar]
- 28.Locke GR, 3rd, Zinsmeister AR, Talley NJ, Fett SL, Melton LJ. Risk factors for irritable bowel syndrome: role of analgesics and food sensitivities. Am J Gastroenterol. 2000;95:157–165. doi: 10.1111/j.1572-0241.2000.01678.x. [DOI] [PubMed] [Google Scholar]
- 29.Choung RS, Locke GR, 3rd, Zinsmeister AR, Schleck CD, Talley NJ. Psychosocial distress and somatic symptoms in community subjects with irritable bowel syndrome: a psychological component is the rule. Am J Gastroenterol. 2009;104:1772–1779. doi: 10.1038/ajg.2009.239. [DOI] [PMC free article] [PubMed] [Google Scholar]
- 30.Rey E, Locke GR, 3rd, Jung HK, et al. Measurement of abdominal symptoms by validated questionnaire: a 3-month recall timeframe as recommended by Rome III is not superior to a 1-year recall timeframe. Aliment Pharmacol Ther. 2010;31:1237–1247. doi: 10.1111/j.1365-2036.2010.04288.x. [DOI] [PubMed] [Google Scholar]
- 31.Drossman DA, Li Z, Andruzzi E, et al. U.S. householder survey of functional gastrointestinal disorders. Prevalence, sociodemography, and health impact. Dig Dis Sci. 1993;38:1569–1580. doi: 10.1007/BF01303162. [DOI] [PubMed] [Google Scholar]
- 32.Locke GR, 3rd, Talley NJ, Fett SL, Zinsmeister AR, Melton LJ., 3rd Prevalence and clinical spectrum of gastroesophageal reflux: a population-based study in Olmsted County, Minnesota. Gastroenterology. 1997;112:1448–1456. doi: 10.1016/s0016-5085(97)70025-8. [DOI] [PubMed] [Google Scholar]
- 33.Kjellen G, Tibbling L. Manometric oesophageal function, acid perfusion test and symptomatology in a 55-year-old general population. Clin Physiol. 1981;1:405–415. doi: 10.1111/j.1475-097x.1981.tb00908.x. [DOI] [PubMed] [Google Scholar]
- 34.Eslick GD, Talley NJ. Dysphagia: epidemiology, risk factors and impact on quality of life--a population-based study. Alimentary pharmacology & therapeutics. 2008;27:971–979. doi: 10.1111/j.1365-2036.2008.03664.x. [DOI] [PubMed] [Google Scholar]
- 35.Ludvigsson JF, Aro P, Walker MM, et al. Celiac disease, eosinophilic esophagitis and gastroesophageal reflux disease, an adult population-based study. Scand J Gastroenterol. 2013;48:808–814. doi: 10.3109/00365521.2013.792389. [DOI] [PMC free article] [PubMed] [Google Scholar]
- 36.Bollschweiler E, Knoppe K, Wolfgarten E, Holscher AH. Prevalence of dysphagia in patients with gastroesophageal reflux in Germany. Dysphagia. 2008;23:172–176. doi: 10.1007/s00455-007-9120-5. [DOI] [PubMed] [Google Scholar]
- 37.Vakil NB, Traxler B, Levine D. Dysphagia in patients with erosive esophagitis: prevalence, severity, and response to proton pump inhibitor treatment. Clinical gastroenterology and hepatology : the official clinical practice journal of the American Gastroenterological Association. 2004;2:665–668. doi: 10.1016/s1542-3565(04)00289-7. [DOI] [PubMed] [Google Scholar]
- 38.Singh S, Stein HJ, DeMeester TR, Hinder RA. Nonobstructive dysphagia in gastroesophageal reflux disease: a study with combined ambulatory pH and motility monitoring. The American journal of gastroenterology. 1992;87:562–567. [PubMed] [Google Scholar]
- 39.Pauwels A, Altan E, Tack J. The gastric accommodation response to meal intake determines the occurrence of transient lower esophageal sphincter relaxations and reflux events in patients with gastro-esophageal reflux disease. Neurogastroenterol Motil. 2014;26:581–588. doi: 10.1111/nmo.12305. [DOI] [PubMed] [Google Scholar]
- 40.Sgouros SN, Bergele C, Mantides A. Eosinophilic esophagitis in adults: a systematic review. European journal of gastroenterology & hepatology. 2006;18:211–217. doi: 10.1097/00042737-200602000-00015. [DOI] [PubMed] [Google Scholar]
- 41.Ronkainen J, Talley NJ, Aro P, et al. Prevalence of oesophageal eosinophils and eosinophilic oesophagitis in adults: the population-based Kalixanda study. Gut. 2007;56:615–620. doi: 10.1136/gut.2006.107714. [DOI] [PMC free article] [PubMed] [Google Scholar]
- 42.Basavaraju KP, Wong T. Eosinophilic oesophagitis: a common cause of dysphagia in young adults? International journal of clinical practice. 2008;62:1096–1107. doi: 10.1111/j.1742-1241.2008.01782.x. [DOI] [PubMed] [Google Scholar]
- 43.Ford AC, Veldhuyzen van Zanten SJ, Rodgers CC, Talley NJ, Vakil NB, Moayyedi P. Diagnostic utility of alarm features for colorectal cancer: systematic review and meta-analysis. Gut. 2008;57:1545–1553. doi: 10.1136/gut.2008.159723. [DOI] [PubMed] [Google Scholar]
- 44.Ekberg O, Hamdy S, Woisard V, Wuttge-Hannig A, Ortega P. Social and psychological burden of dysphagia: its impact on diagnosis and treatment. Dysphagia. 2002;17:139–146. doi: 10.1007/s00455-001-0113-5. [DOI] [PubMed] [Google Scholar]
- 45.Eslick GD, Jones MP, Talley NJ. Non-cardiac chest pain: prevalence, risk factors, impact and consulting--a population-based study. Alimentary pharmacology & therapeutics. 2003;17:1115–1124. doi: 10.1046/j.1365-2036.2003.01557.x. [DOI] [PubMed] [Google Scholar]
- 46.Rey E, Garcia-Alonso M, Moreno-Ortega M, Almansa C, Alvarez-Sanchez A, Diaz-Rubio M. Influence of psychological distress on characteristics of symptoms in patients with GERD: the role of IBS comorbidity. Digestive diseases and sciences. 2009;54:321–327. doi: 10.1007/s10620-008-0352-5. [DOI] [PubMed] [Google Scholar]
- 47.Baker LH, Lieberman D, Oehlke M. Psychological distress in patients with gastroesophageal reflux disease. The American journal of gastroenterology. 1995;90:1797–1803. [PubMed] [Google Scholar]
- 48.Naliboff BD, Mayer M, Fass R, et al. The effect of life stress on symptoms of heartburn. Psychosomatic medicine. 2004;66:426–434. doi: 10.1097/01.psy.0000124756.37520.84. [DOI] [PubMed] [Google Scholar]
- 49.Choung RS, Locke GR, Schleck CD, et al. A low response rate does not necessarily indicate non-response bias in gastroenterology survey research: a population-based study. J Public Health. 2013;21:87–95. [Google Scholar]