Abstract
Purpose
R2’, the reversible component of transverse relaxation, is an important susceptibility measurement for studies of brain physiology and pathologies. In existing literature, different R2’ measurement methods are used with assumption of equivalency. This study explores the choice of measurement method in healthy, young subjects at 3T.
Methods
In this study, a modified gradient-echo sampling of free induction decay and echo (GESFIDE) sequence was used to compare four standard R2’ measurement methods: asymmetric spin echo (ASE), standard GESFIDE, gradient echo sampling of the spin echo (GESSE), and separate R2 and R2* mapping.
Results
GESSE returned lower R2’ measurements than other methods (p<0.05). Inter-subject mean R2’ in gray matter was found to be 2.7 s−1 using standard GESFIDE and GESSE, versus 3.4–3.8 s−1 using other methods. In white matter, mean R2’ from GESSE was 2.3 s−1 while other methods produced 3.7–4.3 s−1. R2 correction was applied to partially reduce the discrepancies between the methods, but significant differences remained, likely due to violation of the fundamental assumption of a single-compartmental tissue model, and hence mono-exponential decay.
Conclusion
R2’ measurements are influenced significantly by the choice of method. Awareness of this issue is important when designing and interpreting studies that involve R2’ measurements.
Keywords: R2’, susceptibility, transverse relaxation, GESFIDE, GESSE
Introduction
Measurement of magnetic susceptibility changes in the brain is an invaluable tool in the study of normal brain physiology as well as pathological conditions including stroke, Alzheimer’s disease and tumors (1–3). Susceptibility contrast underlies a wide range of imaging techniques for mapping oxygenation and iron deposition (4–7).
Susceptibility effects alter the parameter R2*, which is the rate of free induction decay (FID), commonly modeled using a mono-exponential curve due to the assumption of a single tissue compartment. R2* has two components: a) an irreversible component characterized by decay rate R2, and b) a reversible component denoted R2’, which reflects susceptibility-induced intra-voxel dephasing. In a mono-exponential model,
| [1] |
While tissue susceptibility can be measured using R2* instead of R2’, the latter is independent of pathology-induced R2 changes that may significantly affect the former (8).
In normal, young subjects, R2’ in white and cortical gray matter has been modeled in the quantitative blood oxygen level-dependent (qBOLD) framework (4,9) as the effect of venous oxygenation, and is expressed as a function of deoxygenated blood volume (DBV), gyromagnetic ratio γ, susceptibility difference between oxygenated and deoxygenated blood (Δχ0), microvascular hematocrit (Hct), and blood oxygen saturation (SO2):
| [2] |
In published literature to date, R2’ has been measured using several standard methods (10–13) with the assumption of equivalency. For normal, young subjects at 3T, published values vary over a wide range even in comparable regions of interest. For example, in frontal white matter, published mean R2’ spanned a 6-fold range from 1.5 to 9.9 s−1 (10–13). Using Eq. 2, with typical parameter values (14) (such as DBV approximated using venous cerebral blood volume of 2–4%, and SO2 of 60–70), R2’ would be expected to range between 1.8 and 4.8 s−1. The discrepancy in published values is therefore much greater than can be expected from physiological variation. Limited investigation of the discrepancy has been performed for two of the methods (15), though at 1.5 T, and with low in-plane and through-slice spatial resolution.
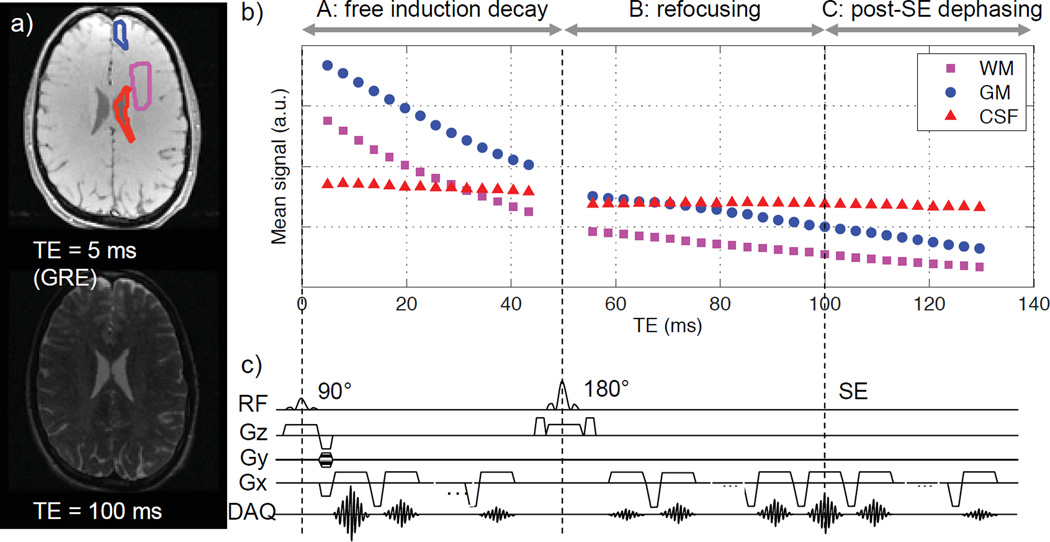
In this study, we hypothesize that R2’ measurements at 3T are dependent on the method, due to different ways in which violation of the mono-exponential decay model affect the measurement method. To test this hypothesis, we used a modified GESFIDE sequence to acquire multi-echo data that can support four standard R2’ measurement methods: a) asymmetric spin echo (ASE) (16), which combines spin echoes at multiple echo times; b) gradient-echo sampling of free induction decay and echo (GESFIDE, henceforth referred to as “standard GESFIDE” to avoid confusion with the modified GESFIDE imaging sequence used in this study) (17), which combines gradient echoes during the free induction decay (FID) and rephasing portions of a spin echo evolution; c) gradient echo sampling of the spin echo (GESSE) (18), which combines rephasing and dephasing gradient echoes before and after a spin echo; and d) combining separate R2 and R2* measurements (henceforth referred to as “combined approach” for brevity). The imaging sequence is based on the original GESFIDE sequence (17), sampling the free induction decay (FID), refocusing, and subsequent dephasing echoes of a spin echo (SE) signal evolution (Fig. 1).
Figure 1.
Modified GESFIDE sequence used in this study: a) representative gradient echo and spin echo images; b) representative signal evolution of ROIs in WM, GM and CSF; c) sequence diagram. The original GESFIDE sequence only samples parts A and B of signal evolution, while this modified version continues readout to sample echoes after the SE (part C), thus acquiring the necessary data points for the GESSE technique.
Methods
Study Population
With institutional review board (IRB) approval and Health Insurance Portability and Accountability Act (HIPAA) compliance, 10 normal subjects (7 men/3 women, age range 24–35 years, mean 29 years) were scanned after giving written informed consent.
MR Imaging
All imaging was performed at 3T (MR750, GE Healthcare, Waukesha, WI) using an 8-channel high-resolution head coil. First, we performed a second-order shim over the brain. Then, we acquired a modified GESFIDE sequence for R2’ measurements, as shown in Fig. 1. This sequence was run 5 times with different spin echo times (TESE’s) of 100, 82, 64, 46 and 28 ms. While we later examined the dependence of R2’ on TESE, the primary analyses for standard GESFIDE, GESSE and the combined approach were performed using TESE = 100 ms. This value was selected to accommodate a range of published R2 of the healthy brain (10,13,19,20) and to acquire enough FID echoes to robustly map R2* (13,21). All other parameters remained the same to give 40 echoes in total with variable numbers of echoes before and after the 180° refocusing pulse (Table 1), echo times (TEs) 5–130 ms, echo spacing (ΔTE) 3 ms, repetition time (TR) 2 s, voxel size 1.6 × 1.6 × 1.5 mm3, 12 interleaved slices at 1 mm spacing, and scan time 4 min 56 s per sequence. The slices were prescribed axially to cover a 29-mm-thick slab where the two most inferior slices included cerebrospinal fluid (CSF) from the lateral ventricles. This imaging volume does not cover deep gray matter. The thin slices reduced sensitivity to B0 inhomogeneity, which can significantly affect R2’ due to susceptibility-induced intra-voxel dephasing (8,22). In comparable studies (10–13), thicker slices (2–4 mm) were used. Our choice entailed a tradeoff in favor of reducing B0 inhomogeneity effects by reducing coverage and increasing scan time.
Table 1.
Number of echoes for each repetition of the modified GESFIDE sequence. The echo spacing and total number of echoes are fixed, and the echo times of the first and last echoes are also maintained to be constant.
| TESE (ms) | Number of Echoes | ||
|---|---|---|---|
| FID (Part A) | Refocusing (Part B) | Post-SE Dephasing (Part C) | |
| 100 | 14 | 16 | 10 |
| 82 | 11 | 13 | 16 |
| 46 | 8 | 10 | 22 |
| 64 | 5 | 7 | 28 |
| 28 | 2 | 4 | 34 |
For multi-echo R2 mapping, we used the sequence CubeQuant (23) (GE Applied Sciences Lab West, Menlo Park, CA), a T2-prepared, multi-echo 3D fast spin echo sequence with optimized refocusing pulses. Due to implementation constraints, we could not exactly match imaging plane, resolution and echo times. Instead, we performed whole-brain acquisition of 11 echoes in two separate sequences, with TE 6–128 ms, TR 2646 ms, and voxel size 0.5 × 0.5 × 2 mm3, similar to the optimized parameter range of the modified GESFIDE sequence. Total scan time was approximately 10 minutes for whole-head coverage with sagittal slices. For registration and segmentation, high-resolution, whole-brain T1-weighted anatomical images were acquired using a 3D FSPGR BRAVO sequence, with inversion time 400 ms, TE 3.7 ms, TR 9.2 ms, and voxel size 0.9 × 0.7 × 1.2 mm3.
Data Analysis
All GESFIDE, CUBE Quant, and BRAVO images were co-registered to the first echo of the TESE = 100 ms GESFIDE image using SPM8 (Wellcome Trust Center for Neuroimaging, London, United Kingdom). Then, using the Brain Extraction Tool (24) and the FMRIB's Automated Segmentation Tool (25) in FSL 5.0.1 (FMRIB Center, Oxford, United Kingdom), the BRAVO image was segmented to produce white matter (WM), gray matter (GM), and CSF regions of interest.
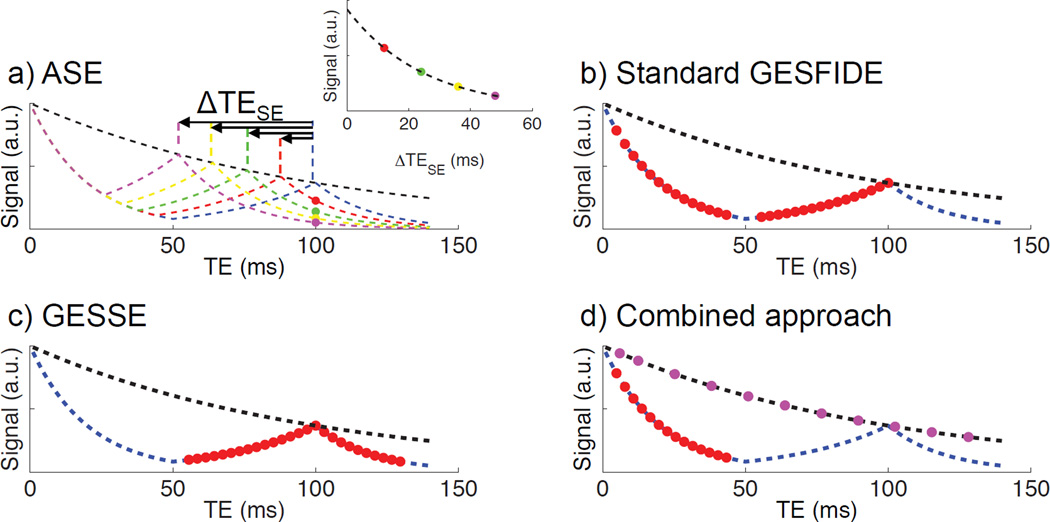
All four standard R2’ mapping methods assume a mono-exponential decay model (Fig. 2) that involves fitting exponential decays of the form y=A*exp(−bt) with the Levenberg-Marquardt Analysis algorithm (LMA) using the MR signal S(t). All computation was performed in Matlab R2010b (MathWorks, Natick, MA). In ASE, R2’ was calculated by fitting the echo acquired at TE 100 ms with TESE 28, 46, 64 and 82 ms, versus corresponding echo time shifts ΔTESE 18 to 72 ms, chosen to ensure that ΔTESE is sufficiently long to satisfy the exponential decay relationship (16).
| [3] |
Figure 2.
Echoes selected for calculating R2’ using each standard approach, with idealized mono-exponential T2 and SE decay curves in dashed lines. a) ASE uses a single echo from four modified GESFIDE sequences; b) the standard GESFIDE approach uses the FID and refocusing echoes from a modified GESFIDE sequence; c) the GESSE approach uses the refocusing and post-SE dephasing echoes from a modified GESFIDE sequence; d) the combined approach uses the FID echoes from a modified GESFIDE sequence and the echoes from a CubeQuant sequence.
In standard GESFIDE, R2’ is calculated using the FID (denoted as part A of signal evolution, with decay rate R2*A) and refocusing echoes (part B of signal evolution, with decay rate R2*B).
| [4] |
| [5] |
In GESSE, R2’ is calculated using the refocusing (including SE) and post-SE dephasing echoes (part C of signal evolution, with decay rate R2*C).
| [6] |
| [7] |
In the combined approach, R2* is calculated using all FID (part A) echoes from modified GESFIDE, and R2 is calculated using all 11 CubeQuant echoes.
| [8] |
| [9] |
Multi-exponential R2 Correction
While the mono-exponential decay model used to derive Eqs. 4 to 9 is mathematically convenient, an imaging voxel typically contains multiple compartments with different R2 values, resulting in multi-exponential of the MR signal and therefore inaccurate estimates of R2* and R2’. For standard GESFIDE and GESSE, we inspected the resulting R2’ measurements without and with R2 correction as defined in (15). In this correction, R2 measurements R2A, R2B and R2C were calculated over shorter fitting intervals, and the discrepancies between intervals removed from the estimates of R2’. For this purpose, the 11 acquired echoes from CubeQuant were divided into three sets for calculating R2A (TE 6–38 ms), R2B (TE 51–90 ms) and R2C (TE 102–128 ms), so that they matched the modified GESFIDE echoes for calculated R2*A (TE 5–43 ms), R2*B (TE 56–100 ms) and R2*C (TE 103–130 ms). For the combined approach, we compared the R2’ measurements without and with matching echo times for R2* and R2 measurements. The latter was achieved by calculating R2 using only the first 4 echoes (TE 6–38 ms) from the CubeQuant data, such that the echo time range matched that of GESFIDE echoes used to calculate R2*.
Diffusion Weighting Correction
Due to its large number of readouts at short echo spacing, the modified GESFIDE sequence introduces diffusion weighting that may alter the measured relaxation rates. To assess this effect, b-factor weighting at all echoes was calculated using the Steskjal-Tanner equation (26), and combined with an apparent diffusion coefficient (ADC) value upper threshold of 2100 × 10−6 mm2/s, the maximum ADC constraint used in clinical perfusion analysis software (27) to conservatively estimate the maximum effect of diffusion-weighting on each part of the signal evolution. Diffusion weighting from phase encoding and crusher gradients are not included in this correction, as they affect all spin echo-based imaging sequences.
Statistical Analysis
The Wilcoxon ranked sum test was used to determine whether the R2’ values obtained with the different techniques were significantly different in GM and WM. A significance level of 0.05 was used with the conservative Bonferroni correction for 6 pair-wise comparisons of the 4 methods (i.e. p<0.05/6=0.008).
Results
Mean R2’ Values using Different Methods
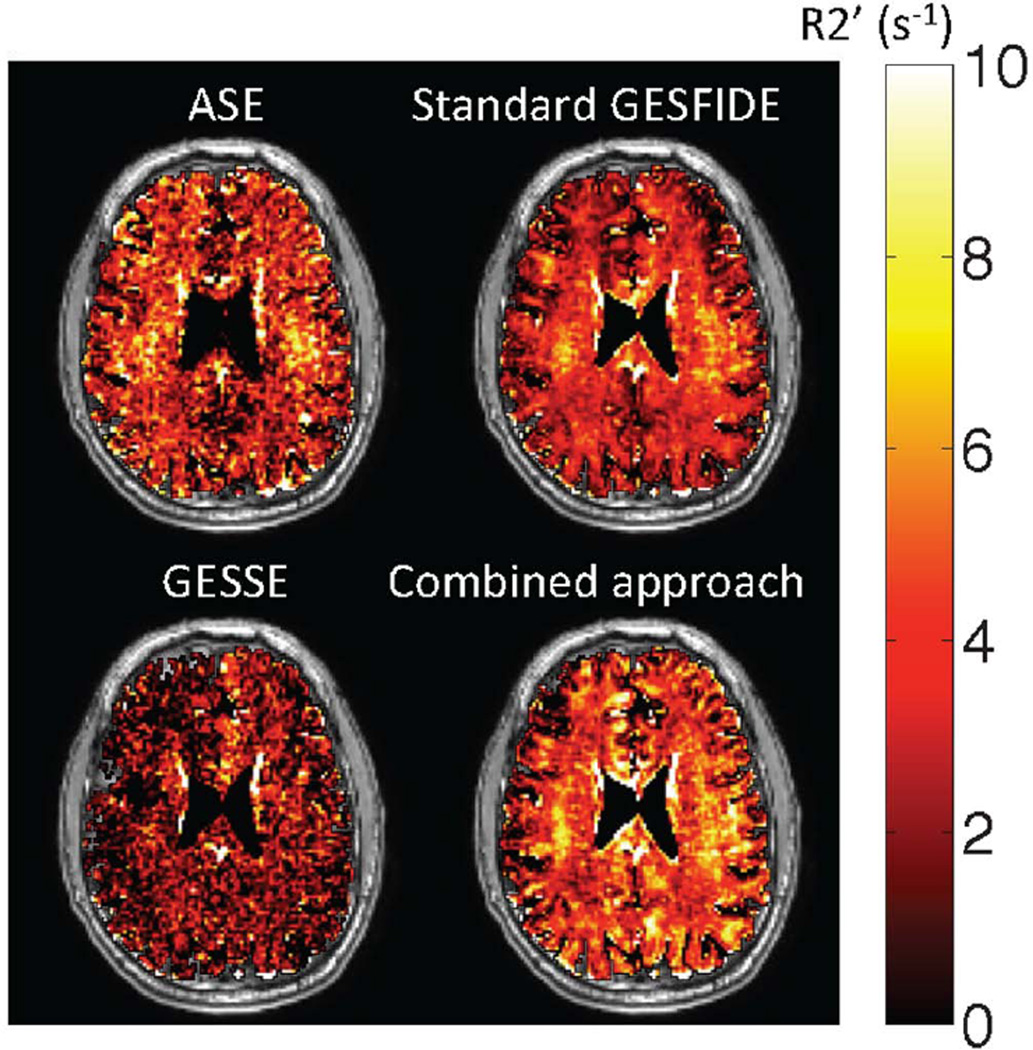
As shown in Table 2, measurements of R2’ without R2 correction fall within the range of expected R2’ values (1.8 to 4.8 s−1). Differences in mean R2’ were observed between the four methods (Fig. 3 and Table 2). GESSE produced lower mean R2’ in both the GM and WM, but the ordering of the R2’ values obtained by the other 3 methods was different in WM and GM. In GM, the mean R2’ spanned a range of 1.1 s−1 across subjects, while in WM, the range was 2 s−1. For comparison, the R2’ values obtained by the different measurement approaches ranged between 2 and 4.5 s−1, demonstrating that the choice of the measurement significantly impacts the R2’ obtained.
Table 2.
Mean R2’, spatial SD and inter-subject SD measured in GM and WM for standard R2’ measurement techniques without multi-exponential R2 correction, with * indicating statistical significance (p<0.008) of comparison between mean R2’ values using the Wilcoxon ranked sum test.
| GM R2’ (s−1) | WM R2’ (s−1) | |||||||
|---|---|---|---|---|---|---|---|---|
| Mean | Spatial SD |
Inter- subject SD |
Statistical Significance |
Mean | Spatial SD |
Inter- subject SD |
Statistical Significance |
|
| ASE | 3.8 | 3.0 | 0.6 | 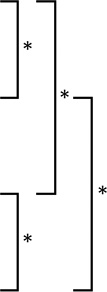 |
3.8 | 2.3 | 0.5 | 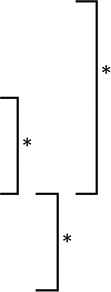 |
| Standard GESFIDE | 2.7 | 2.4 | 0.4 | 3.7 | 1.6 | 0.4 | ||
| GESSE | 2.7 | 2.5 | 0.3 | 2.3 | 1.8 | 0.2 | ||
| Combined Approach | 3.4 | 2.7 | 0.4 | 4.3 | 2.1 | 0.5 | ||
Figure 3.
Representative R2’ maps (superimposed on T1-weighted anatomic images) obtained using standard measurement methods. Visual inspection shows that R2’ values measured by GESSE are lower than those from other techniques. This is supported by quantitative results (Table 2). All methods produced a few voxels in the sulci with small negative R2’ values. These voxels were included in subsequent analysis.
The apparent underestimation of R2’ using GESSE relative to other approaches was statistically significant (p<0.008) in WM (Table 2). There is also a significant (p<0.008) difference in mean GM R2’ between GESSE and ASE, and between GESSE and the combined approach. As observed from Table 2, relative performance of the four methods varied in GM and WM. These variations reflected a number of competing factors, some of which could be partially corrected using various techniques. These factors and corrective techniques will be explored later in this section.
Inter-subject Variability
The 10 subjects showed a relatively narrow range of mean R2’ values, as shown by the inter-subject standard deviation (SD) in Table 2. Given the small age range of the healthy volunteers, we assume that they are sampled from the same population with a particular distribution of R2’ values. The coefficient of variation, defined by the inter-subject SD in R2’ normalized by the mean R2’, is within a narrow range of 0.10–0.15 for all four standard methods, indicating that all methods produce similar dispersions of the true distribution of R2’ values within the sampled population.
Diffusion Weighting Correction
For our implementation of the modified GESFIDE sequence and the parameters used in this study, the readout gradient b-factor weighting at the last echo was found to be 0.088 s/mm2. Using a maximum ADC of 2100 × 10−6 mm2/s, the diffusion weighting from the readout gradients would have added to decay rates R2*A, R2*B and R2*C at most 0.0003 s−1, 0.0022 s−1 and 0.0022 s−1 respectively—equivalent to up to 0.002%, 0.020% and 0.015% of each subject’s mean R2’ measurement in GM or WM. Based on this, we conclude that diffusion effects from readout gradients are negligible.
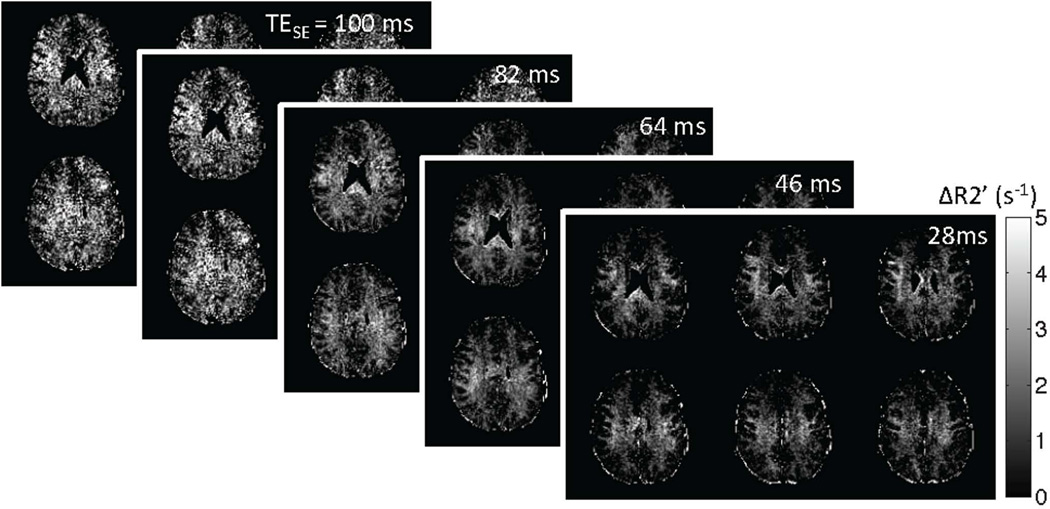
Dependence on TESE
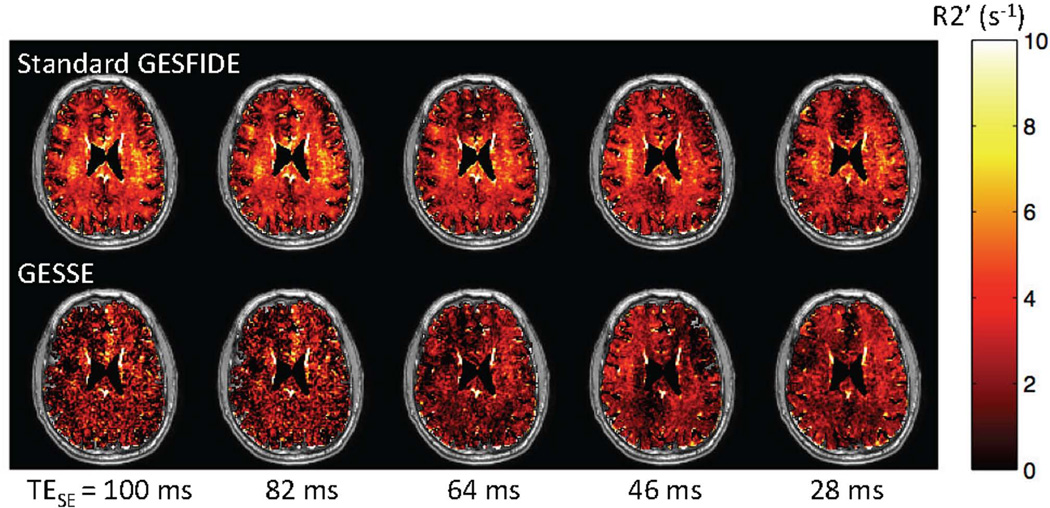
When the modified GESFIDE data sets acquired at shorter TESE’s (28, 46, 64 and 82 ms) are used to calculate standard GESFIDE and GESSE R2’ maps, the effect of multi-exponential R2 decay becomes apparent, especially in WM. We observe little change in standard GESFIDE R2’ with decreasing TESE, while GESSE R2’ increases (Fig. 4). As TESE is reduced, the changing weighting of signal decay from the myelin water compartment is also highlighted in the difference R2’GESFIDE – R2’GESSE (Fig. 5). Lastly, there is also an increase in SNR of GESSE measurements as the post-SE signal amplitude increases.
Figure 4.
Representative R2’ maps obtained using standard GESFIDE and GESSE at different TESE’s. The small increase in GESSE R2’ maps indicates multi-exponential R2 decay. An increase in post-SE signal amplitude also improves the SNR for GESSE.
Figure 5.
Representative difference maps between standard GESFIDE and GESSE (R2’GESFIDE – R2’GESSE) in 6 slices at different TESE’s. The emergence of WM/GM contrast is likely related to the difference in myelin content in these two tissues.
Multi-exponential R2 Correction
Correction for multi-exponential R2 correction has slightly improved the agreement between techniques. The corrected R2’ values are shown in Table 3, demonstrating no statistically significant change in mean R2’ for standard GESFIDE, but a significant increase in mean R2’ for GESSE. R2 correction has reduced the difference in mean R2’ between standard GESFIDE and GESSE in both GM and WM, and the remaining difference between the methods is no longer statistically significant. This suggests that multi-exponential R2 decay plays a role in the underestimation of R2’ using GESSE. For the combined approach, echo time matching slightly reduced mean R2’ in both GM and WM, but the changes were not statistically significant (p>0.01).
Table 3.
Mean R2’, spatial SD and sample SD measured in GM and WM for the combined approach, standard GESFIDE and GESSE, with and without multi-exponential R2 correction.
| GM R2’ (s−1) | WM R2’ (s−1) | |||||||
|---|---|---|---|---|---|---|---|---|
| Mean | Spatial SD |
Sample SD |
Statistical Significance |
Mean | Spatial SD |
Sample SD |
Statistical Significance |
|
| Combined approach | 3.4 | 2.7 | 0.4 | 4.3 | 2.1 | 0.5 | ||
| Combined approach with TE matching | 3.3 | 2.6 | 0.4 | 4.0 | 2.1 | 0.5 | ||
| GESFIDE | 2.7 | 2.4 | 0.4 | 3.7 | 1.6 | 0.4 | ||
| GESFIDE with R2 correction | 3.0 | 2.6 | 0.6 | 3.5 | 1.8 | 0.6 | ||
| GESSE | 2.7 | 2.5 | 0.3 |
|
2.3 | 1.8 | 0.2 |
|
| GESSE with R2 correction | 3.5 | 3.0 | 0.7 | 2.8 | 2.1 | 0.3 | ||
indicates statistical significance (p<0.008) using the Wilcoxon ranked sum test.
Discussion
Experimental R2’ measurements deviate from actual values when the assumption of single-compartmental tissue model and hence mono-exponential decay is violated. The extent of violation is affected by various competing factors to different degrees in GM and WM, with additional dependency on imaging parameters. This complicates the comparison between methods.
Lower measurement of R2’ produced by GESSE is expected. Diffusion in brain tissues alters the shape of the GESFIDE signal evolution time course by flattening the curve around the SE (28,29). In particular, this effect reduces R2*C (decay rate of post-SE dephasing section of signal) relative to R2*A (decay rate of FID section of signal). Consequently, as shown in Eqs. 5 and 7, R2’ calculated from GESSE is expected to be somewhat lower than GESFIDE and the combined approach, both of which utilize early gradient echoes that have not been affected by diffusion.
The presence of myelin in WM also affects R2’ measurements and introduces dependency on spin echo time TESE. Due to a mixture of myelin water, intra-cellular, and extra-cellular water compartments, the signal from each voxel experiences multi-exponential R2 decay. T2 of myelin water is short, measured at approximately 15 ms (30), which is significantly shorter than the TESE of 100 ms used in our study for standard GESFIDE, GESSE, and the combined approach. This violation of the mono-exponential assumption due to a short-T2 component reduces R2’ in GESSE relative to GESFIDE and the combined approach, and is expected to be more significant in WM than in GM due to the higher myelin water fraction (10–15% vs. 1–4%, respectively) (30–33). In addition, previous work have shown that water compartmentalization in myelin results in non-negligible frequency shift, and hence increase in R2* decay experienced by gradient echoes (34,35). Again, due to the short T2 of myelin water, this leads to discrepancy in R2’ measurements from GESFIDE and GESSE, and is more significant in WM than GM. These myelin-related effects are consistent with our observations (Table 2), including the change in GM/WM contrast with TESE (Fig. 4, Fig. 5).
Signal from the intravascular blood compartment within tissues also contributes to signal decay to different degrees depending on the volume fraction, oxygenation level, and geometry of blood within the imaging voxel (36). Due to the higher blood volume and presence of large vessels in GM, the accuracy of tissue R2’ measurements in GM is likely to be lower than that in WM.
Although voxel size chosen for this study is small, the accuracy of R2’ measurement is still affected by intravoxel dephasing due to magnetic field inhomogeneity arising from susceptibility discontinuities at tissue interfaces, inadequate shim, and iron deposition in tissue. While additional correction methods (22,37,38) are beyond the scope of this study, they are valuable for improving quantitative relaxation mapping results.
In addition, cortical GM such as that used in our data set is prone to more factors that affected the spatial uniformity of the R2’ maps. These include CSF contamination, greater susceptibility discontinuities, poorer shim, partial volume effect, and segmentation errors. These factors, in addition to the fewer number of voxels in GM and higher associated statistical error, significantly increased the spatial standard deviation (SD) in GM in comparison to WM, as shown in Table 2.
Overall, due to the non-BOLD contributions to R2’ measurements discussed above, it is important to note that values obtained via these standard methods are not reliable for evaluating oxygenation parameters such as the OEF. This inaccuracy can be observed from the relative magnitudes of R2’ in GM and WM. As shown in previous work on the qBOLD model (4), the difference between R2’ in GM and WM should be dominated by the difference in DBV between the two tissues. In fact, when the contributions from tissue, blood, and extracellular water compartments, and susceptibility sources were separately modeled in the GESSE-based qBOLD approach (4), the ratio between R2’ measured at 3T in GM and WM was approximately 3–4 (Table 4). In our results (Table 2), this ratio ranged from 0.7 to 1.2, similar to ratios of comparable published values (Table 4). Therefore, this suggests that R2’ values measured using standard approaches are significantly contaminated by non-BOLD contributions. Consequently, researchers must be cautious in attributing measured R2’ differences or changes to changes in oxygenation or perfusion. Further assessment of these R2’ mapping methods in oxygenation studies can be performed by perturbing R2’ with oxygenation challenges, and comparing measured changes against measurements from other modalities such as near infrared spectroscopy (39,40) or positron emission tomography (41,42).
Table 4.
Published R2’ values from comparable studies (young normal subjects scanned at 3T) and a study using the qBOLD approach with a multi-compartmental model (4). Note that R2’ values from (11) are approximate because the values were presented in graphical form only.
| Reference | Method | Sample Size |
Subject Age |
GM R2’ (s− 1) |
WM R2’ (s−1) | Comparison to Our Results |
|---|---|---|---|---|---|---|
| (10) | Standard GESFIDE | 6 | 19–42 | 3.4±1.1 (prefrontal cortex) | 3.9±1.1 (frontal) | Similar |
| (11) | GESSE | 6 | Mean 25 | - | 1.5, inter-quartile range 0.9–1.7 (frontal) | Lower |
| (12) | Combined approach | 21 | Mean 36 | 9.2±1.1 (cortical) | 9.3±1.1 (frontal) | Higher |
| (13) | Combined approach | 66 total | 18–84, linear regression analysis with age | 7.4, 95% CI 6.6–8.1, (frontal cortex, 30 years old) | 9.9, 95% CI 8.8–11.0, (frontal, 30 years old) | Higher |
| (4) | Multi-compartmental qBOLD | 9 | Unknown | 2.9±0.4 | 0.68±0.10 | Similar in GM Lower in WM |
Aside from quality of measurement, standard R2’ mapping methods also vary in feasibility for clinical use. In this study, thin slices were acquired to reduce B0 inhomogeneity effects, at the expense of coverage and scan time. This tradeoff applies to all clinical imaging sequences. Investigators interested in examining specific structures, such as deep gray matter, may not need to image the whole brain, so their consideration of the tradeoff may lead to choice of a different sequence from investigators who need whole-brain coverage. Our ASE data was acquired in 4 repetitions of the modified GESFIDE sequence, with a total scan time of around 20 min. Because only one echo is needed for R2’ measurement, other imaging sequences (such single spin echo echo-planar imaging sequences) may be used in practice, but multiple repetitions at long spin echo TE are still necessary, and additional scan time is needed for whole-brain coverage. Due to the long imaging time, subject motion and B0 drift may contribute to error across repetitions. Custom implementations of the imaging sequence may also be needed if a suitable product sequence is not available on a clinical scanner. In contrast, standard GESFIDE and GESSE both used data from only one modified GESFIDE sequence, with a total scan time of approximately 5 min. However, the sequence is not standard on clinical scanners, results may depend on implementation, and imaging time using our implementation would be approximately 30 min for whole-brain coverage without acceleration. Total scan time can be significantly reduced with parallel imaging techniques such as GRAPPA (43) and by increasing the slice thickness, though additional shimming techniques may be necessary to reduce the effect of B0 inhomogeneity (44). Lastly, the combined approach required one modified GESFIDE sequence and two repetitions of CubeQuant in our study, with a total scan time of approximately 15 min. Whole-brain coverage would require over 40 min to acquire. Using alternative R2* and R2 mapping sequences, including vendor-specific product sequences such as mul[ti-echo echo-planar imaging, the total scan time can be reduced. For multi-center and/or multi-vendor studies, the combined approach would be most practical, as the required imaging sequences are more accessible and easier to standardize. Indeed, in published literature, the combined approach is commonly used (12,13,45).
There is limited literature with R2’ values in normal human brains at 3T. We have found only 4 comparable studies (normal, relatively young volunteers, scanned at 3T), with a wide range of results (Table 4). While the GESFIDE-based study (10) produced values similar to ours, the GESSE-based study (11) produced much lower R2’ values than the GESSE results in our study. Published details were not sufficient to explain this discrepancy. On the other hand, the studies using the combined approach (12,13) produced R2’ values significantly higher than all measurements obtained in our study. From published details, one contributing factor may be that some investigators (12) did not correct for stimulated echoes (46) in their R2 calculation, potentially resulting in underestimation of R2 (47) and hence overestimation of R2’. It is also noted that R2 may be underestimated using different acquisition methods and imaging parameters (13), hence producing higher R2’ in the combined approach. Therefore, the exact implementation of the combined approach should be carefully considered.
In addition, Table 4 also includes R2’ results obtained using a multi-compartmental GESSE-based qBOLD technique at 3T (4). While it is difficult to compare the results directly, since this study utilized a more complex model than the single-compartment tissue model, the published results were most similar to those obtained in the current study with GESSE. While this multi-compartmental technique was tested against direct blood oxygenation sampling in rats at 4.7 with good results (48), it is important to remember that even this technique does not completely account for non-BOLD contributions to R2’ such as myelin and water diffusion, which based on the current study, we believe are important. Finally, R2’ is found to correlate with age due to the accumulation of non-heme iron in the brain (5,6,13), so some part of the discrepancy between our measurements and others’ (4,11,12) may be caused by age differences between subject samples.
Conclusions
This study found that four standard methods for measuring R2’ in the human brain yielded significantly different R2’ values in GM and WM of young normal subjects. The GESSE method was found to produce the lowest R2’ measurements relative to every other method. It was observed that R2’ measurements can be affected by several competing factors with varying influence in GM and WM. Amongst these, the presence of multi-compartment tissue structure, leading to multi-exponential decay, caused variation that could be partially removed using multi-exponential R2 correction techniques.
We conclude that the measurement of R2’ at 3T is dependent on the measurement technique and that researchers should carefully consider whether they wish to use a single-compartment approach, and if so, which method to use. For comparative or longitudinal studies, it is important for the method to be consistent and appropriate for the region of interest. Out of the four methods investigated, GESFIDE or GESSE may be preferable when custom implemented sequences are available and provide sufficient coverage, while the combined approach may be preferable for logistical reasons.
Acknowledgements
The authors would like to acknowledge <*> for grant and fellowship support, and <*> for assistance with the <*> sequence.
References
- 1.Siemonsen S, Fitting T, Thomalla G, Horn P, Finsterbusch J, Summers P, Saager C, Kucinski T, Fiehler J. T2’ Imaging Predicts Infarct Growth beyond the Acute Lesion in Acute Stroke. Radiology. 2008;248:979–986. doi: 10.1148/radiol.2483071602. [DOI] [PubMed] [Google Scholar]
- 2.Tóth V, Förschler A, Hirsch N. MR-based hypoxia measures in human glioma. J. Neurooncology. 2013;115:197–207. doi: 10.1007/s11060-013-1210-7. [DOI] [PubMed] [Google Scholar]
- 3.Haacke EM, Mittal S, Wu Z, Neelavalli J, Cheng Y-CN. Susceptibility-weighted imaging: technical aspects and clinical applications, Part 1. Am. J. Neuroradiol. 2009;30:19–30. doi: 10.3174/ajnr.A1400. [DOI] [PMC free article] [PubMed] [Google Scholar]
- 4.He X, Yablonskiy DA. Quantitative BOLD: mapping of human cerebral deoxygenated blood volume and oxygen extraction fraction: default state. Magn. Reson. Med. 2007;57:115–126. doi: 10.1002/mrm.21108. [DOI] [PMC free article] [PubMed] [Google Scholar]
- 5.Zecca L, Youdim MBH, Riederer P, Connor JR, Crichton RR. Iron, brain ageing and neurodegenerative disorders. Nat. Rev. Neurosci. 2004;5:863–873. doi: 10.1038/nrn1537. [DOI] [PubMed] [Google Scholar]
- 6.Hikita T, Abe K, Sakoda S, Tanaka H, Murase K, Fujita N. Determination of transverse relaxation rate for estimating iron deposits in central nervous system. Neurosci. Res. 2005;51:67–71. doi: 10.1016/j.neures.2004.09.006. [DOI] [PubMed] [Google Scholar]
- 7.Haacke EM, Cheng NYC, House MJ, Liu Q, Neelavalli J, Ogg RJ, Khan A, Ayaz M, Kirsch W, Obenaus A. Imaging iron stores in the brain using magnetic resonance imaging. Magn. Reson. Imaging. 2005;23:1–25. doi: 10.1016/j.mri.2004.10.001. [DOI] [PubMed] [Google Scholar]
- 8.Christen T, Lemasson B, Pannetier N, Farion R, Segebarth C, Rémy C, Barbier EL. Evaluation of a quantitative blood oxygenation level-dependent (qBOLD) approach to map local blood oxygen saturation. NMR Biomed. 2010:393–403. doi: 10.1002/nbm.1603. [DOI] [PubMed] [Google Scholar]
- 9.Yablonskiy D, Haacke E. Theory of NMR signal behavior in magnetically inhomogeneous tissues: the static dephasing regime. Magn. Reson. Med. 1994;32:749–763. doi: 10.1002/mrm.1910320610. [DOI] [PubMed] [Google Scholar]
- 10.Gelman N, Gorell JM, Barker PB, Savage RM, Spickler EM, Windham JP, Knight RA. MR imaging of human brain at 3.0 T: preliminary report on transverse relaxation rates and relation to estimated iron content. Radiology. 1999;210:759–767. doi: 10.1148/radiology.210.3.r99fe41759. [DOI] [PubMed] [Google Scholar]
- 11.Mallik CA, Lythgoe DJ, Barker GJ. Age Related Differences in Brain Iron Detected In Vivo at 3T With Quantitative MRI: Comparison of R2, R2’ and R2*. Proc. Int. Soc. Magn. Reson. Med. 2011;3:4504. [Google Scholar]
- 12.Paling D, Tozer D, Wheeler-Kingshott C, Kapoor R, Miller DH, Golay X. Reduced R2’ in multiple sclerosis normal appearing white matter and lesions may reflect decreased myelin and iron content. J. Neurol. Neurosurg. Psychiatry. 2012;83:785–792. doi: 10.1136/jnnp-2012-302541. [DOI] [PubMed] [Google Scholar]
- 13.Sedlacik J, Boelmans K, Löbel U, Holst B, Siemonsen S, Fiehler J. Reversible, irreversible and effective transverse relaxation rates in normal aging brain at 3T. Neuroimage. 2013;84:1032–1041. doi: 10.1016/j.neuroimage.2013.08.051. [DOI] [PubMed] [Google Scholar]
- 14.Christen T, Lemasson B, Pannetier N. Is T2* Enough to Assess Oxygenation? Quantitative Blood Oxygen Level-Dependent Analysis in Brain Tumor. Radiology. 2012;262:495–502. doi: 10.1148/radiol.11110518. [DOI] [PMC free article] [PubMed] [Google Scholar]
- 15.Fujita N. Quantitative mapping of cerebral deoxyhemoglobin content using MR imaging. Neuroimage. 2003;20:2071–2083. doi: 10.1016/j.neuroimage.2003.06.002. [DOI] [PubMed] [Google Scholar]
- 16.Stables L, Kennan R, Gore J. Asymmetric spin-echo imaging of magnetically inhomogeneous systems: Theory, experiment, and numerical studies. Magn. Reson. Med. 1998;40:432–442. doi: 10.1002/mrm.1910400314. [DOI] [PubMed] [Google Scholar]
- 17.Ma J, Wehrli FW. Method for Image-Based Measurement of the Reversible and Irreversible Contribution to the Transverse-Relaxation Rate. J. Magn. Reson. Ser. B. 1996;111:61–69. doi: 10.1006/jmrb.1996.0060. [DOI] [PubMed] [Google Scholar]
- 18.Yablonskiy D, Haacke E. An MRI method for measuring T2 in the presence of static and RF magnetic field inhomogeneities. Magn. Reson. Med. 1997;37:872–876. doi: 10.1002/mrm.1910370611. [DOI] [PubMed] [Google Scholar]
- 19.Bartzokis G, Cummings JL, Sultzer D, Henderson VW, Nuechterlein KH, Mintz J. White Matter Structural Integrity in Healthy Aging Adults and Patients With Alzheimer Disease. J. Am. Med. Assoc. Arch. Neurol. 2003;60:393–398. doi: 10.1001/archneur.60.3.393. [DOI] [PubMed] [Google Scholar]
- 20.Wang J, Shaffer ML, Eslinger PJ, Sun X, Weitekamp CW, Patel MM, Dossick D, Gill DJ, Connor JR, Yang QX. Maturational and aging effects on human brain apparent transverse relaxation. PLoS One. 2012;7:e31907. doi: 10.1371/journal.pone.0031907. [DOI] [PMC free article] [PubMed] [Google Scholar]
- 21.Péran P, Hagberg G, Luccichenti G, Cherubini A, Brainovich V, Celsis P, Caltagirone C, Sabatini U. Voxel-based analysis of R2* maps in the healthy human brain. J. Magn. Reson. Imaging. 2007;26:1413–1420. doi: 10.1002/jmri.21204. [DOI] [PubMed] [Google Scholar]
- 22.Yablonskiy D. Quantitation of intrinsic magnetic susceptibility-related effects in a tissue matrix. Phantom study. Magn. Reson. Med. 1998;39:417–428. doi: 10.1002/mrm.1910390312. [DOI] [PubMed] [Google Scholar]
- 23.Chen W, Takahashi A, Han E. 3D Quantitative Imaging of T1rho and T2. Proc. Int. Soc. Magn. Reson. Med. 2011;19:231. [Google Scholar]
- 24.Smith SM. Fast robust automated brain extraction. Hum. Brain Mapp. 2002;17:143–155. doi: 10.1002/hbm.10062. [DOI] [PMC free article] [PubMed] [Google Scholar]
- 25.Zhang Y, Brady M, Smith S. Segmentation of brain MR images through a hidden Markov random field model and the expectation-maximization algorithm. IEEE Trans. Med. Imaging. 2001;20:45–57. doi: 10.1109/42.906424. [DOI] [PubMed] [Google Scholar]
- 26.Kingsley P. Introduction to Diffusion Tensor Imaging Mathematics: Part II. Anisotropy, Diffusion-Weighting Factors, and Gradient Encoding Schemes. Concepts Magn. Reson. Part A. 2006;28A:123–154. [Google Scholar]
- 27.Straka M, Albers GW, Bammer R. Real-time diffusion-perfusion mismatch analysis in acute stroke. J. Magn. Reson. Imaging. 2010;32:1024–1037. doi: 10.1002/jmri.22338. [DOI] [PMC free article] [PubMed] [Google Scholar]
- 28.Dickson JD, Ash TWJ, Williams GB, Harding SG, Carpenter TA, Menon DK, Ansorge RE. Quantitative BOLD: the effect of diffusion. J. Magn. Reson. Imaging. 2010;32:953–961. doi: 10.1002/jmri.22151. [DOI] [PubMed] [Google Scholar]
- 29.Dickson JD, Ash TWJ, Williams GB, Sukstanskii AL, Ansorge RE, Yablonskiy DA. Quantitative phenomenological model of the BOLD contrast mechanism. J. Magn. Reson. 2011;212:17–25. doi: 10.1016/j.jmr.2011.06.003. [DOI] [PMC free article] [PubMed] [Google Scholar]
- 30.Whittall KP, MacKay AL, Graeb DA, Nugent RA, Li DK, Paty DW. In vivo measurement of T2 distributions and water contents in normal human brain. Magn. Reson. Med. 1997;37:34–43. doi: 10.1002/mrm.1910370107. [DOI] [PubMed] [Google Scholar]
- 31.Laule C, Vavasour IM, Moore GRW, Oger J, Li DKB, Paty DW, MacKay AL. Water content and myelin water fraction in multiple sclerosis. A T2 relaxation study. J. Neurol. 2004;251:284–293. doi: 10.1007/s00415-004-0306-6. [DOI] [PubMed] [Google Scholar]
- 32.Du YP, Chu R, Hwang D, Brown MS, Kleinschmidt-DeMasters BK, Singel D, Simon JH. Fast multislice mapping of the myelin water fraction using multicompartment analysis of T2* decay at 3T: a preliminary postmortem study. Magn. Reson. Med. 2007;58:865–870. doi: 10.1002/mrm.21409. [DOI] [PubMed] [Google Scholar]
- 33.Prasloski T, Rauscher A, MacKay AL, Hodgson M, Vavasour IM, Laule C, Mädler B. Rapid whole cerebrum myelin water imaging using a 3D GRASE sequence. Neuroimage. 2012;63:533–539. doi: 10.1016/j.neuroimage.2012.06.064. [DOI] [PubMed] [Google Scholar]
- 34.Wharton S, Bowtell R. Fiber orientation-dependent white matter contrast in gradient echo MRI. Proc. Natl. Acad. Sci. U. S. A. 2012;109:18559–18564. doi: 10.1073/pnas.1211075109. [DOI] [PMC free article] [PubMed] [Google Scholar]
- 35.Sati P, van Gelderen P, Silva AC, Reich DS, Merkle H, de Zwart Ja, Duyn JH. Micro-compartment specific T2* relaxation in the brain. Neuroimage. 2013;77:268–278. doi: 10.1016/j.neuroimage.2013.03.005. [DOI] [PMC free article] [PubMed] [Google Scholar]
- 36.Yablonskiy DA, Sukstanskii AL, He X. Blood oxygenation level-dependent (BOLD)-based techniques for the quantification of brain hemodynamic and metabolic properties - theoretical models and experimental approaches. NMR Biomed. 2013;26:963–986. doi: 10.1002/nbm.2839. [DOI] [PMC free article] [PubMed] [Google Scholar]
- 37.Yang X, Sammet S, Schmalbrock P, Knopp MV. Postprocessing correction for distortions in T2* decay caused by quadratic cross-slice B0 inhomogeneity. Magn. Reson. Med. 2010;63:1258–1268. doi: 10.1002/mrm.22316. [DOI] [PubMed] [Google Scholar]
- 38.Yablonskiy Da, Sukstanskii AL, Luo J, Wang X. Voxel spread function method for correction of magnetic field inhomogeneity effects in quantitative gradient-echo-based MRI. Magn. Reson. Med. 2013;70:1283–1292. doi: 10.1002/mrm.24585. [DOI] [PMC free article] [PubMed] [Google Scholar]
- 39.Murkin JM, Arango M. Near-infrared spectroscopy as an index of brain and tissue oxygenation. Br. J. Anaesth. 2009;103(Suppl):i3–i13. doi: 10.1093/bja/aep299. [DOI] [PubMed] [Google Scholar]
- 40.Taillefer M, Denault A. Cerebral near-infrared spectroscopy in adult heart surgery: systematic review of its clinical efficacy. Can. J. Anesth. 2005;52:79–87. doi: 10.1007/BF03018586. [DOI] [PubMed] [Google Scholar]
- 41.Derdeyn CP, Videen TO, Grubb RL, Powers WJ. Comparison of PET oxygen extraction fraction methods for the prediction of stroke risk. J. Nucl. Med. 2001;42:1195–1197. [PubMed] [Google Scholar]
- 42.Ito H, Kanno I, Kato C, et al. Database of normal human cerebral blood flow, cerebral blood volume, cerebral oxygen extraction fraction and cerebral metabolic rate of oxygen measured by positron emission tomography with 15O-labelled carbon dioxide or water, carbon monoxide and oxygen. Eur. J. Nucl. Med. Mol. Imaging. 2004;31:635–643. doi: 10.1007/s00259-003-1430-8. [DOI] [PubMed] [Google Scholar]
- 43.Griswold Ma, Jakob PM, Heidemann RM, Nittka M, Jellus V, Wang J, Kiefer B, Haase A. Generalized autocalibrating partially parallel acquisitions (GRAPPA) Magn. Reson. Med. 2002;47:1202–1210. doi: 10.1002/mrm.10171. [DOI] [PubMed] [Google Scholar]
- 44.Oh SS, Oh S-H, Nam Y, Han D, Stafford RB, Hwang J, Kim D-H, Park H, Lee J. Improved susceptibility weighted imaging method using multi-echo acquisition. Magn. Reson. Med. 2013 doi: 10.1002/mrm.24940. [DOI] [PMC free article] [PubMed] [Google Scholar]
- 45.Siemonsen S, Finsterbusch J, Matschke J, Lorenzen a, Ding X-Q, Fiehler J. Age-dependent normal values of T2* and T2’ in brain parenchyma. AJNR. Am. J. Neuroradiol. 2008;29:950–955. doi: 10.3174/ajnr.A0951. [DOI] [PMC free article] [PubMed] [Google Scholar]
- 46.Hennig J. Multiecho Imaging Sequences with Low Refocusing Flip Angles. J. Magn. Reson. 1988;78:397–407. [Google Scholar]
- 47.Lebel RM, Wilman AH. Transverse relaxometry with stimulated echo compensation. Magn. Reson. Med. 2010;64:1005–1014. doi: 10.1002/mrm.22487. [DOI] [PubMed] [Google Scholar]
- 48.He X, Zhu M, Yablonskiy DA. Validation of oxygen extraction fraction measurement by qBOLD technique. Magn. Reson. Med. 2008;60:882–888. doi: 10.1002/mrm.21719. [DOI] [PMC free article] [PubMed] [Google Scholar]
- 49.Sedlacik J, Reichenbach JR. Validation of quantitative estimation of tissue oxygen extraction fraction and deoxygenated blood volume fraction in phantom and in vivo experiments by using MRI. Magn. Reson. Med. 2010;63:910–921. doi: 10.1002/mrm.22274. [DOI] [PubMed] [Google Scholar]
- 50.Sohlin MC, Schad LR. Susceptibility-related MR signal dephasing under nonstatic conditions: experimental verification and consequences for qBOLD measurements. J. Magn. Reson. Imaging. 2011;33:417–425. doi: 10.1002/jmri.22423. [DOI] [PubMed] [Google Scholar]
- 51.Christen T, Pannetier NA, Ni WW, Qiu D, Moseley ME, Schuff N, Zaharchuk G. MR vascular fingerprinting: A new approach to compute cerebral blood volume, mean vessel radius, and oxygenation maps in the human brain. Neuroimage. 2014;89:262–270. doi: 10.1016/j.neuroimage.2013.11.052. [DOI] [PMC free article] [PubMed] [Google Scholar]


