

Abstract
Covertly directing visuospatial attention produces a frequency-specific modulation of neuronal oscillations in occipital and parietal cortices: anticipatory alpha (8–12 Hz) power decreases contralateral and increases ipsilateral to attention, whereas stimulus-induced gamma (>40 Hz) power is boosted contralaterally and attenuated ipsilaterally. These modulations must be under top-down control; however, the control mechanisms are not yet fully understood. Here we investigated the causal contribution of the human frontal eye field (FEF) by combining repetitive transcranial magnetic stimulation (TMS) with subsequent magnetoencephalography. Following inhibitory theta burst stimulation to the left FEF, right FEF, or vertex, participants performed a visual discrimination task requiring covert attention to either visual hemifield. Both left and right FEF TMS caused marked attenuation of alpha modulation in the occipitoparietal cortex. Notably, alpha modulation was consistently reduced in the hemisphere contralateral to stimulation, leaving the ipsilateral hemisphere relatively unaffected. Additionally, right FEF TMS enhanced gamma modulation in left visual cortex. Behaviorally, TMS caused a relative slowing of response times to targets contralateral to stimulation during the early task period. Our results suggest that left and right FEF are causally involved in the attentional top-down control of anticipatory alpha power in the contralateral visual system, whereas a right-hemispheric dominance seems to exist for control of stimulus-induced gamma power. These findings contrast the assumption of primarily intrahemispheric connectivity between FEF and parietal cortex, emphasizing the relevance of interhemispheric interactions. The contralaterality of effects may result from a transient functional reorganization of the dorsal attention network after inhibition of either FEF.
Keywords: dorsal attentional network, frontal eye field, magnetoencephalography, transcranial magnetic stimulation, visual attention
Introduction
To cope with a constant stream of visual information, it is necessary to actively select and prioritize certain incoming stimuli. Humans are able to voluntarily shift their attentional focus in visual space without moving their eyes (Posner, 1980), which enables enhanced processing of visual input from task-relevant locations and suppression of distracting input from task-irrelevant ones (Kastner and Ungerleider, 2000).
Numerous magneto/electroencephalography (M/EEG) studies suggest that alpha (8–12 Hz) oscillations support covert attention. Visual alpha power decreases in anticipation of a target but increases in anticipation of a distractor (Worden et al., 2000; Kelly et al., 2006; Händel et al., 2011; Bonnefond and Jensen, 2012). Covertly shifting attention to either visual hemifield produces retinotopically specific modulations of alpha power with a relative decrease contralateral to the attended hemifield, complemented by an ipsilateral increase (Worden et al., 2000; Thut et al., 2006; Händel et al., 2011). Successful anticipatory alpha lateralization predicts performance on attentional tasks (Thut et al., 2006; Händel et al., 2011). In parallel, visual selective attention boosts the gamma-band (>40 Hz) oscillatory response to a stimulus (Müller et al., 2000; Fries et al., 2001), and stimulus-induced gamma power predicts subsequent task performance (Siegel et al., 2008).
These oscillatory mechanisms must be under top-down attentional control, likely implicating the dorsal frontoparietal network, consisting of bilateral frontal eye fields (FEFs) and intraparietal sulci (IPS; Corbetta and Shulman, 2002). The FEF is strongly active during covert attention (Gitelman et al., 1999; Kastner et al., 1999), and stimulation of the FEF disrupts visual discrimination performance (O'Shea et al., 2004) and modulates visual cortex activity both in monkeys (Moore and Armstrong, 2003; Premereur et al., 2013) and in humans (Ruff et al., 2006; Taylor et al., 2007). Transcranial magnetic stimulation (TMS) in humans has further demonstrated asymmetric effects on visual detection performance (Grosbras and Paus, 2003; Duecker et al., 2013), visual cortex excitability (Silvanto et al., 2006), and top-down attentional control (Hung et al., 2011), with right FEF often affecting both hemifields, and left FEF only the contralateral hemifield, suggesting some right hemispheric dominance. Accordingly, previous TMS-EEG studies have focused on right FEF involvement in attentional control via modulation of alpha oscillations (Capotosto et al., 2009; Sauseng et al., 2011) and neglected any potential left FEF contributions. Furthermore, although FEF microstimulation has been shown to increase stimulus-induced gamma power in monkey parietal cortex (Premereur et al., 2012), the involvement of FEFs in controlling attentional modulations of gamma power remains unknown.
To investigate the respective roles of left and right FEF in top-down control over both anticipatory alpha and stimulus-induced gamma oscillations, we combined functional magnetic resonance imaging (fMRI)-guided TMS with magnetoencephalography (MEG). Using continuous theta burst stimulation (cTBS), we applied transient offline inhibition to the left FEF, the right FEF, or scalp vertex (as a control condition) in separate sessions before participants performed a cued visuospatial attention task in the MEG. We hypothesized that transient inhibition of left or right FEF would produce hemisphere-specific disruptions of attentional modulation of alpha and gamma oscillations.
Materials and Methods
Participants.
Twenty right-handed healthy participants with normal or corrected-to-normal vision (14 females, 6 males) took part in the experiment. All participants conformed to standard exclusion criteria for fMRI, MEG, and TMS. Informed consent was obtained according to the Declaration of Helsinki. The study was approved by the local ethics committee. One participant was excluded from analyses due to excessive head movements (>1 cm) during MEG measurement leaving data from 19 participants to be analyzed.
Procedure.
All participants took part in four experimental sessions on 4 separate days (Fig. 1B). During Session 1, the anatomical locations of the FEFs in each participant were determined functionally by fMRI (20 min), and motor thresholds were determined individually to set TMS intensity. Sessions 2, 3, and 4 were counterbalanced in order and separated by at least 7 d. The procedure for these sessions was as follows: the participant was prepared for entering the MEG, taken to an adjacent lab where cTBS was applied to one of the three target sites (left FEF, right FEF, vertex), and then brought back to the MEG lab and placed inside the MEG where s/he performed a cued spatial attention task. Average time between delivery of cTBS and start of the MEG task was 6.6 min (max 9.6 min). Average time between delivery of cTBS and completion of the MEG task was 29.5 min (max 35.3 min). The MEG acquisition sessions were kept deliberately short due to one previous study indicating a window of efficacy of cTBS to the FEF of ∼30 min (Nyffeler et al., 2006).
Figure 1.

Experimental paradigm and setup. A, Experimental paradigm. Each trial began with an auditory cue (high or low tone) instructing participants to covertly attend to the luminance pedestal in either hemifield. Left and right attentional cues were presented pseudorandomly. Following a 1.5 s interval oriented Gabor patches appeared in both pedestals. Participants had to discriminate the orientation of the cued patch (45° clockwise or anticlockwise from vertical) while ignoring the uncued distracter patches (0° or 90° from vertical). In the fMRI version of this task, used to localize the FEF for TMS, participants completed short (22 s) blocks consisting of spatially cued trials contrasted with blocks of nonspatially cued trials. B, Experimental time course. Participants completed four experimental sessions. In Session 1, left and right FEF were functionally localized based on the attention task performed in the MRI scanner, and the active motor threshold to titrate TMS intensity was determined for each individual. Sessions 2, 3, and 4 consisted of cTBS to one of the three target sites (order counter-balanced across participants and separated by at least 1 week) followed by performance of the attention task during MEG recordings. C, fMRI localizer. Individual TMS target sites for left and right FEF stimulation are shown, superimposed on a standard brain, as derived from the peak voxels within anatomical constraints of the “shift attention” versus “hold attention” contrast of the fMRI localizer task. D, Group fMRI activation map for the contrast SHIFT > NO-SHIFT (t values). Map is thresholded at p < 0.001 (uncorrected).
Attention task.
During MEG data acquisition, participants performed a cued spatial attention task (Fig. 1A). Each trial began with a brief (100 ms) auditory cue tone (high: 440 Hz; low: 880 Hz) instructing participants to covertly attend to one of two luminance pedestals in the lower left and lower right quadrants of the screen. The pedestals were presented 3.2 degrees of visual angle below the horizontal meridian, and 4.8 degrees to the left and right of the vertical meridian. Tone-direction mappings were counterbalanced across participants. Cues were 100% valid. After a cue-target interval of 1500 ms a target Gabor patch (2.5 cycles/° visual angle) was presented at each luminance pedestal. The cued patch was always tilted 45°either clockwise or counterclockwise from vertical. The distractor patch was either horizontal or vertical. Patches were displayed for 60 ms (4 screen refreshes) before being masked by a composite patch for 60 ms, created by the convolution of all four possible Gabor patches. Participants were instructed to report the orientation of the target patch with a button press using the index and middle fingers of the right hand (clockwise = middle finger, counterclockwise = index finger). Participants were instructed to perform the task as quickly and accurately as possible. Participants completed five blocks of 68 trials. Total task duration was 25 min. An adaptive staircase procedure (Watson and Pelli, 1983) was used to adjust target contrast at the beginning of each session before the application of TMS. Participants performed one block of trials where contrast threshold was adjusted in the MEG environment to converge on 70% correct performance. Contrast for left and right stimuli were matched. Mask contrast remained constant at 90% of maximum contrast.
During the fMRI localizer session, participants performed an adapted version of the task. In this version, participants completed short (20.7 s) blocks of two types. During SHIFT blocks, high or low tones were presented instructing participants to covertly attend to the left or right hemifield. During NO-SHIFT blocks, tones of intermediate pitch (660 Hz) were presented which did not carry spatial information; they signaled an upcoming target but could not be used to allocate attention to either hemifield. The contrast between brain activity in the SHIFT versus NO-SHIFT blocks was used to functionally localize the FEFs. Each block was directly preceded by a brief (2 s) instruction indicating the block type. Participants completed 44 blocks of six trials. Total task duration was 18 min.
TMS.
TMS was delivered with a biphasic pulse configuration using a MagVenture C-B60 Butterfly coil connected to a MagPro-X100 stimulator (MagVenture). Coil position and orientation were established and kept constant at individually determined target sites by means of a frameless stereotactic neuro-navigation system (Localite TMS Navigator) after coregistration of individual MRI scans.
During the localizer session, the active motor threshold (aMT) was determined for each individual according to standard procedures (Rossini et al., 1994). Electromyography was recorded from the first dorsal interosseous (FDI) muscle of the right hand in a belly-tendon montage at 2 kHz sampling rate and bandpass filtered at 10–1000 Hz using an EKIDA DC amplifier (Ekida GmbH). Motor-evoked potentials (MEPs) in response to single-pulse TMS were measured as peak-to-peak amplitude. The TMS coil was positioned tangentially to the skull above the hand area of the left primary motor cortex with the handle pointing backward and laterally at an angle of ∼45° to the sagittal midline, inducing an electrical current in the brain tissue with the reversal phase of the biphasic stimulus having a posterior-to-anterior (p–a) direction, perpendicular to the central sulcus. This induced current direction is known to be optimal for evoking motor responses in the contralateral hand (Mills et al., 1992). The location and exact coil orientation at which TMS pulses at an intensity slightly above each individual's aMT consistently yielded MEPs in the contralateral FDI muscle was defined as the “FDI motor hotspot.” Participants were then asked to grip a tape roll in a manner producing optimal contraction of the FDI muscle and continuously contracted at 10% of maximum (maintained via visual feedback), while single TMS pulses were delivered to the FDI motor hotspot every 4–6 s. Stimulator output intensity was then decreased progressively until a MEP was observed on 5 of 10 trials. On average, aMT was 29 ± 5% (mean ± SD) of maximum stimulator output.
In all experimental sessions, cTBS was delivered to one of the three target sites, i.e., left FEF, right FEF, vertex. Left and right FEF target coordinates were determined from individual fMRI localizers (see fMRI data analysis; Fig. 1C,D), with the coil orientation adjusted individually to induce an electrical current in the brain tissue with the reversal phase of the biphasic stimulus having a p–a direction, perpendicular to the precentral sulcus. The vertex target coordinate was defined as the junction of the two central sulci taken from the individual structural MRI and the coil position was adjusted to produce a p–a current in the brain tissue. cTBS consisted of short 50 Hz bursts of three pulses applied at a frequency of 5 Hz (i.e., a 200 ms intertrain interval) for 40 s (i.e., 600 pulses in total) at 80% aMT (Huang et al., 2005). During cTBS and for 1 min afterward participants remained seated and maintained fixation.
fMRI data acquisition.
Participants completed an fMRI version of the cued attention task, which was used to localize left and right FEF (see above). fMRI data were acquired using a 1.5T Avanto MRI scanner (Siemens) using a multi-echo (Poser et al., 2006) echoplanar sequence (TR = 2.18 s, TEs = 9.4, 21.2, 33 and 45 ms, flip angle = 90°, 31 axial slices, slice thickness = 3 mm, FoV = 224 × 224 mm, in plane voxel size = 3.5 × 3.5 mm). A high-resolution T1-weighted image (TR = 2250 ms, TE = 2.58 ms, flip angle = 15°, 208 sagittal slices, in plane voxel size = 1 × 1×1 mm, FOV = 224 × 224 mm) was acquired for coregistration of functional images, TMS neuro-navigation and MEG source analysis.
MEG data acquisition.
Participants were seated upright in the MEG system with their arms positioned comfortably on the armrests beside them. They were instructed not to move during the experiment and to keep fixation on the presentation screen in front of them. Horizontal and vertical eye movements were recorded by electrooculogram and heartbeat was recorded by electrocardiogram. Brain activity was recorded at a sampling frequency of 1200 Hz with a low-pass filter of 300 Hz using a whole-head MEG system with 275 axial gradiometers (CTF MEG systems, VSM MedTech). During acquisition, head position was constantly monitored using a real-time head localizer based on the position of marker coils placed in the ear canals and at the nasion (Stolk et al., 2013). If necessary (deviation >5 mm), head position was readjusted according to visual feedback at the end of each block. This allowed for positioning the participants at about the same location in the different MEG sessions.
fMRI data analysis.
Image processing and statistical analysis was performed using SPM8 (www.fil.ion.ucl.ac.uk) and MATLAB 2012b (MathWorks). All multi-echo images were realigned to the first image of the series and a weighted image of the four echo images was calculated per TR (Poser et al., 2006). Functional images were then coregistered to the anatomical T1 image and smoothed using a 6 mm full-width at half-maximum isotropic Gaussian kernel. For each participant, a fixed effect model was constructed, consisting of two 20.7 s block regressors of interest (SHIFT, NO-SHIFT) plus the instruction as a stick function, each convolved with the canonical hemodynamic response function. In addition, the six realignment parameters were modeled as head movement regressors. A paired-sample t test (SHIFT > NO-SHIFT) revealed voxels showing a stronger blood oxygenation level-dependent (BOLD) response when shifting attention to either hemifield compared with maintaining attention on both hemifields. Respective peak voxels of left and right FEF clusters (i.e., those directly anterior to the precentral sulcus and lateral to the superior prefrontal sulcus) were used as TMS target coordinates (Fig. 1C).
Whereas TMS target sites were determined individually, an additional fMRI group analysis was conducted to demonstrate the recruitment of the dorsal attention network during task performance. For this fMRI analysis, the procedures described above were repeated, but both anatomical and functional images were also normalized to MNI space based on the transformation parameters estimated during segmentation of anatomical images. Individual SHIFT > NO-SHIFT contrast images were then entered into a second level (random effects) group analysis and tested against zero with a one-sample t test. The resulting t map was thresholded at p < 0.001 uncorrected (Fig. 1D).
MEG data analysis.
MEG data analysis was performed using fieldtrip (http://www.ru.nl/neuroimaging/fieldtrip; Oostenveld et al., 2011). All preprocessing steps were performed in a manner blinded to the experimental condition. MEG data were visually inspected and trials containing eye blinks or horizontal eye movements were rejected. Data were further automatically inspected for muscle artifacts and squid jumps. Independent component analysis (Jung et al., 2000) was performed and components reflecting the cardiac response were discarded.
Time-frequency analysis of the sensor level data were performed using Fast Fourier transform, with separate parameters for low (1–30 Hz) and high (30–100 Hz) frequencies. For low frequencies, Fourier transformed data were multiplied with a Hanning taper using a fixed 300 ms sliding time window moving in steps of 50 ms. For high frequencies, a set of discrete prolate spheroidal tapers (Percival and Walden, 1993) were used, and data were time-resolved using a frequency-dependent time window containing seven cycles at the frequency-of-interest. Data were demeaned and detrended before time-frequency analysis.
To localize sources of both alpha and gamma oscillations we used a DICS beamformer approach (Gross et al., 2001). A realistic single-shell description of each participant's brain was constructed from the anatomical MRI. The brain volume was divided into an 8 mm3 grid and normalized to MNI coordinates using a warping procedure. To identify sources in the alpha band, a set of five orthogonal Slepian tapers was used with a center frequency of 10 Hz. For each session, a common spatial filter was constructed using 1000 ms data segments from the cue-target interval (350–1350 ms after the cue). This resulted in ±4 Hz frequency smoothing. The trials were pooled across both attention left and attention right conditions to create a common filter, which was then used to estimate the spatial distribution of alpha power separately from attention left and attention right trials. To identify sources in the gamma band, a taper set was constructed with a center frequency of 60 Hz and ±20 Hz frequency smoothing. A common filter was constructed by pooling data across pre- (1000–1300 ms) and poststimulus (1800–2100 ms) windows, and across attention left and right attention trials, and then used to separately estimate power distributions for all four conditions. This allowed us to estimate both induced gamma power (by comparing prestimulus and poststimulus time windows) and attentional modulation of induced gamma power (by comparing poststimulus activity in the attention left and attention right conditions).
An attentional modulation index was calculated for both alpha and gamma power, separately for every sensor (in sensor space) and for every voxel (in source space). For each participant and session, trials were averaged separately for the attention left and attention right conditions. A common denominator was created for normalization purposes by averaging over attention left and attention right from all three TMS conditions. Subsequently, the modulation index for each TMS condition was calculated as MIj = (PowerAttention Left,j − PowerAttention Right,j)/Common Denominatorj, where j indicates the sensor or cortical regions for which the power values were estimated. For the purpose of statistically comparing the magnitude of attentional modulation between conditions, modulation indices were calculated as MIj = (PowerAttention Contra,j − PowerAttention Ipsi,j)/[Common Denominatorj], where “contra” and “ipsi” refer to the direction of attention relative to the hemisphere from which the data were recorded. Because alpha power modulation is known to be retinotopically specific, showing a relative increase when attention is ipsilateral versus contralateral (Worden et al., 2000), this index allows for comparison of the degree of attentional modulation observed in each hemisphere.
Analysis of anticipatory alpha oscillations was performed on data from the cue-target interval. Power values were averaged over a 1 s time window from 350 to 1350 ms postcue and across 8–12 Hz bins. The 350–1350 ms window was chosen because the 300 ms sliding time window used for time-frequency analysis can lead to contamination from cue- and stimulus-evoked responses. Accordingly, we trimmed the first 350 ms (to avoid contamination by auditory cue-evoked responses) and the final 150 ms (to avoid contamination by visual stimulus-evoked responses). For sensor level analysis, left and right hemispheric regions-of-interest (ROIs) were defined as clusters of 25 matching sensor pairs in the left and right hemisphere that showed the strongest average alpha modulation across all three sessions. For source level analysis, ROIs were defined by extracting the 250 source space points in the left and right hemisphere that showed the strongest average alpha modulation across all three sessions.
Analysis of visual stimulus-induced gamma oscillations at the source level was performed by computing the relative change between the 1000–1300 ms cue-target interval and the 1800–2100 ms poststimulus interval as (post − pre)/pre. Again, ROIs were defined based on this induced response by extracting the 250 source space points in each hemisphere displaying the largest induced gamma response in the average across all three sessions and attentional conditions (see Fig. 6). Attentional gamma modulation within these ROIs was then computed using the attentional modulation index described above. Statistical analysis of gamma modulation was performed at source level only, because adaptive spatial filtering results in the improved signal-to-noise ratio necessary to optimally characterize activity at higher frequencies (Hoogenboom et al., 2006).
Figure 6.
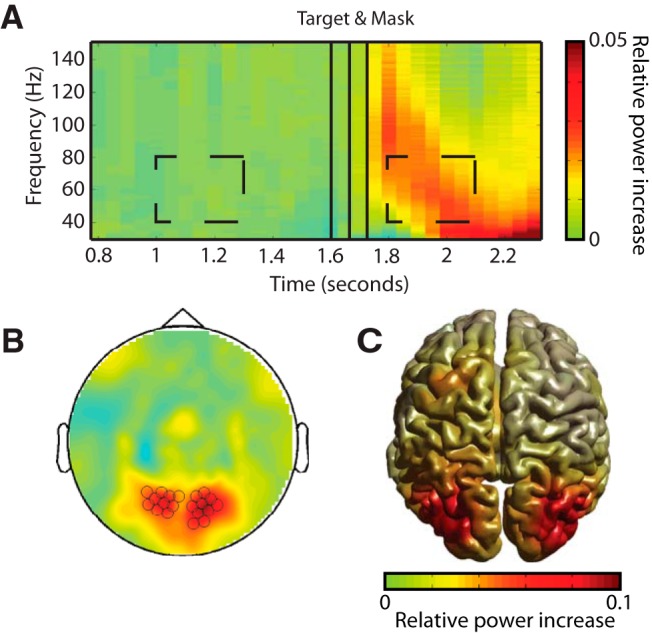
Target-mask stimuli induce a response in the gamma band. A, TFR of left and right posterior sensors, averaged across all TMS and attention conditions. Dashed boxes indicate prestimulus and poststimulus windows (40–80 Hz at 1–1.3 s and 1.8–2.1 s postcue). Relative power change was calculated as (power post − power pre)/(power pre). B, Sensor topography of the induced gamma power shown in A. C, Beamformer source reconstruction shown on a standard brain. Induced gamma-band activity is located bilaterally in visual cortex.
Behavioral data analysis.
Behavioral data were first analyzed in terms of accuracy and reaction times. To quantify attentional biases we further computed a measure of spatial attentional bias according to the formula spatial bias = (mean rtattention left − mean rtattention right)/(mean rtattention left + mean rtattention right). This formula gives positive scores for relatively faster reactions to right targets, and negative scores for relatively faster reactions to left targets.
Results
During MEG recordings, an auditory cue instructed participants to attend to the left or the right hemifield. After a 1.5 s interval, two masked target stimuli were presented in the left and right lower hemifield. Participants had to detect and report the orientation of the attended target stimulus. Just before the MEG session the participants had received cTBS to either vertex or the left or right FEFs.
TMS induces transient changes in spatial attentional bias
Participants performed the behavioral task with overall accuracy of 75.48% (left FEF TMS, 75.01 ± 3.05%; vertex TMS, 76.51 ± 2.66%; right FEF TMS, 74.92 ± 3.64%, mean ± SEM). Mean reaction times across sessions were as follows: left FEF TMS, 572 ± 14 ms; vertex TMS 548 ± 19 ms; right FEF TMS, 549 ± 20 ms. Spatial attentional bias was computed separately for each session. Given that TMS was applied offline, any behavioral effects are likely to be maximal immediately after stimulation offset, and to decay over time (O'Shea et al., 2007a). To test this, spatial attentional bias was computed and contrasted across the early (blocks 1–2, 7–16 min poststimulation) versus late (blocks 4–5, 21–30 min poststimulation) task periods. Figure 2 shows spatial attentional bias for each session and time period separately. A relative slowing of responses to targets in the hemifield contralateral (vs ipsilateral) to the stimulated FEF was observable in the early blocks which was absent in the late blocks. A 3 × 2 repeated-measures ANOVA with factors TMS (left FEF, vertex, right FEF) and time period (early, late) revealed a significant main effect of time (F(2,36) = 5.25, p = 0.034), with mean attentional bias across all TMS conditions shifting to the right as a function of time. This main effect is consistent with previous work demonstrating that fatigue can cause rightward attentional shifts (Benwell et al., 2013). Importantly, a significant interaction (F(2,36) = 5.83, p = 0.006) was also found. Post hoc tests revealed that the interaction was driven by significant differences in the early blocks (F(2,36) = 6.15, p = 0.005), and specifically by a difference between the left FEF TMS and right FEF TMS conditions (t(18) = −3.01, p = 0.008. No significant differences in attentional bias were observed in the late blocks (p > 0.3 in all cases). These results suggest that TMS induced direction-specific biases in the speed of attentional deployment that were present during the early blocks but were attenuated during late blocks.
Figure 2.
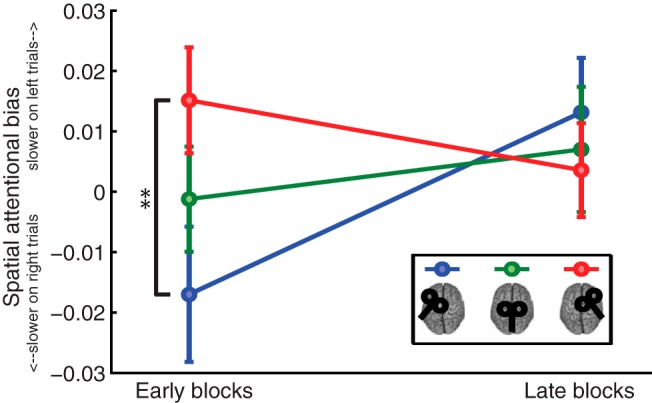
FEF TMS induces attentional biases during early task blocks. Spatial attentional bias, comparing “attention left” versus “attention right” trials, was computed separately for each TMS condition and for the early (blocks 1–2) and late (blocks 4–5) task period. During the early task blocks, attentional bias significantly varied as a function of TMS site; after left FEF TMS participants were relatively slower on attention right trials and after right FEF TMS participants were relatively slower on attention left trials. No difference was observed during late blocks, suggesting that TMS produced short-lasting (up until 16 min post-cTBS) behavioral changes.
TMS of left and right FEF disrupts contralateral alpha modulation
Analysis of anticipatory alpha modulation was performed at both the sensor and the source levels with comparable results. Fig. 3 shows time-frequency representations and topographical plots of attentional power modulation (attention to left vs right visual field) at the sensor level during the cue-target interval, separately for each experimental session. Interestingly, on visual inspection, anticipatory alpha power modulation appeared to be absent in some TMS conditions. To test quantitatively for the presence of attentional modulation, we compared the average values from left and right ROIs against zero using one-sample t tests (i.e., from the 25 sensor pairs showing strongest modulation across all three sessions throughout a 1 s window within the cue-target interval; see Materials and Methods). For the control condition following vertex TMS (middle row), there was statistically significant anticipatory alpha modulation both in the left hemisphere (t(18) = 2.11, p = 0.049) and the right hemisphere (t(18) = 4.01, p = 0.001). Surprisingly, following TMS to left FEFs (top row), anticipatory alpha modulation in these sensor ROIs was still observed ipsilateral (t(18) = 2.85, p = 0.011), but no longer contralateral, to the stimulation (t(18) = 0.62, p = 0.54). The same pattern was observed following TMS to right FEFs (bottom row: ipsilateral: t(18) = 2.81, p = 0.012; contralateral: t(18) = −0.27, p = 0.79).
Figure 3.

FEF cTBS produces site-specific disruption of anticipatory alpha power modulation. Time-frequency representations (TFR) of the attentional modulation index of power [MI = (attention left − attention right)/(average over all attention and TMS conditions)] are shown separately for left and right sensor ROIs (left and right column) and for each TMS condition (rows). The middle column shows a topographical representation of MI at 8–12 Hz between 0.35 and 1.35 s after the cue in the cue-target interval (indicated by dotted boxes in the TFRs). Sensor ROIs (indicated by black dots) were predefined based on the average across conditions (see Materials and Methods). In the control condition (vertex cTBS), alpha modulation (ipsilateral increase and contralateral decrease in alpha power relative to the attended direction) is clearly visible in both hemispheres. By contrast, after cTBS to either FEF there is a marked reduction in alpha modulation in the hemisphere contralateral to stimulation.
Fig. 4A shows the amount of anticipatory alpha power modulation (attention to contralateral vs ipsilateral visual field) at the sensor level during the cue-target interval extracted from the left and right hemisphere ROIs. To test formally whether the hemisphere of disrupted alpha power modulation depended on TMS site, all three sessions were directly contrasted using a 3 × 2 repeated-measures ANOVA with factors TMS (left FEF, vertex, right FEF) and hemisphere (left, right). The interaction was significant (F(2,36) = 4.88, p = 0.013), with follow-up tests showing conditional main effects of TMS on alpha modulation both in the left (F(2,36) = 4.35, p = 0.02) and right hemisphere (F(2,36) = 3.49, p = 0.041). Further paired t tests then demonstrated that the right hemisphere effect was mainly driven by an attenuation of alpha modulation following left FEF TMS as compared with vertex TMS (t(18) = −2.23, p = 0.039) and as a trend compared with right FEF TMS (t(18) = −2.03, p = 0.057). In the left hemisphere, alpha modulation following right FEF TMS was attenuated as compared with left FEF TMS (t(18) = −2.94, p = 0.009) and showed a trend compared with vertex TMS (t(18) = 1.91, p = 0.072).
Figure 4.
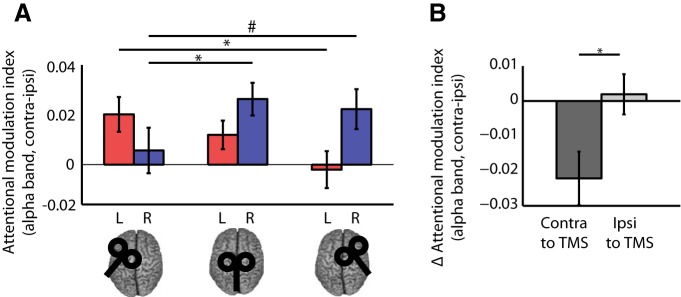
Alpha modulation from the sensor ROI data. A, Attentional modulation index (AMI) for all TMS sites and sensor ROIs. The AMI is defined as (attention contra − ipsi)/(average over all attention and TMS conditions), resulting in positive values for appropriate modulation for both hemispheres, as shown in the vertex condition. Statistical analysis revealed an interaction of TMS site and hemisphere (sensor ROI), as well as conditional main effects of TMS site for each hemisphere analyzed separately. Stimulation of left or right FEFs disrupted alpha modulation in parieto-occipital sensors in the contralateral hemisphere. Significant (p < 0.05) post hoc comparisons are indicated by asterisks, trends (p < 0.1) are indicated by hashes. B, Change in alpha modulation at sensor sites in the hemisphere contralateral and ipsilateral to TMS. The change (Δ) in AMI was calculated by subtracting the modulation in each ROI in each TMS session from the corresponding data in the control (vertex) session. Δ AMI scores were then averaged across ROIs separately for the hemisphere ipsilateral or contralateral to the stimulation (i.e., left ROI following left FEF TMS and right ROI following right FEF TMS and vice versa, respectively). Statistical analyses confirmed a stronger effect of FEF TMS on alpha modulation in the hemisphere contralateral versus ipsilateral to the stimulation (p < 0.05).
To test explicitly whether alpha modulation was generally more affected contralateral or ipsilateral to stimulation we used a paired-samples t test to compare the TMS effect on alpha modulation (FEF-vertex TMS) in the hemisphere contralateral (i.e., collapsed across left ROI after right FEF-vertex TMS and right ROI after left FEF-vertex TMS) versus ipsilateral to TMS (i.e., collapsed across left ROI after left FEF-vertex TMS and right ROI after right FEF-vertex TMS). This revealed a significantly larger effect on anticipatory alpha power modulation in the hemisphere contralateral to the stimulated FEF (t(18) = −3.00, p = 0.008; Fig. 4B).
Beamformer analysis revealed strong modulation in the alpha band in occipital and right parietal cortex (Fig. 5A), with a peak in middle occipital cortex in both hemispheres (MNI coordinates: left hemisphere −32, −80, 24, right hemisphere 32, −80, 40). Comparison of modulation in the left and right hemispheric ROIs (i.e., clusters of 250 voxels in each hemisphere showing strongest modulation across all three sessions and a 1 s window from the cue-target interval; see Materials and Methods) confirmed the attenuation of modulation contralateral to TMS, as observed at the sensor level (Fig. 5B). In the control condition (i.e., following vertex TMS), anticipatory alpha modulation during the cue-target interval was observed in both the left hemisphere (t(18) = 2.21, p = 0.041) and right hemisphere (t(18) = 4.41, p = 0.0003, one-sample t tests). Again, following TMS to left FEF alpha modulation was observed only ipsilateral (t(18) = 3.39, p = 0.003), but not contralateral, to stimulation (t(18) = 0.96, p = 0.35). Likewise, following TMS to right FEF alpha modulation was present ipsilateral to stimulation (t(18) = 3.12, p = 0.006), but not contralateral (t(18) = 1.00, p = 0.33). Again, a 3 × 2 repeated-measures ANOVA with factors TMS (left FEF, vertex, right FEF) and hemisphere (left, right) revealed an interaction of hemisphere and TMS site (F(2,36) = 3.44, p = 0.043), and follow-up tests showed, as for the sensor data, strongest effects for TMS in the hemisphere contralateral to the stimulated site: alpha modulation in the left hemisphere was attenuated after right FEF TMS compared with left FEF TMS (t(18) = 2.12, p = 0.048) but did not differ significantly from vertex TMS (t(18) = 1.18, p = 0.25). Alpha modulation in the right hemisphere was attenuated after left FEF TMS as compared with vertex TMS (t(18) = 2.52, p = 0.022) and showed a trend compared with right FEF TMS (t(18) = 1.93, p = 0.069). Again, to test explicitly whether alpha modulation was more affected contralateral or ipsilateral to stimulation we compared the respective differences from control stimulation using a paired-sample t test as described for sensor level data. This test revealed a larger effect of modulation contralateral to stimulation (t(18)= −2.30, p = 0.034; Fig. 5C). We therefore conclude that, surprisingly, inhibitory offline TMS disrupted attentional modulation of anticipatory alpha power primarily in the hemisphere contralateral rather than ipsilateral to the stimulated FEF.
Figure 5.

Source localization of alpha modulation. A, Beamformer source reconstructions (shown as surface projections on a rendered standard brain) demonstrate that the anticipatory alpha modulation (attention left–right) is maximal in occipital cortex (extending into right parietal cortex). B, AMI for all TMS sites and ROIs. The AMI is defined as (attention contra − ipsi)/(average over all attention and TMS conditions). As for the sensor level data, comparisons of the attentional modulation index (attention contra–ipsi) revealed an interaction of TMS site and hemisphere (source ROI). Significant (p < 0.05) post hoc comparisons are indicated by asterisks, trends (p < 0.1) are indicated by hashes. C, Δ AMI at ROIs in the hemisphere ipsilateral and contralateral to TMS, calculated as for the sensor level data (Fig. 3C). Comparison revealed a stronger effect on alpha modulation contralateral to stimulation (p < 0.05).
We attempted to investigate whether the observed TMS-induced changes in attentional biases during early task blocks correlated with TMS-induced alterations to alpha modulation. However no significant correlation was found in the vertex condition (p > 0.3 in all cases), limiting the usefulness of comparisons to the FEF TMS conditions.
TMS of the right FEF boosts contralateral gamma modulation
Beamformer analysis of the post-target period revealed a strong stimulus-induced visual gamma band response in both hemispheres. Figure 6A shows the relative change in power in the gamma frequency band following the presentation of the target-mask dyad (based on 20 posterior sensors shown in Fig. 6B) compared with a prestimulus baseline. This contrast demonstrates a poststimulus gamma power increase localized to the visual cortex in both hemispheres (Fig. 6C).
Analysis of the gamma modulation data were performed at the source level to ensure optimal signal-to-noise ratio. Figure 7A shows the topography of attentional gamma modulation in the poststimulus period for all sessions. Attentional modulation was present in both hemispheres in all three sessions but appeared largest in the left hemisphere following right FEF TMS. To test this we compared attentional gamma modulation in left and right hemispheric ROIs across conditions (i.e., clusters of 250 voxels in each hemisphere showing the strongest stimulus-induced gamma response across all three sessions; see Materials and Methods). Notably, we found that, by contrast with anticipatory alpha power, which was attenuated by FEF TMS, attentional gamma modulation was enhanced by FEF TMS, selectively in the contralateral left hemisphere following right FEF TMS (Fig. 7B). A 3 × 2 repeated-measures ANOVA with factors TMS (left FEF, vertex, right FEF) and hemisphere (left ROI, right ROI) revealed a significant interaction (F(2,36) = 4.22, p = 0.023). Follow-up tests revealed an effect of TMS for the left hemisphere only (F(2,36) = 4.17, p = 0.024; right hemisphere F(2,36) = 1.78, p = 0.18), which was driven by enhanced attentional gamma modulation following right FEF TMS (left FEF vs right FEF, t(18) = −2.48, p = 0.023; vertex vs right FEF, t(18) = −2.33, p = 0.032). We therefore conclude that, in contrast to anticipatory alpha power, attentional modulation of stimulus-induced gamma was altered only following TMS to the right FEF; specifically, it was enhanced in the left hemisphere, i.e., contralateral to stimulation.
Figure 7.
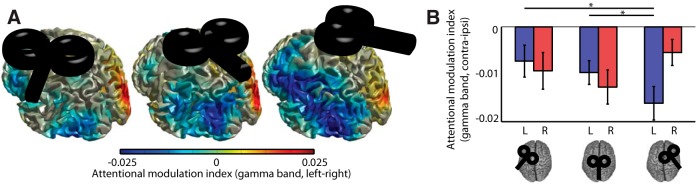
Right FEF TMS increases stimulus-induced gamma power modulation in left occipitoparietal cortex. A, Source reconstruction of attentional modulation (attention left–right) of stimulus-induced gamma. B, Comparisons of the attentional modulation index (attention contra–ipsi) revealed an interaction of TMS site and hemisphere (source ROI), reflecting a significant effect of TMS in the left (but not right) hemisphere. Planned contrasts revealed a selective effect of right FEF TMS, which facilitated stimulus-induced gamma modulation over left occipitoparietal cortex. Significant (p < 0.05) post hoc comparisons are indicated by asterisks.
As with the alpha data, we attempted to investigate whether the observed TMS-induced changes in attentional biases during early task blocks correlated with TMS-induced alterations to gamma modulation. However no significant correlation was found in the vertex condition (p > 0.18 in all cases), limiting the usefulness of comparisons to the FEF TMS conditions.
Discussion
We demonstrated a causal role of FEF in the top-down attentional control of both anticipatory alpha and stimulus-induced gamma oscillations in the visual system. Whereas alpha power modulation was observed in both hemispheres after vertex stimulation, it was essentially absent in the right hemisphere following left FEF TMS and in the left hemisphere following right FEF TMS. Furthermore, gamma power modulation was selectively increased in the left hemisphere after right FEF TMS only. Behaviorally, TMS of the transiently (up until 16 min post-TMS) altered attentional bias as revealed by slowing of responses to targets in the hemifield contralateral to TMS. Notably, TMS-induced alterations of normal attentional modulation occurred contralateral to the stimulated FEF. The contralaterality of effects challenges the assumption of predominantly intrahemispheric top-down control suggested by within-hemisphere frontoparieto-occipital anatomical (Thiebaut de Schotten et al., 2011) and functional connections (Szczepanski et al., 2013) and emphasizes the relevance of interhemispheric interactions (Kinsbourne, 1977; Knyazeva et al., 1999; Szczepanski et al., 2010).
Involvement of left and right FEFs in the anticipatory modulation of alpha oscillations
We observed the well established modulation of posterior attentional alpha power in the control condition (vertex TMS), with higher alpha power in one hemisphere when attending the ipsilateral versus the contralateral hemifield (Worden et al., 2000; Kelly et al., 2006; Händel et al., 2011). However, this modulation was no longer observed in contralateral occipitoparietal cortex following inhibitory TMS of either FEF (Figs. 3–5).
Previous online single-pulse TMS studies comparing the effects of left and right FEF stimulation on visual stimulus detection (Grosbras and Paus, 2003) and phosphene thresholds in area V5 (Silvanto et al., 2006) have reported larger effects of right FEF TMS. Specifically, right FEF TMS produced bilateral effects, whereas left FEF TMS affected the contralateral hemisphere. Because these studies suggested right FEF dominance, subsequent TMS-EEG studies restricted themselves to right FEF stimulation. Accordingly, both online interfering burst-TMS (Capotosto et al., 2009) and offline inhibiting 1 Hz rTMS (Sauseng et al., 2011) of right FEF have revealed detrimental effects on posterior alpha modulation. Our study extends these results, revealing comparable effects of both left and right FEF offline inhibition, questioning the assumption of right FEF dominance in top-down control of anticipatory alpha oscillations.
Dominance of right FEF in the attentional modulation of stimulus-induced gamma oscillations
Consistent with previous studies (Müller et al., 2000; Fries et al., 2001; Siegel et al., 2008), visual stimuli induced a robust visual gamma band response (Fig. 6), which was modulated by attention (Fig. 7), increasing when attending the contralateral versus the ipsilateral hemifield. Notably, only right FEF TMS had an effect on attentional gamma power modulation, enhancing stimulus-induced gamma in the left hemisphere (Fig. 7B). In contrast to the effects on alpha modulation, the gamma results cohere with previous TMS findings of right FEF dominance (Grosbras and Paus, 2003; Silvanto et al., 2006; Duecker et al., 2013). Our findings appear commensurate with an interhemispheric inhibition account of FEF function: inhibition of right FEF may have led to the release of the contralateral left FEF from inhibition, and consequently to an increase in frontal top-down control in the left hemisphere, leading in turn to the increase in attentional gamma power modulation that we observed (Fig. 7B). Such an account could also explain the absence of an effect of left FEF TMS on gamma modulation: whereas TMS of the right FEF may reduce the otherwise strong interhemispheric inhibition of the dominant right FEF over the left FEF, and thus lead to increased ipsilateral (left) modulation, TMS of the weaker left FEF may result in a comparatively smaller release of inhibition over right FEF, with attenuated consequences for gamma modulation.
FEF inhibition transiently alters attentional bias
TMS also produced site-specific changes in spatial attentional bias during early task blocks. Following FEF TMS, subjects became relatively slower on trials requiring covert attention contralateral to stimulation. This mirrors the “classic” finding that FEF disruption impairs contralateral saccades (Sommer and Tehovnik, 1997; Ro et al., 2002). The attenuation of alpha modulation by TMS, also contralateral to stimulation and thus ipsilateral to the impaired hemifield, suggests that behavioral impairment may have arisen from an inability to block out distracting information, a role in which alpha has been strongly implicated (Bonnefond and Jensen, 2012; Payne et al., 2013). Previous TMS-EEG studies have demonstrated effects of cTBS on oscillatory brain activity at rest lasting >60 min (Thut and Pascual-Leone, 2010). In contrast, cTBS effects on behavior are usually more short-lasting as suggested by studies demonstrating inhibitory effects of FEF cTBS for ∼30 min (Nyffeler et al., 2006; Hubl et al., 2008) or even 16 min as in the present study. Importantly, the duration of cTBS-induced effects may itself be affected by the behavior demanded by the task. That is, tasks that tax the specific function of the stimulated area may not only gradually “reanimate” the transiently inhibited brain region over the course of the task period but also instigate adaptive functional reorganization within the relevant brain networks. Together, these processes may slowly compensate for the neural interference, thus leading to a gradual recovery of behavior over time. The temporal profile of behavioral interference in the present study suggests such a compensatory process may have occurred (O'Shea et al., 2007a). However, it remains inconclusive whether the observed pattern of TMS-induced neuronal interference (ie: disruption of contralateral alpha modulation) represents either: (1) compensatory functional reorganization of the network which leads to behavioral recovery, or (2) a “virtual lesion” type effect, which caused the transient behavioral deficits observed early in the task, and which then persisted as a residual physiological after-effect after behavioral performance had been re-established. Because of lack of statistical power, it did not prove possible to disentangle these two possibilities by contrasting the MEG data from early versus late task phases. However, the observed effects on alpha modulation appeared to be particularly strong early in the task period, and to weaken over time, perhaps slightly favoring the latter interpretation.
Our use of 100% valid cues precluded comparisons of validly versus invalidly cued trials, and thereby the effect of cTBS on the uncued hemifield. This limitation was necessitated by the presumed short window of cTBS efficacy (Nyffeler et al., 2006). Furthermore, despite great care being taken to localize the FEF, we cannot rule out the possibility that adjacent sites, such as M1, were unintentionally costimulated (albeit at a lower intensity). However, although M1 inhibition might produce a general slowing, it is unlikely to alter reaction times in a manner dependent on the cued hemifield, which is what we observed. A similar point is true of adjacent dorsal premotor cortex, to which TMS slows choice reaction time with the contralateral hand (O'Shea et al., 2007b). Because our task required participants to respond with the right middle or index finger, this would predict a selective slowing in the left FEF condition. By contrast, symmetrical slowing effects were observed in response to left and right FEF TMS, which were specific to the location of the target and not the responding hand.
Contralaterality of effects: a network perspective
At first glance, the observed contralaterality of effects on both alpha and gamma modulation may seem surprising considering the prevalence of fiber pathways linking ipsilateral frontal and parietal cortex (Thiebaut de Schotten et al., 2011). However, effective interhemispheric connectivity between both left and right FEF and contralateral visual cortex has been demonstrated using concurrent TMS-fMRI (Ruff et al., 2006, 2009). This connectivity may be primarily underpinned by structural connections between left and right FEF. Tracer studies in primates have indicated that 14% of interhemispheric connections originating in FEF in one hemisphere terminate in contralateral homotopic regions (Fang et al., 2008). Furthermore, TMS of right FEF in humans produced an increase in the BOLD response in both right and left FEF during attentional allocation (Heinen et al., 2014). Another possibility is that disruption of FEF affects parietal cortices via intrahemispheric corticocortical fiber tracts (Thiebaut de Schotten et al., 2011), and that interhemispheric dynamics manifest at the level of the parietal and/or occipital cortex via the corpus callosum (Putnam et al., 2010). Altered parietal interhemispheric functional connectivity accompanies spatial hemineglect following right-hemispheric damage to the ventral attention network and is behaviorally relevant (He et al., 2007). On the other hand, dynamic causal modeling evidence of the dorsal attention network in the healthy brain during cued top-down attention favored strong reciprocal coupling between left and right FEF rather than left and right IPS (Vossel et al., 2012).
Although our data do not allow us to disentangle the potential routes mediating the effects of FEF disruption, they do extend previous findings of contralaterality. Resting-state fMRI in humans and monkeys revealed robust FEF functional connectivity with contralateral FEF and IPS (Johnston et al., 2008; Hutchison et al., 2012), which has been observed to break down after corpus callosotomy (Johnston et al., 2008). Also, recent offline TMS-EEG work has suggested tight functional connectivity between FEF and contralateral IPS: inhibitory cTBS of right IPS reduced alpha band coherence of right IPS and left FEF while increasing it for left IPS and right FEFs (Rizk et al., 2013).
Conclusion
Bilateral FEF appear to provide top-down attentional control over modulation of oscillatory activity in the visual system. Both left and right FEF seem to play an important role in the top-down control of contralateral anticipatory alpha power modulation, whereas only the right FEF has an impact on the attentional modulation of mainly left hemispheric stimulus-induced gamma oscillations. The contralaterality of these effects may be best explained in terms of interhemispheric interactions. While our findings corroborate the importance of the FEF for top-down attentional control of posterior alpha and gamma oscillations, the precise network dynamics arising from inter- and intrahemispheric connections within the dorsal attention network are not yet fully understood. Future studies should therefore attempt to more tightly link oscillatory properties of the dorsal attention network to the underlying anatomy, considering both corticocortical (Thiebaut de Schotten et al., 2011) and corticothalamo-cortical connections (Saalmann and Kastner, 2011).
Footnotes
This work was supported by the BrainGain Smart Mix Programme of the Netherlands Ministry of Economic Affairs, a NWO-MaGW VICI Grant 453-09-002) and a NWO-ALW Open competition Grant 822-02-011).
The authors declare no competing financial interests.
References
- Benwell CS, Harvey M, Gardner S, Thut G. Stimulus- and state-dependence of systematic bias in spatial attention: additive effects of stimulus-size and time-on-task. Cortex. 2013;49:827–836. doi: 10.1016/j.cortex.2011.12.007. [DOI] [PubMed] [Google Scholar]
- Bonnefond M, Jensen O. Alpha oscillations serve to protect working memory maintenance against anticipated distracters. Curr Biol. 2012;22:1969–1974. doi: 10.1016/j.cub.2012.08.029. [DOI] [PubMed] [Google Scholar]
- Capotosto P, Babiloni C, Romani GL, Corbetta M. Frontoparietal cortex controls spatial attention through modulation of anticipatory alpha rhythms. J Neurosci. 2009;29:5863–5872. doi: 10.1523/JNEUROSCI.0539-09.2009. [DOI] [PMC free article] [PubMed] [Google Scholar]
- Corbetta M, Shulman GL. Control of goal-directed and stimulus-driven attention in the brain. Nat Rev Neurosci. 2002;3:201–215. doi: 10.1038/nrn755. [DOI] [PubMed] [Google Scholar]
- Duecker F, Formisano E, Sack AT. Hemispheric differences in the voluntary control of spatial attention: direct evidence for a right-hemispheric dominance within frontal cortex. J Cogn Neurosci. 2013;25:1332–1342. doi: 10.1162/jocn_a_00402. [DOI] [PubMed] [Google Scholar]
- Fang PC, Stepniewska I, Kaas JH. Corpus callosum connections of subdivisions of motor and premotor cortex, and frontal eye field in a prosimian primate, Otolemur garnetti. J Comp Neurol. 2008;508:565–578. doi: 10.1002/cne.21706. [DOI] [PubMed] [Google Scholar]
- Fries P, Reynolds JH, Rorie AE, Desimone R. Modulation of oscillatory neuronal synchronization by selective visual attention. Science. 2001;291:1560–1563. doi: 10.1126/science.1055465. [DOI] [PubMed] [Google Scholar]
- Gitelman DR, Nobre AC, Parrish TB, LaBar KS, Kim YH, Meyer JR, Mesulam M. A large-scale distributed network for covert spatial attention: further anatomical delineation based on stringent behavioural and cognitive controls. Brain. 1999;122:1093–1106. doi: 10.1093/brain/122.6.1093. [DOI] [PubMed] [Google Scholar]
- Grosbras MH, Paus T. Transcranial magnetic stimulation of the human frontal eye field facilitates visual awareness. Eur J Neurosci. 2003;18:3121–3126. doi: 10.1111/j.1460-9568.2003.03055.x. [DOI] [PubMed] [Google Scholar]
- Gross J, Kujala J, Hamalainen M, Timmermann L, Schnitzler A, Salmelin R. Dynamic imaging of coherent sources: studying neural interactions in the human brain. Proc Natl Acad Sci U S A. 2001;98:694–699. doi: 10.1073/pnas.98.2.694. [DOI] [PMC free article] [PubMed] [Google Scholar]
- Händel BF, Haarmeier T, Jensen O. Alpha oscillations correlate with the successful inhibition of unattended stimuli. J Cogn Neurosci. 2011;23:2494–2502. doi: 10.1162/jocn.2010.21557. [DOI] [PubMed] [Google Scholar]
- He BJ, Snyder AZ, Vincent JL, Epstein A, Shulman GL, Corbetta M. Breakdown of functional connectivity in frontoparietal networks underlies behavioral deficits in spatial neglect. Neuron. 2007;53:905–918. doi: 10.1016/j.neuron.2007.02.013. [DOI] [PubMed] [Google Scholar]
- Heinen K, Feredoes E, Weiskopf N, Ruff CC, Driver J. Direct evidence for attention-dependent influences of the frontal eye-fields on feature-responsive visual cortex. Cereb Cortex. 2014;24:2815–2821. doi: 10.1093/cercor/bht157. [DOI] [PMC free article] [PubMed] [Google Scholar]
- Hoogenboom N, Schoffelen JM, Oostenveld R, Parkes LM, Fries P. Localizing human visual gamma-band activity in frequency, time and space. Neuroimage. 2006;29:764–773. doi: 10.1016/j.neuroimage.2005.08.043. [DOI] [PubMed] [Google Scholar]
- Huang YZ, Edwards MJ, Rounis E, Bhatia KP, Rothwell JC. Theta burst stimulation of the human motor cortex. Neuron. 2005;45:201–206. doi: 10.1016/j.neuron.2004.12.033. [DOI] [PubMed] [Google Scholar]
- Hubl D, Nyffeler T, Wurtz P, Chaves S, Pflugshaupt T, Lüthi M, von Wartburg R, Wiest R, Dierks T, Strik WK, Hess CW, Müri RM. Time course of blood oxygenation level-dependent signal response after theta burst transcranial magnetic stimulation of the frontal eye field. Neuroscience. 2008;151:921–928. doi: 10.1016/j.neuroscience.2007.10.049. [DOI] [PubMed] [Google Scholar]
- Hung J, Driver J, Walsh V. Visual selection and the human frontal eye fields: effects of frontal transcranial magnetic stimulation on partial report analyzed by Bundesen's theory of visual attention. J Neurosci. 2011;31:15904–15913. doi: 10.1523/JNEUROSCI.2626-11.2011. [DOI] [PMC free article] [PubMed] [Google Scholar]
- Hutchison RM, Gallivan JP, Culham JC, Gati JS, Menon RS, Everling S. Functional connectivity of the frontal eye fields in humans and macaque monkeys investigated with resting-state fMRI. J Neurophysiol. 2012;107:2463–2474. doi: 10.1152/jn.00891.2011. [DOI] [PubMed] [Google Scholar]
- Johnston JM, Vaishnavi SN, Smyth MD, Zhang D, He BJ, Zempel JM, Shimony JS, Snyder AZ, Raichle ME. Loss of resting interhemispheric functional connectivity after complete section of the corpus callosum. J Neurosci. 2008;28:6453–6458. doi: 10.1523/JNEUROSCI.0573-08.2008. [DOI] [PMC free article] [PubMed] [Google Scholar]
- Jung TP, Makeig S, Humphries C, Lee TW, McKeown MJ, Iragui V, Sejnowski TJ. Removing electroencephalographic artifacts by blind source separation. Psychophysiology. 2000;37:163–178. doi: 10.1111/1469-8986.3720163. [DOI] [PubMed] [Google Scholar]
- Kastner S, Ungerleider LG. Mechanisms of visual attention in the human cortex. Annu Rev Neurosci. 2000;23:315–341. doi: 10.1146/annurev.neuro.23.1.315. [DOI] [PubMed] [Google Scholar]
- Kastner S, Pinsk MA, De Weerd P, Desimone R, Ungerleider LG. Increased activity in human visual cortex during directed attention in the absence of visual stimulation. Neuron. 1999;22:751–761. doi: 10.1016/S0896-6273(00)80734-5. [DOI] [PubMed] [Google Scholar]
- Kelly SP, Lalor EC, Reilly RB, Foxe JJ. Increases in alpha oscillatory power reflect an active retinotopic mechanism for distracter suppression during sustained visuospatial attention. J Neurophysiol. 2006;95:3844–3851. doi: 10.1152/jn.01234.2005. [DOI] [PubMed] [Google Scholar]
- Kinsbourne M. Hemi-neglect and hemisphere rivalry. Adv Neurol. 1977;18:41–49. [PubMed] [Google Scholar]
- Knyazeva MG, Kiper DC, Vildavski VY, Despland PA, Maeder-Ingvar M, Innocenti GM. Visual stimulus-dependent changes in interhemispheric EEG coherence in humans. J Neurophysiol. 1999;82:3095–3107. doi: 10.1152/jn.1999.82.6.3095. [DOI] [PubMed] [Google Scholar]
- Mills KR, Boniface SJ, Schubert M. Magnetic brain stimulation with a double coil: the importance of coil orientation. Electroencephalogr Clin Neurophysiol. 1992;85:17–21. doi: 10.1016/0168-5597(92)90096-T. [DOI] [PubMed] [Google Scholar]
- Moore T, Armstrong KM. Selective gating of visual signals by microstimulation of frontal cortex. Nature. 2003;421:370–373. doi: 10.1038/nature01341. [DOI] [PubMed] [Google Scholar]
- Müller MM, Gruber T, Keil A. Modulation of induced gamma band activity in the human EEG by attention and visual information processing. Int J Psychophysiol. 2000;38:283–299. doi: 10.1016/S0167-8760(00)00171-9. [DOI] [PubMed] [Google Scholar]
- Nyffeler T, Wurtz P, Lüscher HR, Hess CW, Senn W, Pflugshaupt T, von Wartburg R, Lüthi M, Müri RM. Repetitive TMS over the human oculomotor cortex: comparison of 1 Hz and theta burst stimulation. Neurosci Lett. 2006;409:57–60. doi: 10.1016/j.neulet.2006.09.011. [DOI] [PubMed] [Google Scholar]
- Oostenveld R, Fries P, Maris E, Schoffelen JM. FieldTrip: open source software for advanced analysis of MEG, EEG, and invasive electrophysiological data. Comput Intell Neurosci. 2011;2011:156869. doi: 10.1155/2011/156869. [DOI] [PMC free article] [PubMed] [Google Scholar]
- O'Shea J, Muggleton NG, Cowey A, Walsh V. Timing of target discrimination in human frontal eye fields. J Cogn Neurosci. 2004;16:1060–1067. doi: 10.1162/0898929041502634. [DOI] [PubMed] [Google Scholar]
- O'Shea J, Johansen-Berg H, Trief D, Göbel S, Rushworth MF. Functionally specific reorganization in human premotor cortex. Neuron. 2007a;54:479–490. doi: 10.1016/j.neuron.2007.04.021. [DOI] [PubMed] [Google Scholar]
- O'Shea J, Sebastian C, Boorman ED, Johansen-Berg H, Rushworth MF. Functional specificity of human premotor-motor cortical interactions during action selection. Eur J Neurosci. 2007b;26:2085–2095. doi: 10.1111/j.1460-9568.2007.05795.x. [DOI] [PubMed] [Google Scholar]
- Payne L, Guillory S, Sekuler R. Attention-modulated alpha-band oscillations protect against intrusion of irrelevant information. J Cogn Neurosci. 2013;25:1463–1476. doi: 10.1162/jocn_a_00395. [DOI] [PMC free article] [PubMed] [Google Scholar]
- Percival DB, Walden AT. Spectral analysis for physical applications: multitaper and conventional univariate techniques. Cambridge, UK: Cambridge UP; 1993. [Google Scholar]
- Poser BA, Versluis MJ, Hoogduin JM, Norris DG. BOLD contrast sensitivity enhancement and artifact reduction with multiecho EPI: parallel-acquired inhomogeneity-desensitized fMRI. Magn Reson Med. 2006;55:1227–1235. doi: 10.1002/mrm.20900. [DOI] [PubMed] [Google Scholar]
- Posner MI. Orienting of attention. Q J Exp Psychol. 1980;32:3–25. doi: 10.1080/00335558008248231. [DOI] [PubMed] [Google Scholar]
- Premereur E, Vanduffel W, Roelfsema PR, Janssen P. Frontal eye field microstimulation induces task-dependent gamma oscillations in the lateral intraparietal area. J Neurophysiol. 2012;108:1392–1402. doi: 10.1152/jn.00323.2012. [DOI] [PMC free article] [PubMed] [Google Scholar]
- Premereur E, Janssen P, Vanduffel W. FEF-microstimulation causes task-dependent modulation of occipital fMRI activity. Neuroimage. 2013;67:42–50. doi: 10.1016/j.neuroimage.2012.11.017. [DOI] [PubMed] [Google Scholar]
- Putnam MC, Steven MS, Doron KW, Riggall AC, Gazzaniga MS. Cortical projection topography of the human splenium: hemispheric asymmetry and individual differences. J Cogn Neurosci. 2010;22:1662–1669. doi: 10.1162/jocn.2009.21290. [DOI] [PubMed] [Google Scholar]
- Rizk S, Ptak R, Nyffeler T, Schnider A, Guggisberg AG. Network mechanisms of responsiveness to continuous theta-burst stimulation. Eur J Neurosci. 2013;38:3230–3238. doi: 10.1111/ejn.12334. [DOI] [PubMed] [Google Scholar]
- Ro T, Farnè A, Chang E. Locating the human frontal eye fields with transcranial magnetic stimulation. J Clin Exp Neuropsychol. 2002;24:930–940. doi: 10.1076/jcen.24.7.930.8385. [DOI] [PubMed] [Google Scholar]
- Rossini PM, Barker AT, Berardelli A, Caramia MD, Caruso G, Cracco RQ, Dimitrijević MR, Hallett M, Katayama Y, Lücking CH, Maertens de Noordhout AL, Marsden CD, Murray NMF, Rothwell JC, Swash M, Tomberg C. Non-invasive electrical and magnetic stimulation of the brain, spinal cord and roots: basic principles and procedures for routine clinical application: report of an IFCN committee. Electroencephalogr Clin Neurophysiol. 1994;91:79–92. doi: 10.1016/0013-4694(94)90029-9. [DOI] [PubMed] [Google Scholar]
- Ruff CC, Blankenburg F, Bjoertomt O, Bestmann S, Freeman E, Haynes JD, Rees G, Josephs O, Deichmann R, Driver J. Concurrent TMS-fMRI and psychophysics reveal frontal influences on human retinotopic visual cortex. Curr Biol. 2006;16:1479–1488. doi: 10.1016/j.cub.2006.06.057. [DOI] [PubMed] [Google Scholar]
- Ruff CC, Blankenburg F, Bjoertomt O, Bestmann S, Weiskopf N, Driver J. Hemispheric differences in frontal and parietal influences on human occipital cortex: direct confirmation with concurrent TMS-fMRI. J Cogn Neurosci. 2009;21:1146–1161. doi: 10.1162/jocn.2009.21097. [DOI] [PMC free article] [PubMed] [Google Scholar]
- Saalmann YB, Kastner S. Cognitive and perceptual functions of the visual thalamus. Neuron. 2011;71:209–223. doi: 10.1016/j.neuron.2011.06.027. [DOI] [PMC free article] [PubMed] [Google Scholar]
- Sauseng P, Feldheim JF, Freunberger R, Hummel FC. Right prefrontal TMS disrupts interregional anticipatory EEG alpha activity during shifting of visuospatial attention. Front Psychol. 2011;2:241. doi: 10.3389/fpsyg.2011.00241. [DOI] [PMC free article] [PubMed] [Google Scholar]
- Siegel M, Donner TH, Oostenveld R, Fries P, Engel AK. Neuronal synchronization along the dorsal visual pathway reflects the focus of spatial attention. Neuron. 2008;60:709–719. doi: 10.1016/j.neuron.2008.09.010. [DOI] [PubMed] [Google Scholar]
- Silvanto J, Lavie N, Walsh V. Stimulation of the human frontal eye fields modulates sensitivity of extrastriate visual cortex. J Neurophysiol. 2006;96:941–945. doi: 10.1152/jn.00015.2006. [DOI] [PubMed] [Google Scholar]
- Sommer MA, Tehovnik EJ. Reversible inactivation of macaque frontal eye field. Exp brain Res. 1997;116:229–249. doi: 10.1007/PL00005752. [DOI] [PubMed] [Google Scholar]
- Stolk A, Todorovic A, Schoffelen JM, Oostenveld R. Online and offline tools for head movement compensation in MEG. Neuroimage. 2013;68:39–48. doi: 10.1016/j.neuroimage.2012.11.047. [DOI] [PubMed] [Google Scholar]
- Szczepanski SM, Konen CS, Kastner S. Mechanisms of spatial attention control in frontal and parietal cortex. J Neurosci. 2010;30:148–160. doi: 10.1523/JNEUROSCI.3862-09.2010. [DOI] [PMC free article] [PubMed] [Google Scholar]
- Szczepanski SM, Pinsk MA, Douglas MM, Kastner S, Saalmann YB. Functional and structural architecture of the human dorsal frontoparietal attention network. Proc Natl Acad Sci U S A. 2013;2013 doi: 10.1073/pnas.1313903110. [DOI] [PMC free article] [PubMed] [Google Scholar]
- Taylor PC, Nobre AC, Rushworth MF. FEF TMS affects visual cortical activity. Cereb Cortex. 2007;17:391–399. doi: 10.1093/cercor/bhj156. [DOI] [PubMed] [Google Scholar]
- Thiebaut de Schotten MT, Dell'Acqua F, Forkel SJ, Simmons A, Vergani F, Murphy DG, Catani M. A lateralized brain network for visuospatial attention. Nat Neurosci. 2011;14:1245–1246. doi: 10.1038/nn.2905. [DOI] [PubMed] [Google Scholar]
- Thut G, Pascual-Leone A. A review of combined TMS-EEG studies to characterize lasting effects of repetitive TMS and assess their usefulness in cognitive and clinical neuroscience. Brain Topogr. 2010;22:219–232. doi: 10.1007/s10548-009-0115-4. [DOI] [PMC free article] [PubMed] [Google Scholar]
- Thut G, Nietzel A, Brandt SA, Pascual-Leone A. α-Band electroencephalographic activity over occipital cortex indexes visuospatial attention bias and predicts visual target detection. J Neurosci. 2006;26:9494–9502. doi: 10.1523/JNEUROSCI.0875-06.2006. [DOI] [PMC free article] [PubMed] [Google Scholar]
- Vossel S, Weidner R, Driver J, Friston KJ, Fink GR. Deconstructing the architecture of dorsal and ventral attention systems with dynamic causal modeling. J Neurosci. 2012;32:10637–10648. doi: 10.1523/JNEUROSCI.0414-12.2012. [DOI] [PMC free article] [PubMed] [Google Scholar]
- Watson AB, Pelli DG. QUEST: a Bayesian adaptive psychometric method. Percept Psychophys. 1983;33:113–120. doi: 10.3758/BF03202828. [DOI] [PubMed] [Google Scholar]
- Worden MS, Foxe JJ, Wang N, Simpson GV. Anticipatory biasing of visuospatial attention indexed by retinotopically specific alpha-band electroencephalography increases over occipital cortex. J Neurosci. 2000;20:RC63. doi: 10.1523/JNEUROSCI.20-06-j0002.2000. [DOI] [PMC free article] [PubMed] [Google Scholar]