

Abstract
The perirhinal cortex (PRC) is reportedly important for object recognition memory, with supporting physiological evidence obtained largely from primate studies. Whether neurons in the rodent PRC also exhibit similar physiological correlates of object recognition, however, remains to be determined. We recorded single units from the PRC in a PRC-dependent, object-cued spatial choice task in which, when cued by an object image, the rat chose the associated spatial target from two identical discs appearing on a touchscreen monitor. The firing rates of PRC neurons were significantly modulated by critical events in the task, such as object sampling and choice response. Neuronal firing in the PRC was correlated primarily with the conjunctive relationships between an object and its associated choice response, although some neurons also responded to the choice response alone. However, we rarely observed a PRC neuron that represented a specific object exclusively regardless of spatial response in rats, although the neurons were influenced by the perceptual ambiguity of the object at the population level. Some PRC neurons fired maximally after a choice response, and this post-choice feedback signal significantly enhanced the neuronal specificity for the choice response in the subsequent trial. Our findings suggest that neurons in the rat PRC may not participate exclusively in object recognition memory but that their activity may be more dynamically modulated in conjunction with other variables, such as choice response and its outcomes.
Keywords: goal-directed task, object association, object recognition memory, perirhinal cortex, spatial memory
Introduction
A theory holds that two functionally distinct information-processing streams exist in the medial temporal lobe: one is specialized in spatial memory and the other in nonspatial memory (Burwell, 2000; Hargreaves et al., 2005; Eichenbaum and Lipton, 2008; Henriksen et al., 2010). According to the theory, spatial information is processed in the postrhinal cortex (POR) and sent to the hippocampus via the medial entorhinal cortex, whereas nonspatial information is conveyed by the perirhinal cortex (PRC) via the lateral entorhinal cortex. In support of this theory, many studies have focused on the nonspatial functions of the PRC, implying a role for the PRC in object recognition memory (Meunier et al., 1993; Ennaceur et al., 1996; Buckley and Gaffan, 1998; Winters and Bussey, 2005) and perhaps also in object perception (Bussey et al., 2002; Lee et al., 2005; Murray et al., 2007; Baxter, 2009).
In apparent support of the above viewpoint, studies have reported single units in the PRC that responded to particular objects in an object recognition memory task in primates (Brown et al., 1987; Miyashita and Chang, 1988; Liu and Richmond, 2000; Naya et al., 2003). However, previous anatomical studies show that the PRC in rodents receives heavy projections from the POR, and the POR reciprocally connects to the medial entorhinal cortex (Burwell and Amaral, 1998; Furtak et al., 2007b). Therefore, the PRC may process some spatial information in rodents (Liu and Bilkey, 1998; Burke et al., 2012). The PRC also receives dense projections from other subcortical structures, including the amygdala, ventral striatum, and ventral tegmental area (Van Hoesen et al., 1981; Pitkanen et al., 2000; Kealy and Commins, 2011). This suggests that reward-related neuromodulatory signals may influence neuronal activity in the PRC (Liu and Richmond, 2000; Liu et al., 2000; Mogami and Tanaka, 2006; Clark et al., 2012; Ohyama et al., 2012). Whether the rodent PRC also exhibits functionally similar physiological properties remains to be determined.
Only a handful of physiological studies have examined the roles of the PRC in object recognition in rodents, although many behavioral studies have explored the impact of perturbations in the PRC (Aggleton et al., 1997; Ennaceur and Aggleton, 1997; Norman and Eacott, 2005). Prior studies examining single-unit activity in the PRC primarily used spontaneous object recognition paradigms (Burke et al., 2012; Deshmukh et al., 2012). In those studies, PRC neurons exhibited poor spatial firing patterns but fired in apparent association with objects by changing firing locations when the objects were moved to different locations. It is possible that these “object fields” (Burke et al., 2012, 2014) may be formed and retrieved through interactions between object and spatial information in the PRC.
In the present study, we recorded single units simultaneously in the PRC while rats performed a paired-associate task between objects and spatial responses. Our study sought to find whether the PRC demonstrated neural correlates for specific objects, as shown in primates, or whether neuronal activity in the PRC was also influenced by other variables, including spatial response and choice outcome.
Materials and Methods
Subjects
Four male rats (Long–Evans) weighing 350–420 g were used. Food availability was controlled to maintain body weight at 85% of the free-feeding weight. The animals were housed individually under a 12 h light/dark cycle, and all experiments were conducted in the light phase of the cycle. All protocols and procedures conformed to the guidelines in the National Institutes of Health's Guide for the Care and Use of Laboratory Animals and those determined by the Institutional Animal Care and Use Committee at the Seoul National University.
Behavioral apparatus
Detailed descriptions of the touchscreen apparatus used in the current study can be found previously (Kim et al., 2012). Briefly, the experimental apparatus consisted of an elevated linear track with a food tray attached at one end. A guillotine door-operated start box was located at the other end of the track. An array of three LCD monitors was installed above the food tray, and the center monitor was equipped with a touchscreen. A transparent acrylic panel with three circular holes was overlaid on the touchscreen monitor to restrict the areas for registering touch responses. Four optic sensors were installed along the track to detect the rat's movements and to control the onset and offset of stimuli on the touchscreen.
Object-cued spatial choice task
Rats (n = 4) were trained in an object-cued spatial choice (OCSC) task in which, once a trial started by the opening of the start box, the rat exited the start box and moved toward the end of the track. When the rat activated a fiber-optic beam sensor installed in front of the monitor at the end of the track, a cueing object (standard object: toy or egg, each occupying a 4 × 6 cm area on the screen) appeared (object sampling in Fig. 1A). All objects were adjusted to equal luminance with the following methods. First, objects were adjusted to have equal average gray values in Photoshop. Then, the luminance of object stimuli was measured (and adjusted until showing equal luminance) in an experimental setup by placing a professional lux meter at a fixed distance from the LCD monitor when each stimulus was displayed on the screen. When the animal touched the object with its snout, the object disappeared, a tone sounded (2.25 kHz, 83 dB), and two identical discs (each with a diameter of 3 cm) appeared on both sides of the previous object's location. The rat was required to touch the disc associated with the previously sampled object to obtain a cereal reward in the food tray. When one of the discs was touched, both discs disappeared and the accuracy of the choice was signaled immediately with auditory feedback (1.5 kHz and 150 Hz for correct and error choices, respectively). When the animal made an error, no reward was provided.
Figure 1.
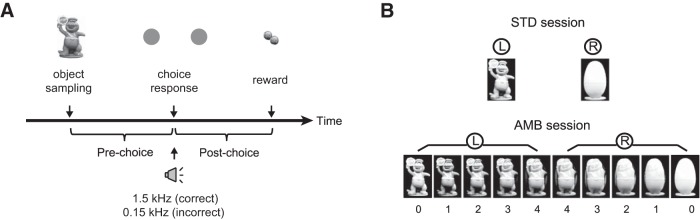
OCSC task. A, Schematic illustration of sequential events in a trial (object sampling, choice response, and reward). Reward was provided only in correct trials. Using the choice moment as a reference, a trial was divided into a pre-choice and a post-choice period. Tones of different frequencies were delivered upon the choice response to offer feedback for the accuracy of the choice. B, Object stimuli used in the task. Two objects (toy and egg) were used for standard object (STD) sessions. L and R indicate the correct disc choices associated with the objects. For ambiguity (AMB) sessions, the two original objects were morphed into one another to yield 10 different objects. Numbers below the images indicate perceptual ambiguity levels (0 to 4 indicating no ambiguity to the highest ambiguity). The rat was required to make a categorical response to the morphed object to obtain a reward on the basis of the learned associations between the original objects and discs.
Once the rats were trained to criterion (i.e., ≥70% correct choices for both objects for two consecutive days) with the standard objects (STD session; Fig. 1B), they underwent hyperdrive implantation surgeries. After recovery from surgery, rats performed STD sessions during the adjustment of electrodes (see below) and were then tested in ambiguity (AMB) sessions in which the standard object images were parametrically morphed into one another using a commercial software product (Morpheus Photo Animator, ACD Systems) to yield 10 different object images, including the standard objects (Fig. 1B). The half of the images that were perceptually closer to the standard toy object shared the reward contingency of the original stimulus, and the same was true for the standard objects in the egg category. Each object appeared 12 times, constituting 120 trials in total per session. The reward contingency for object-disc association was counterbalanced among rats, and the sequence of object stimuli presented across trials was pseudo-randomized.
Hyperdrive implantation
A microdrive array (hyperdrive) composed of 16 tetrodes was used for electrophysiological recordings. Platinum-iridium wires (17.8 μm in diameter) were twisted and heat-bonded to make a tetrode. The final impedance of each wire was adjusted to 150–300 kΩ (measured in gold solution at 1 kHz with an impedance tester). The hyperdrive was implanted in the right hemisphere by using the following target coordinates for tetrodes: 3.8–4.8 mm posterior to bregma, 6.8 mm lateral to midline, 3–4 mm below the skull surface. For placing the hyperdrive as closely as possible to the PRC without damaging unwanted cortical areas, the temporalis muscles on the right side were fully retracted. A hole was drilled on the skull surface, matching the size of the radius of the bundle tip. The drive was lowered down vertically to the target position. The drive was chronically affixed to the skull with eight anchoring screws and bone cement.
Reversible inactivation of the PRC
To test whether the PRC was required in the OCSC task, a separate group of rats (n = 3) was trained in the task with only standard objects (Fig. 1B, STD). After reaching the presurgical performance criterion, animals were implanted bilaterally with guide cannulae (23 G) coupled with stylets protruding 1 mm from the guide cannulae tips at the following coordinates: 4.8 mm posterior to bregma, 7.6 mm lateral to midline, 3.9 mm below the skull surface (tips angled at 10° medially). After recovery from surgery, animals were retrained to criterion and underwent two experimental sessions. On the first day of testing, PBS (phosphate-buffered saline [SAL], 0.5 μl per site) was injected 20 min before testing. On the following day, a GABA-A receptor agonist, muscimol (MUS, 0.5 μg/0.5 μl per site), was injected to temporally inactivate the PRC. Fifty trials were given for all testing sessions. After all behavioral experiments, the cannulae positions and the spread of MUS were verified by examining the diffusion range of fluorescent MUS (BODIPY TMR-X MUS, Invitrogen) under an epifluorescence microscope.
Electrophysiological recording
Neural signals were amplified (1000–10,000 times) and digitized at 32 kHz (filtered at 300–6000 Hz) using a Digital Lynx data acquisition system (Neuralynx). Neural signals were relayed through a slip-ring commutator to the data acquisition system. Information about the animal's position and head direction was detected with LEDs attached to the preamplifier connected to the hyperdrive. The LED signals were captured through a ceiling camera and fed to a frame grabber at 30 Hz. To position the tetrodes at target locations, individual tetrodes were lowered daily by small increments for several days during which time the rats experienced only STD sessions. Once the majority of tetrodes reached the PRC, spiking activities of single units were recorded in AMB sessions for 4–5 d.
Most tetrodes were lowered daily by small increments, and no special attempts were made to hold a single neuron across multiple sessions for the sake of maximizing the number of neurons recorded simultaneously for each day. However, a possibility exists that the same neurons were recorded across several sessions because, occasionally, some tetrodes remained in the same position for days. This issue was examined by comparing the waveform parameters, including spike amplitude (from peak to trough; from peak to baseline), spike width (from peak to trough), and the mean firing rates in every pair of neurons that were recorded from the tetrodes that were not moved across sessions. Among 100 neurons in the PRC that were used in the final analyses (for exhibiting significant modulation in firing in association with critical events in the task), only 13 neurons exhibited minimal differences (i.e., identified in the lower 95% confidence limits) in the above parameter distributions for waveforms, and these neurons might have been the same neurons. None of these neurons was recorded for more than three consecutive sessions.
Unit isolation
Single units (n = 415) were isolated offline using a cluster-cutting method based on various waveform parameters, including peak and energy as previously described (Kim et al., 2011). The following set of criteria was subsequently applied to the clustering-based unit isolation results to finalize the neurons for further analyses: (1) isolation distance (Harris et al., 2001) and L-ratio (Schmitzer-Torbert et al., 2005) with cutoff thresholds set at an isolation distance ≥10 and an L-ratio ≤0.3, and (2) task responsiveness (i.e., the average firing rate from object onset to food-tray access >1 Hz).
Histological verification of electrode position
After the last recording session, small electrical currents (10 μA for 10 s) were passed through individual tetrodes to mark the final tetrode tip locations. Following this, the rat inhaled an overdose of CO2 and was perfused transcardially with 0.1 m PBS solution, followed by 4% v/v formaldehyde solution. The brain was stored in a sucrose-formalin solution at 4°C until it sank to the bottom of the container. The brain was frozen and sectioned at a thickness of 30 μm using a sliding microtome. The brain slices were mounted and stained with thionin for Nissl bodies, and the adjacent sections were stained for myelin with a 0.2% buffered gold chloride solution followed by fixation (5 min) in a 2.5% sodium thiosulfate solution. Photomicrographs were taken, and the positions of individual tetrodes were reconstructed based on the histological data and physiological depth profiles recorded during data acquisition.
Data analysis
Behavioral data analysis.
The performance of each rat was measured by calculating the proportion of correct trials in a session. A bias index for object category was calculated by subtracting the average performance for the egg category from that for the toy category. For each trial, two event epochs were defined using the moment at which a choice response occurred as a reference point, as follows: (1) pre-choice period (from object onset to choice) during which a decision for a choice response was required after sampling an object cue; and (2) post-choice period (from choice to food-tray entry) during which auditory feedback provided the accuracy of the choice, and the rat moved its snout into the food tray (Fig. 1A).
Raster plots.
A raster plot was built by aligning spike timestamps with reference to the timestamp for the choice event (bin size = 50 ms, time window = 4 s before and after choice). Among the cells with mean firing rates exceeding 0.5 Hz in the event period, when the mean firing rate associated with either the pre-choice or post-choice period was significantly different (t test, α = 0.01) from the baseline firing rate (i.e., mean firing rate for the 1 s period before the object cue appeared), the unit was labeled as event-responsive. Trials with missing timestamps or interevent latencies exceeding 2 SDs from the mean session latencies were removed from the analyses.
Task-factor analysis and multicollinearity control.
Neurons that significantly modulated their activity during the task events were further subjected to a two-way ANOVA with the object category (toy and egg) and spatial choice (left and right touch responses) as main factors. If the ANOVA showed significant effects for both factors for a given cell, a multicollinearity problem (i.e., two factors significantly correlated) was suspected, and a control analysis was conducted by determining whether the neuronal firing patterns associated with the correct and error trials were significantly different from each another while holding either the object or the choice factor constant. For example, the trials associated with the toy category were sorted into correct and error trial types (associated with opposite spatial responses), and the firing-rate distributions for the two trial types were compared with one another (t test, α = 0.05). This procedure was repeated for the egg category as well by sorting the same trials accordingly. If the firing-rate distributions associated with the correct and incorrect trials for any object category were significantly different from one another, the significance from the ANOVA for the object factor was rejected, and the neuron was labeled as not showing object selectivity. The same procedure was repeated for the choice factor. These conservative measures conducted in tandem with the ANOVA ensured that only those neurons relatively free from the multicollinearity problem were used for analyses in the current study.
Population rastergram analysis.
For analyzing neuronal firing patterns associated with individual objects at the population level, a population rastergram was constructed for each object stimulus by using all the neurons (n = 64) that were active in the pre-choice period. Each neuron's firing rates in the population rastergram were normalized by the neuron's maximal firing rate, and the individual neuronal rastergrams associated with the STD objects were ordered according to the peak firing locations. The same ordering scheme was used for the AMB objects. The entire population rastergram was then smoothed with a moving average method (window size = 5 bins). Once the population rastergram was constructed (only correct trials were used), the average firing rate for each time bin was calculated (bin size = 200 ms; 12 bins in total based on the mean response latency in the pre-choice period).
Post choice peak-firing latency analysis.
For the PRC neurons that exhibited maximal firing rates during the post-choice period, a trial-by-trial latency of the peak firing was measured separately from the moment of spatial choice and from the food-tray entry event (bin size = 50 ms). The peak-firing rate in a given trial was defined as the firing rate exceeding 2 SDs from the mean firing rate in the 8 s time window centered at the choice event. The trials that did not exhibit a peak based on this criterion and also the cells with peaks emerging outside the post-choice period were excluded from the analyses. The latency histograms were smoothed using a kernel density estimation (σ = 0.18). The median peak locations were averaged and compared using a Wilcoxon signed-rank test (α = 0.05).
Receiver operating characteristic (ROC) analysis and response prediction index (RPI)
The trials were sorted into the following two types based on the choice outcome of the immediately preceding trial: PreT-correct trial (when a correct choice was made in the preceding trial) and PreT-error trial (when an error response was made in the preceding trial). To correct for spurious effects that might arise from different numbers of sample trials in PreT-correct and PreT-error trials, a bootstrapping procedure was conducted by randomly collecting 1000 samples from the Pre-T correct trials and also from the PreT-error trials as well, and by constructing the firing-rate distributions associated with the touch responses for the left and right discs in the pre-choice period for each trial type. An ROC curve was then plotted based on the two distributions. The size of the area under the curve (AUC) was measured in the ROC plot. These steps were repeated for 1000 times to obtain a response prediction index (RPI), and the AUCs were averaged. The resulting RPI quantified the amount of overlap in the two firing-rate distributions associated with the opposite spatial choice responses, with a higher AUC corresponding to a better prediction for an upcoming behavioral choice given the firing rate of a neuron in the pre-choice period in a given trial. One session was eliminated because of a significant response bias, and four units from the session were not used for calculating the RPI. A baseline RPI was computed by averaging the AUCs from 1000 randomly selected trials regardless of trial conditions.
Results
The PRC is required in the OCSC task
In STD sessions, rats made correct choices in ∼80% of the trials, and their performance dropped by ∼10% in AMB sessions (t(3) = 2.62, p = 0.08, t test) (Fig. 2A). In AMB sessions, performance decreased significantly as the level of ambiguity increased (F(4,64) = 29.68, p < 0.0001, repeated-measures ANOVA) (Fig. 2B). When object ambiguity was low or moderate (0–2 in Fig. 2B), rats maintained performance levels similar to those during STD sessions (t values <2.94, p values >0.09, Bonferroni-corrected t test, α = 0.01). By contrast, performance decreased significantly when ambiguity was relatively high (ambiguity levels 3 and 4 in Fig. 2B), compared with that in the STD condition (t values >33.03, p values <0.0001, Bonferroni-corrected t test). Notably, despite the significant decline in performance, rats still performed significantly at above chance level (50%) in the high ambiguity conditions (t values >4.41, p values <0.001, Bonferroni-corrected one-sample t test, one-tailed) (Fig. 2B). On average, we did not observe significant bias in performance toward a particular object category across sessions (H = 1.94, p = 0.75, Kruskal–Wallis test) (Fig. 2C), and no significant improvement in performance was seen across AMB sessions (F(3,9) = 1.93, p = 0.20, repeated-measures ANOVA) (Fig. 2D). It took ∼2.7 s (2.76 ± 0.31 s; mean ± SEM) on average for rats to touch the choice disc in the pre-choice period and ∼1.5 s (1.60 ± 0.11 s; mean ± SEM) to enter the food well from the moment of disc touch in the post-choice period. The latency did not differ across the ambiguity levels (F values <1.75, p values >0.15, repeated-measures ANOVA).
Figure 2.

Behavioral performance. A, Performance during standard (STD) and ambiguity (AMB) sessions. The performance decreased by ∼10% in the AMB sessions compared with the STD sessions. Dotted line indicates presurgical performance criterion for surgery (70%). B, Performance as a function of ambiguity level (0 lowest, 4 highest). The behavioral performance decreased as the ambiguity level increased. The performance significantly decreased in the high ambiguity conditions (level 3–4) compared with the STD session (dotted line). ***p < 0.0001. C, The object-categorical bias indices were averaged across animals and plotted as a function of sessions. Overall, no significant bias was found toward a particular object category in any of the sessions. D, There was no significant effect of learning across sessions in the AMB sessions. Because only one rat performed on day 5, the analysis was conducted on data obtained from days 1–4 only. Data are mean ± SEM.
To determine whether the PRC played critical roles in the current task, we trained a separate group of animals (n = 3) in the STD version of the task and tested in the presence or absence of MUS-induced inactivations in the PRC. According to the histological results, the diffusion of the fluorescent MUS seemed largely located in A36 (Fig. 3A), although one needs to be careful when interpreting the results because the diffusion range of fluorescent MUS might be underestimated compared with that of the standard MUS compound (Allen et al., 2008). Nonetheless, the histological results should not undermine our behavioral findings mainly because visual information is critical in the current task and A36 is known to receive richer visual inputs from upstream visual areas than A35 (Burwell and Amaral, 1998).
Figure 3.
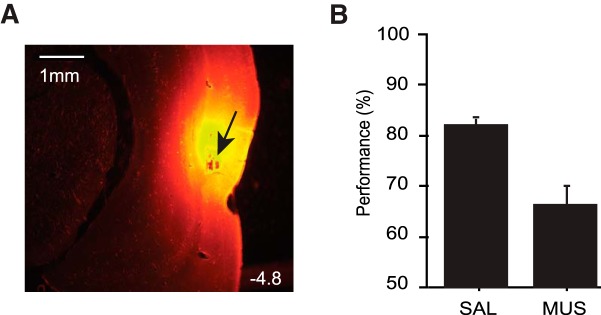
Impairment in performance upon the inactivation of the PRC. A, A representative photomicrograph of tissue injected with fluorescent MUS. Note the localized spread of MUS in the PRC. The number on the right bottom corner indicates the distance (mm) from bregma. B, PRC inactivation affects the performance in the OCSC task compared to the SAL injection condition. Data are mean ± SEM.
A paired t test revealed a significant difference in task performance between SAL and MUS conditions. Rats with SAL injected in the PRC performed well (>80% correct performance), whereas MUS inactivation of the PRC significantly decreased performance compared with that in the SAL condition (t(2) = 4.00, p = 0.05, paired t test) (Fig. 3B). Compared with the baseline (one-sample t test), the performance in the SAL condition was significantly above chance (t(2) = 27.71, p < 0.01), whereas rats performed near at chance level once MUS was injected (t(2) = 3.84, p = 0.06) (Fig. 3B). It is unlikely that nonspecific side effects of MUS caused the performance deficits because response latencies (measured from object onset to choice) in the two drug conditions did not differ significantly (t(2) = −1.29, p = 0.32, paired t test).
Spiking properties of PRC neurons
We recorded the activity of single units in the PRC while rats were tested in AMB sessions. The electrodes covered the dorsoventral extent of the PRC, sampling units from both deep and superficial layers of different subfields (A35 and A36) (Fig. 4A,B). Among the PRC units that were isolated through the cluster-cutting procedure, 111 units survived the quality criteria (see Materials and Methods) and were analyzed further (Fig. 4C; Table 1). The mean firing rate of the units was 4.58 ± 0.41 Hz (mean ± SEM). Units with high firing rates (>10 Hz, n = 10) were eliminated from further analysis (Hargreaves et al., 2005). For the purpose of categorizing putative interneurons and pyramidal neurons, we plotted the spike width (measured between the peak and the trough in the average waveform) against its average firing rate (Fig. 5A). Based on the scatterplot, the cells showing <250 μs (n = 6) in spike width were categorized as putative interneurons, and the remaining neurons were categorized as putative pyramidal neurons (n = 94) (Fig. 5A). Therefore, the majority of neurons used for analyses in the current study were putative pyramidal neurons. The mean spike width of interneurons was 171.88 ± 6.99 μs, and that of the pyramidal neurons was 430.52 ± 8.28 μs (mean ± SEM). The mean firing rates of putative interneurons and pyramidal cells were 1.77 ± 0.30 Hz and 3.64 ± 0.23 Hz (mean ± SEM), respectively. It is notable that all putative interneurons exhibited mean firing rates of <3 Hz, and the results (the absence of high-firing interneurons) are in agreement with the previous report (Deshmukh et al., 2012).
Figure 4.

Histological verification of tetrode positions and the number of neurons recorded from the PRC. A, The histological sections containing the PRC were obtained from an online atlas (http://cmbn-approd01.uio.no/zoomgen/hippocampus/home.do). Using those online images as templates, the locations of individual tetrodes were marked with dots (color-coded for different animals). Regional boundaries of the PRC (solid lines) and its subfields A36 and A35 (dotted lines) were demarcated based on the online atlas and the standard atlas (Paxinos and Watson, 2007). Numbers indicate the relative positions (mm) of the sections from bregma. B, Representative histological sections with tetrode tracks. First and second columns show Nissl-stained tissues. Third column shows myelin-stained sections. C, Pie charts for showing the number of units in different subregions in the PRC. Only units that satisfied the unit-isolation criteria and were used in the final analyses are shown. Top, A35 and A36. Bottom, deep and superficial layers.
Table 1.
The number of perirhinal cortical neurons recorded across daysa
| Rat no. | Region | Layer | Day 1 | Day 2 | Day 3 | Day 4 | Day 5 | Total |
|---|---|---|---|---|---|---|---|---|
| 073 | A35 | Deep | — | — | 0 (1) | — | — | — |
| Superficial | — | — | — | — | — | — | ||
| A36 | Deep | 3 (30) | 1 (20) | 8 (38) | 3 (28) | — | 15 | |
| Superficial | 0 (22) | 2 (13) | 3 (20) | 2 (14) | — | 7 | ||
| 134 | A35 | Deep | — | — | 0 (1) | — | — | — |
| Superficial | 0 (1) | — | — | — | — | — | ||
| A36 | Deep | 7 (20) | 6 (20) | 2 (13) | 7 (14) | — | 22 | |
| Superficial | 1 (8) | 0 (9) | 0 (9) | 1 (8) | — | 2 | ||
| 141 | A35 | Deep | 4 (8) | 3 (7) | 0 (6) | 3 (3) | — | 10 |
| Superficial | — | — | 2 (3) | 1 (2) | — | 3 | ||
| A36 | Deep | 2 (2) | — | 2 (2) | 2 (2) | — | 6 | |
| Superficial | 0 (4) | 1 (4) | 0 (1) | — | — | 1 | ||
| 144 | A35 | Deep | — | — | — | — | — | — |
| Superficial | — | 2 (3) | 1 (5) | 0 (1) | 1 (1) | 4 | ||
| A36 | Deep | 7 (11) | 1 (3) | 5 (9) | 5 (11) | 3 (5) | 21 | |
| Superficial | 2 (5) | 1 (5) | 2 (9) | 3 (9) | 1 (5) | 9 |
aOnly those cells that met the unit-quality criteria are included. The total number of cells is indicated in parentheses.
Figure 5.

Classification of PRC neurons. A, A scattergram showing the relationships between the average firing rate and the average spike width (peak-to-trough) of PRC units recorded in the current study. Vertical dashed line indicates the criterion level of firing (10 Hz). Ten units were eliminated based on the criteria (black circles). Horizontal dashed line indicates the cutoff point of a spike width (250 μs) that separated putative interneurons and pyramidal neurons. B, Representative autocorrelograms (time window = ±500 ms, bin size = 1 ms) drawn for putative interneurons (Int, left) and pyramidal neurons (Pyr, right) in the PRC. Shown on the right of each autocorrelogram is the averaged waveform of a neuron. The mean firing rate and spike width of a neuron were indicated below the waveform. On the basis of the autocorrelogram characteristics, cells were classified into bursting (top), regular (middle), and unclassified (bottom) neurons. C, Pie charts showing the percentage of PRC units categorized into putative interneurons and pyramidal neurons based on the spike width criterion (left), and the percentage of neurons categorized based on autocorrelograms (right). The number in the parentheses indicates the number of units. D, Examples of the autocorrelograms and waveforms of the PRC units excluded from the main analysis due to high firing rates (>10 Hz).
We also examined the firing patterns of the putative interneurons and pyramidal neurons by drawing a spiking autocorrelogram for each unit. Based on the autocorrelograms, cells were grouped into the following three categories (Barthó et al., 2004): (1) bursting neuron, (2) regular spiking neuron, and (3) unclassified neuron. Specifically, the bursting neuron was characterized by a sharp and large peak at 3–6 ms with an exponential decay afterward (Fig. 5B, top). Regular spiking neurons exhibited an exponential rise from 0 to tens of milliseconds, and the maximum bin value was detected at < 35 ms in the autocorrelogram (Fig. 5B, middle). Cells that did not meet any of these criteria were labeled as “unclassified” (Fig. 5B, bottom). Of the PRC units recorded in the current study, 72% were regular spiking neurons and 20% were bursting neurons. The remaining 8% were unclassified neurons (Fig. 5C). We performed the same classification on the units excluded from the main analyses and found that the majority (n = 9) of the units were regular spiking neurons (cells 1–3 in Fig. 5D) and only one unit was categorized as an unclassified neuron (cell 4 in Fig. 5D).
Neural activity in the PRC is strongly modulated by critical events in the OCSC task
We then examined whether neuronal firing in the PRC was significantly modulated by the pre-choice and post-choice events, compared with the neuron's baseline firing rate (i.e., the average firing rate before the object onset). For this purpose, we constructed a perievent rastergram with individual spiking times aligned in reference to the choice moment (Fig. 6). The firing rates in the majority of single units (83%) were significantly changed from the baseline before and/or after the choice response was made. Specifically, some neurons (19%) changed spiking activity significantly only during the pre-choice period by increasing (cells 1 and 2 in Fig. 6A) or decreasing (cells 3 and 4 in Fig. 6A) their firing rates relative to their preobject onset baseline firing rates, and other units (22%) significantly increased or decreased their firing rates after the rat made a choice (post-choice period) (Fig. 6B). The largest proportion of units (59%), however, significantly changed their firing rates from baseline for both pre-choice and post-choice periods (Fig. 6C). With respect to the direction of the firing-rate change, neurons either increased or decreased their firing rates (compared with their baseline), and similar proportions of neurons showed opposite directional changes when the neurons were examined during the pre-choice period or during both the pre-choice and post-choice periods (F values <2.00, p values >0.16, χ2 test) (Table 2). However, those neurons demonstrating significant activity changes during the post-choice period were more likely to show excitatory patterns (72%) than inhibitory patterns (28%), relative to the baseline activity level (F = 7.11, p < 0.01, χ2 test). A few neurons (n = 3) also exhibited mixed patterns, with increased discharge rates in one event period followed by decreased firing patterns in the other period (cell 16 in Fig. 6C; Table 2). Among the excluded neurons (n = 10; Fig. 5A), eight neurons significantly changed their firing rates during the pre-choice period (n = 3), post-choice period (n = 2), or both periods (n = 3).
Figure 6.

Choice event-related neuronal modulations in the PRC. A–C, Raster plots (top) and normalized mean firing rates (bottom) of representative neurons in the PRC showing the firing patterns in the pre-choice and post-choice periods. For each cell, individual spikes were aligned with the occurrence of the choice event. Colored dots in the raster represent the major events of the object-cued spatial choice task: red represents object onset; yellow represents object touch; blue represents food-tray access. Neuronal activity in the PRC was significantly modulated relative to that of the baseline (1 s before the object onset) in the pre-choice period (A), post-choice period (B), or both (C). **p < 0.01. The firing rates associated with the event periods were normalized by subtracting the baseline firing rates.
Table 2.
The number of event-responsive PRC neurons showing different firing patterns
| Event period | Response pattern (from baseline) |
||
|---|---|---|---|
| Excitation | Inhibition | Mixed | |
| Pre-choice | 6 | 10 | — |
| Post-choice* | 13 | 5 | — |
| Pre-choice and post-choice | 26 | 20 | 3 |
*p < 0.01.
Neuronal discharge in the PRC is modulated by both the object cue and its associated response, but not by the object alone
After establishing, as described above, that the majority of PRC neurons (n = 83 of 100) were strongly modulated in association with the choice responses made during the task, we examined whether those units discharged disproportionately in association with critical task demands, such as object identity and spatial choice response. A two-way ANOVA was conducted for each neuron using the object category (toy and egg) and spatial choice (left and right) as factors. However, because these two factors were highly correlated in our study (especially in correct trials), this analysis alone might cause a multicollinearity problem. Therefore, a more conservative approach was adopted in which the ANOVA analyses were examined further by using additional t tests (for details, see Materials and Methods).
To illustrate the relative magnitude of the neuronal responses associated with different trial conditions, we organized the data for each neuron into a bubble chart (Fig. 7A), with the size of each circle indicating the relative response strength of a neuron for a particular object-choice paired association. For example, before the rat made its choice response (pre-choice), cell 1 in Figure 7A discharged more for left choices than for right choices, regardless of the cueing object. However, this neuron responded significantly to the interaction between the object and choice factors in the post-choice period because the cell showed higher firing rates relative to the other conditions when the rat touched the disc located on the right side after sampling the toy object, or when choosing the disc located on the left side after sampling the egg object. Notably, we rarely found a neuron in the PRC that specifically responded only to a particular object during the pre-choice period regardless of spatial choices made (Fig. 7B). Instead, in the pre-choice period, some neurons (27.7%; Fig. 7B) fired specifically for a particular choice response, as illustrated by cell 1 and cell 2 for left and right choices, respectively, in Figure 7A. Other neurons (6%) fired selectively for the interaction between the object and spatial responses. Similarly, in the post-choice period, neurons fired for a particular choice response (18.1%, cell 3 in Fig. 7A) and for the interaction between object and response factors (51.8%, cells 1, 2, and 4–6 in Fig. 7A). The firing rate of only one neuron was significantly modulated by the object factor alone in the post-choice period. Neurons appeared to respond to the choice response factor more in the pre-choice period than in the post-choice period, although no statistical significance was found (F values < 3.60, p values > 0.06, χ2 test). By contrast, significantly more neurons responded to the interaction between the two factors in the post-choice period than in the pre-choice period (F = 42.32, p < 0.0001, χ2 test). For the event-responsive neurons in the excluded neuronal category (n = 8), only one neuron fired differentially for a choice response in the pre-choice period. In the post-choice period, however, some neurons significantly responded to object (n = 1), response (n = 2), and the interaction between object and response (n = 4).
Figure 7.

PRC neurons represent choice response and the object-choice contingency. A, The raster plots were sorted according to four different object-choice contingencies (denoted by the object images and the responses on the left side of the raster plot). Bubble chart below the raster plot represents the relative response strengths of a neuron for different trial conditions. The number in a circle indicates the mean firing rate of the trial condition in which the maximal cell firing of the neuron was observed. The sizes of the other circles are scaled in proportion to the maximal discharge rate. B, Pie charts showing the percentage of neurons in the PRC that respond significantly to the major task-related factors, such as object and spatial response factors, in the pre-choice and post-choice event periods. Numbers in parentheses indicate the number of cells. The proportion of PRC neurons with a significant interaction effect between object and choice response factors significantly increased in the post-choice period compared with the pre-choice period. ***p < 0.0001. n.s., Not significant.
Neuronal population activity in the PRC is influenced by perceptual ambiguity of object
We further investigated whether the level of ambiguity associated with the sample object modulated the activity levels of the response-selective PRC neurons during the pre-choice period by running a two-way ANOVA (α = 0.05) with the ambiguity level and the choice response as main factors. Only a small fraction of neurons (n = 3) showed firing patterns significantly correlated with ambiguity, and no neuron showed a significant interaction between the response and the ambiguity level.
We subsequently examined whether the effect of ambiguity could be observed at the population level by constructing population rastergram associated with each object for the pre-choice period (Fig. 8A; see Materials and Methods). We noted that the similarity in population firing patterns associated with the original STD object became disrupted as the ambiguity level increased for both object categories (Fig. 8A). The similarity between the population rastergrams was measured by calculating a Pearson's correlation coefficient between the STD object (ambiguity level 0) and its associated four AMB objects (ambiguity levels 1–4) (Fig. 8B). There were interesting differences between the two object categories in terms of the changing patterns of the neuronal population across the ambiguity levels. Specifically, the similarity in the population activity decreased gradually for the toy object (Fig. 8B, blue line), whereas the similarity for the egg object decreased abruptly at the ambiguity level 2 and remained at similar levels afterward (Fig. 8B, red line). The correlation coefficients for both object categories then converged to a similar level when the ambiguity levels were maximal.
Figure 8.

Effects of perceptual ambiguity on the response of the PRC neuronal population in the pre-choice period. A, The population rastergram was constructed from all active PRC neurons before the choice event for each object condition (time bin = 200 ms). The temporal bin associated with the highest firing rate was represented by using the lightest color. The cells were ordered according to the maximal firing location in the standard object condition for each object category. The number above each stimulus indicates the level of ambiguity. Vertical dotted line indicates the border between the two object categories. The temporal firing patterns in the neuronal population were disrupted as ambiguity increased in both object categories. B, Pearson's correlation coefficients were calculated between the population rastergram associated with the STD object and each of the four rastergrams associated with its morphed AMB objects (levels 1–4) in each category.
Neuronal firing in the PRC is strongly modulated by choice outcome
As shown above (Fig. 7), many PRC neurons conveyed conjunctive information for the object identity and response, particularly in the post-choice period. We hypothesized that the significant neuronal modulations observed in the post-choice period might be closely related to the outcome of the choice response because auditory feedback was given immediately after a choice was made in our task. However, because the auditory feedback might signal not only the outcome of a choice but also the presence or absence of a reward in the food tray at the same time, we examined whether the post-choice activity in the PRC reflected the choice outcome or the expectation of a reward.
To dissociate the above possibilities, we first selected neurons that exhibited maximal firing rates in the post-choice period (n = 25). The peak firing locations in time in the post-choice period were different among PRC neurons, with some units firing maximally immediately after the choice response (e.g., cell 1 in Fig. 9A) and other cells showing longer peak latencies from the choice moments (cells 2–4 in Fig. 9A). Overall, the peak firing was more closely coupled to the moment of choice response than to the food-tray entry event in the post-choice period (median latency from choice-to-peak firing = 606 ms; median latency from peak firing to food tray entry = 882 ms; Z= −3.00, p < 0.01 in Wilcoxon signed-rank test) (Fig. 9B). It is unlikely that these choice-related firing correlates reflected pure perception of the auditory feedback because prior studies showed that ∼30–40 ms are required for an auditory signal to reach the PRC (Furtak et al., 2007a). The above analysis was performed on correct trials only; however, the peak-firing locations for error trials were similarly coupled to the choice. The latencies from choice to peak firing rates measured after correct choices were not significantly different from those measured after error responses (Z = −1.44, p = 0.15, Mann–Whitney U test) (Fig. 9C). These results indicate that the analyses using the peak-firing locations during the post-choice period were not significantly influenced by behavioral differences associated with correct and error responses. Overall, our results suggest that the significant neural activity observed in the post-choice period in the PRC is more closely related to the choice response itself and to its outcome than to the reward expectation.
Figure 9.
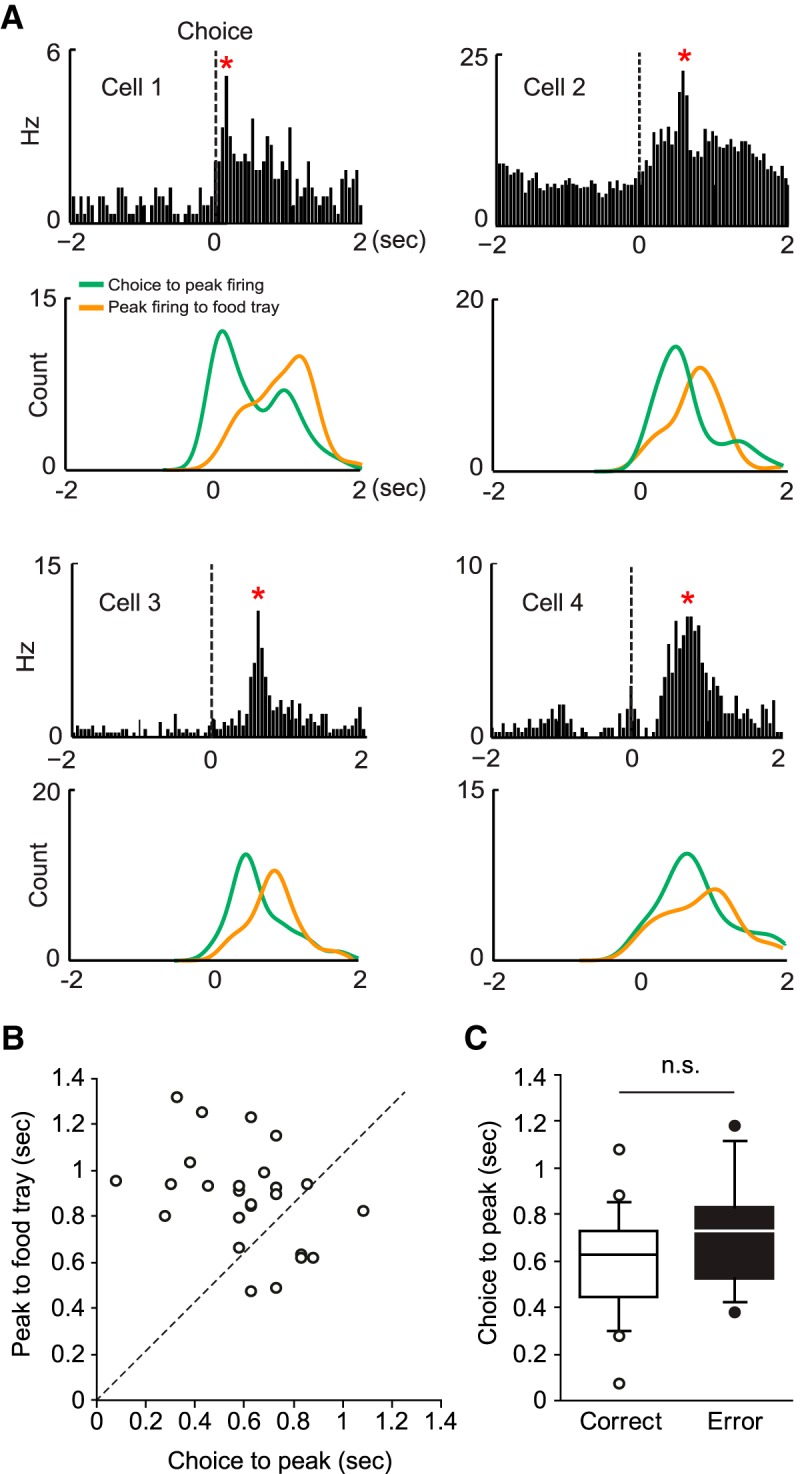
Activity of PRC neurons in the post-choice period conveys trial outcome-related signals. A, The firing-rate distribution of a neuron in the PRC is shown (top) 2 s before and after the choice responses (dashed line). *Time bin in which the maximal firing rate was observed. Shown below is the histogram of the latency from the choice response to the peak-firing rate (green) and of the latency from peak firing to the food-tray entry (orange). Four representative neurons were chosen to show that the post-choice firing peaks were more closely related to the choice responses than to the food-tray entries. B, The distribution of the medians of the temporal locations of the firing peaks with reference to the time points associated with the two events (choice response to peak firing and peak firing to food-tray access), illustrated in a scatter plot. The PRC units fired maximally closer to the choice event (x-axis) than to the food-tray entry event (y-axis). Dashed line indicates the points where the peak-firing location maintains equal distances from the two events. C, Similar choice-to-peak latencies were observed in cells showing a peak firing following a correct response and those following an error. n.s., Not significant.
Pre-choice neuronal activity predicts the upcoming choice better in the PRC with the presence of error-driven feedback signal in the preceding trial
The significant neural activity observed after the choice response (Fig. 9) may function as a feedback signal for the outcome of that choice, which may, in turn, influence the animal's choice response in the next trial. Similar feedback signals have been reported in other brain areas, including the prefrontal cortex (PFC), striatum, hippocampus, and orbitofrontal cortex (Kepecs et al., 2008; Narayanan and Laubach, 2008; Histed et al., 2009; Wirth et al., 2009; Narayanan et al., 2013), but, to our knowledge, not in the PRC. To test whether cells in the PRC also exhibit similar properties, we categorized the post-choice outcome-selective neurons (n = 43) into two subtypes based on their activity profiles: correct-up cells and error-up cells (Wirth et al., 2009). The correct-up cells increased their firing rates following correct choices (n = 21), and the error-up cells did so following error responses (n = 22) (Fig. 10A). There was no proportional difference between two categories (F = 0.05, p = 0.83, χ2 test).
Figure 10.

Error choice-related feedback signal in the post-choice period significantly affects the upcoming choice-related signals in the PRC. A, Representative examples of the spike density plots of the correct-up cells (left) and error-up cells (right) in the PRC. The correct-up cells exhibited an elevated firing response when correct choices were made compared with when errors were made, whereas the opposite was true for the error-up cells. B, Representative ROC curves for the two types of outcome-selective neurons (correct-up and error-up cells). ROC curves were generated based on the firing-rate distributions associated with the choice responses (choices for the left and right discs). Each point of the ROC curve indicates the probability of neuronal spiking activity in a given trial being correctly assigned to one of the choice distributions (“hits”) versus incorrectly assigned (“false alarms”). For the correct-up cells, the AUCs of the ROC curves were similar regardless of the presence of the neuronal feedback received from the previous trial. By contrast, the AUC of the error-up cells was higher when feedback was received from the previous trial. C, The RPI was obtained for each outcome-selective neuron by averaging across the bootstrapped AUCs (1000 iterations). In the correct-up cells, the RPI was similar regardless of whether the choice in the previous trial was correct (PreT-correct) or incorrect (PreT-error). In the error-up neurons, the RPI was higher in trials for which the previous choices resulted in errors (PreT-error). *p < 0.05.
By using the ROC methods (see Materials and Methods), we then investigated whether the neuronal activity in the pre-choice period in a given trial was a better predictor of the upcoming choice response when such activity was followed by significant neural activity in the post-choice period of the preceding trial. When ROC curves were plotted for correct-up cells and error-up cells, we noted that the cells in the error-up category seemingly predicted the upcoming choice response better (i.e., larger AUC) when an error-related feedback signal was present in the post-choice period in the preceding trial (PreT error in Fig. 10B), compared with when a correct choice-related feedback signal was present (PreT correct). The cells in the correct-up category did not show such properties (Fig. 10B).
To further quantify the above observations, we estimated the capability of predicting the choice response in the upcoming trial given the neuronal activity in the pre-choice period by calculating RPI (see Materials and Methods). In correct-up cells, the RPIs between the two trial types (i.e., trials following correct and error responses, denoted by PreT correct and PreT error, respectively, in Fig. 10C) were not significantly different from one another (Z = −0.88, p = 0.37, Wilcoxon signed-rank test), suggesting that the neural feedback in the post-choice period after correct choices (in correct-up cells) did not significantly influence the choice response in the next trial. The significant enhancement in the predictability of the upcoming response in the error-up neurons was observed only when the error was made in the immediately preceding trial (i.e., trial lag 1); that is, when the trial lag was increased to two or three, the RPI was not significantly different regardless of the outcome of those trials (Z > − 1.06, p values >0.28, Wilcoxon signed-rank test).
However, in the error-up neurons, the RPI was significantly higher for trials when the previous choices resulted in errors compared with trials having preceding trials associated with correct responses (Z = −2.17, p < 0.05, Wilcoxon signed-rank test) (Fig. 10C). Higher RPIs in the PreT-error trials for the error-up neurons were observed in the majority of animals (3 of 4 rats). The RPIs for the trials following the error-related feedback signals were also significantly higher than the baseline RPI obtained from 1000 randomly shuffled trials (Z = −2.17, p <0.05) in the error-up neurons, whereas no significant difference was found in the trials that were not associated with the feedback signals when tested using the same procedures (Z = −0.38, p = 0.70, Wilcoxon signed-rank test) (Fig. 10C). For the correct-up neurons, both the RPIs from PreT-correct and PreT-error trials were not significantly different from the shuffled baseline (Z values > −1.72, p values >0.08, Wilcoxon signed-rank test) (Fig. 10C). These results suggest that the neural activity in the PRC in the pre-choice period was significantly influenced by the error-driven feedback signal from the immediately preceding trial.
Discussion
In the current study, rats discriminated the 2D object images successfully, and the inactivation of the PRC impaired performance. PRC neurons fired specifically for particular spatial responses, often in conjunction with the cueing object, but the exclusive object-specific firing was rarely observed. The effect of perceptual ambiguity was minimal at the single-cell level but was visible at the population level. Many PRC neurons conveyed information about choice outcome, and we found that the error-driven post-choice neuronal feedback in a given trial increased the neuronal selectivity for the choice response during the pre-choice period in the following trial.
The PRC has been viewed as an area critical for object recognition memory (Meunier et al., 1993; Ennaceur et al., 1996; Buckley and Gaffan, 1998; Winters and Bussey, 2005). However, PRC neurons rarely signaled object-specific information before making a choice in our study, and the results appear incompatible with the primate literature (Brown et al., 1987; Miyashita and Chang, 1988; Liu and Richmond, 2000; Naya et al., 2003). Although most prior primate studies recorded neurons from a broadly defined inferotemporal cortex, including the PRC, TE, and entorhinal cortex, and thus more focused investigations on specific regions are needed in the future, we may speculate on why an object-specific signal was not observed in the current study. First, it may simply be attributable to species-specific differences. Sensory and perceptual systems (especially the visual system) might be different between rodents and primates. For example, object recognition signals in the rodent brain may be identified at earlier processing stages (e.g., TE). One may also need to consider, however, that behavioral paradigms were also very different between primate and rodent studies. Specifically, the above-mentioned primate studies used a head-fixed design, and choices were made by a saccadic eye movement or a bar release (Miyashita and Chang, 1988; Liu and Richmond, 2000; Naya et al., 2003), whereas rodents are usually freely moving during testing.
Sensory dimensions associated with an object might also be critical in determining the involvement of the PRC during object recognition memory. In most rodent studies, spontaneous object-recognition tasks were used in which rats were allowed to explore 3D objects, presumably using multimodal sensory information (Burke et al., 2012, 2014; Deshmukh et al., 2012). A recent study reports a lack of repetition-induced response decrement in human visual association areas when 3D objects were introduced as stimuli instead of 2D images (Snow et al., 2011), and this may also be the case in animals. The rodent PRC may be attuned to multimodal object information to integrate sensory inputs from multimodal systems (Burwell and Amaral, 1998; Kealy and Commins, 2011). These possibilities may need to be examined in future studies.
Another possibility is that PRC neurons may require an explicit delay between object sampling and choice to exhibit object-specific firing patterns. Prior physiological studies using primates used delayed matching or nonmatching tasks in which a sample and a test stimulus were presented across an explicit delay (Brown et al., 1987; Miyashita and Chang, 1988; Liu and Richmond, 2000; Naya et al., 2003).
In the current study, the task required object information to be immediately translated into an appropriate spatial response for making a behavioral choice. Given such task demands, it should be critical for both nonspatial and spatial information to be conjunctively processed, possibly making communication between the PRC and POR crucial. According to a theory of the spatial versus nonspatial information pathways in the medial temporal lobe, the PRC is primarily concerned with nonspatial information, such as object information, whereas the POR is more involved in processing spatial information (Burwell, 2000; Hargreaves et al., 2005; Eichenbaum and Lipton, 2008; Henriksen et al., 2010; Lee and Lee, 2013). The results of our study, as well as those of several previous studies, do not fit to such a simplified view. For example, a recent study (Furtak et al., 2012) showed that single units in the POR conveyed conjunctive information for both object and place. Other studies also found that PRC neurons exhibited location-specific responses in association with objects (Burke et al., 2012; Deshmukh et al., 2012).
Some of the recent theories position the PRC at the final stage of visual perception in the ventral visual pathway (Bussey et al., 2005; Cowell et al., 2010), especially when individual features between objects overlap (Bussey et al., 2002; Lee et al., 2005; Murray et al., 2007; Baxter, 2009). The literature shows mixed results for the involvement of the rodent PRC in ambiguous object recognition. Some studies reported significant deficits (Eacott et al., 2001; Norman and Eacott, 2004; Bartko et al., 2007), whereas the opposite results were also reported (Clark et al., 2011). It is important to note that the supporting evidence for the perceptual roles of the PRC was obtained mostly from behavioral studies using a concurrent object discrimination paradigm, but direct physiological evidence for the hypothesized role of PRC has been lacking. In our study, the effect of object ambiguity was visible at the neuronal population level, but not at the individual neuronal level, and the results may provide a first physiological hint that the neuronal population in the PRC may be involved in resolving ambiguity in object stimuli.
The ambiguity levels for two object categories affected the PRC population responses differentially (Fig. 8B). That is, a close examination of the individual stimuli along the morphing continuum indicates that, for the toy object, the morphing procedure influenced mostly the outer shape of the original stimulus, rendering more “egg-like” shapes for the AMB objects, whereas the detailed within-object features were preserved across the morphing levels (Fig. 1B). By contrast, for the egg object category, the contours of the morphed egg objects were largely preserved, but the within-object features associated with the toy object became suddenly visible (against white background) even at the lower level of ambiguity (Fig. 1B). The PRC neuronal population maintained STD object-related signal relatively better in the toy object category than in the egg object category. The results suggest that detailed visual features of an object provide more information to the PRC than the shape and contour of the object.
There was a significant, outcome-dependent modulation of PRC neuronal activity immediately after the rat made a choice response in our study. The increase in neuronal response might function as feedback for choice. Similar neurons have been documented in other brain regions, including the PFC, striatum (Histed et al., 2009), and hippocampus (Wirth et al., 2009) in primates, and the orbitofrontal cortex in rodents (Kepecs et al., 2008). In the Histed et al. (2009) study, for example, neurons in the PFC and the striatum increased direction-selective responses following correct trials in monkeys. Similarly, Wirth et al. (2009) demonstrated that primate hippocampal neurons with increased activity following correct trials (correct-up cells) displayed a stronger stimulus-selective response that paralleled learning in an object-place associative task (Wirth et al., 2009). Similar observations were also made in the dorsomedial PFC in rats (Narayanan and Laubach, 2008) and the medial PFC in rats and humans (Narayanan et al., 2013); Narayanan and Laubach (2008) reported that the neuronal firing patterns in the dorsomedial PFC were significantly modulated following errors in a simple reaction-time task. Narayanan et al. (2013) also found that low-frequency oscillations within the area increased in both humans and rats specifically after errors were made.
The results of our study bear some similarity with the results of the prior studies because the neural feedback signals in the PRC were driven more by errors than by correct responses made during the preceding trials. Such error-driven signals may be attributable to the strong interconnections between the PRC and the amygdala (Pitkanen et al., 2000; Kajiwara et al., 2003; Perugini et al., 2012). Neurons in the amygdala increase activity in anticipation of an aversive outcome (Schoenbaum et al., 1998). Similarly, in humans, the amygdala is more engaged when declarative memory encoding is motivated by a threat of punishment than by an incentive (Murty et al., 2012). The interactions between the amygdala and the rhinal cortical regions are also facilitated when facing emotionally arousing stimuli, and the amygdala may provide a strong feedback to the PRC once an error choice is made (Liu et al., 2000; Paz et al., 2006). Such negative feedback signal may strengthen the correct connections between objects and responses, and weaken the incorrect object–response connections in the PRC. The feedback-driven modulation following correct responses in our study might stem from dense dopaminergic projections to the PRC from subcortical regions, including the ventral tegmental area, ventral striatum, and substantia nigra (Schultz et al., 1993; Schultz, 1998; Li et al., 2003).
Our study suggests that the roles of the PRC may go beyond simply representing object memory in rodents, especially when a rat is required to make choices between different responses after recognizing an object. The PRC may provide a neural space in which a variety of object-associated variables (e.g., emotional significance, motivational feedback, response requirement) are represented dynamically according to task demands.
Footnotes
This work was supported by the National Research Foundation Grants BK21+ program 5286-2014100 and SRC 2010-0027941, Brain Research Program Grants NRF-2013M3C7A1044017 and 2013R1A1A2062882, WCU Program Grant R32-10142, and National Institute of Mental Health Grant RO1 MH079971.
The authors declare no competing financial interests.
References
- Aggleton JP, Keen S, Warburton EC, Bussey TJ. Extensive cytotoxic lesions involving both the rhinal cortices and area TE impair recognition but spare spatial alternation in the rat. Brain Res Bull. 1997;43:279–287. doi: 10.1016/S0361-9230(97)00007-5. [DOI] [PubMed] [Google Scholar]
- Allen TA, Narayanan NS, Kholodar-Smith DB, Zhao Y, Laubach M, Brown TH. Imaging the spread of reversible brain inactivations using fluorescent muscimol. J Neurosci Methods. 2008;171:30–38. doi: 10.1016/j.jneumeth.2008.01.033. [DOI] [PMC free article] [PubMed] [Google Scholar]
- Barthó P, Hirase H, Monconduit L, Zugaro M, Harris KD, Buzsáki G. Characterization of neocortical principal cells and interneurons by network interactions and extracellular features. J Neurophysiol. 2004;92:600–608. doi: 10.1152/jn.01170.2003. [DOI] [PubMed] [Google Scholar]
- Bartko SJ, Winters BD, Cowell RA, Saksida LM, Bussey TJ. Perceptual functions of perirhinal cortex in rats: zero-delay object recognition and simultaneous oddity discriminations. J Neurosci. 2007;27:2548–2559. doi: 10.1523/JNEUROSCI.5171-06.2007. [DOI] [PMC free article] [PubMed] [Google Scholar]
- Baxter MG. Involvement of medial temporal lobe structures in memory and perception. Neuron. 2009;61:667–677. doi: 10.1016/j.neuron.2009.02.007. [DOI] [PubMed] [Google Scholar]
- Brown MW, Wilson FA, Riches IP. Neuronal evidence that inferomedial temporal cortex is more important than hippocampus in certain processes underlying recognition memory. Brain Res. 1987;409:158–162. doi: 10.1016/0006-8993(87)90753-0. [DOI] [PubMed] [Google Scholar]
- Buckley MJ, Gaffan D. Perirhinal cortex ablation impairs visual object identification. J Neurosci. 1998;18:2268–2275. doi: 10.1523/JNEUROSCI.18-06-02268.1998. [DOI] [PMC free article] [PubMed] [Google Scholar]
- Burke SN, Maurer AP, Hartzell AL, Nematollahi S, Uprety A, Wallace JL, Barnes CA. Representation of three-dimensional objects by the rat perirhinal cortex. Hippocampus. 2012;22:2032–2044. doi: 10.1002/hipo.22060. [DOI] [PMC free article] [PubMed] [Google Scholar]
- Burke SN, Maurer AP, Nematollahi S, Uprety A, Wallace JL, Barnes CA. Advanced age dissociates dual functions of the perirhinal cortex. J Neurosci. 2014;34:467–480. doi: 10.1523/JNEUROSCI.2875-13.2014. [DOI] [PMC free article] [PubMed] [Google Scholar]
- Burwell RD. The parahippocampal region: corticocortical connectivity. Ann N Y Acad Sci. 2000;911:25–42. doi: 10.1111/j.1749-6632.2000.tb06717.x. [DOI] [PubMed] [Google Scholar]
- Burwell RD, Amaral DG. Perirhinal and postrhinal cortices of the rat: interconnectivity and connections with the entorhinal cortex. J Comp Neurol. 1998;391:293–321. doi: 10.1002/(SICI)1096-9861(19980216)391:3<293::AID-CNE2>3.0.CO;2-X. [DOI] [PubMed] [Google Scholar]
- Bussey TJ, Saksida LM, Murray EA. Perirhinal cortex resolves feature ambiguity in complex visual discriminations. Eur J Neurosci. 2002;15:365–374. doi: 10.1046/j.0953-816x.2001.01851.x. [DOI] [PubMed] [Google Scholar]
- Bussey TJ, Saksida LM, Murray EA. The perceptual-mnemonic/feature conjunction model of perirhinal cortex function. Q J Exp Psychol B. 2005;58:269–282. doi: 10.1080/02724990544000004. [DOI] [PubMed] [Google Scholar]
- Clark AM, Bouret S, Young AM, Richmond BJ. Intersection of reward and memory in monkey rhinal cortex. J Neurosci. 2012;32:6869–6877. doi: 10.1523/JNEUROSCI.0887-12.2012. [DOI] [PMC free article] [PubMed] [Google Scholar]
- Clark RE, Reinagel P, Broadbent NJ, Flister ED, Squire LR. Intact performance on feature-ambiguous discriminations in rats with lesions of the perirhinal cortex. Neuron. 2011;70:132–140. doi: 10.1016/j.neuron.2011.03.007. [DOI] [PMC free article] [PubMed] [Google Scholar]
- Cowell RA, Bussey TJ, Saksida LM. Functional dissociations within the ventral object processing pathway: cognitive modules or a hierarchical continuum? J Cogn Neurosci. 2010;22:2460–2479. doi: 10.1162/jocn.2009.21373. [DOI] [PubMed] [Google Scholar]
- Deshmukh SS, Johnson JL, Knierim JJ. Perirhinal cortex represents nonspatial, but not spatial, information in rats foraging in the presence of objects: comparison with lateral entorhinal cortex. Hippocampus. 2012;22:2045–2058. doi: 10.1002/hipo.22046. [DOI] [PMC free article] [PubMed] [Google Scholar]
- Eacott MJ, Machin PE, Gaffan EA. Elemental and configural visual discrimination learning following lesions to perirhinal cortex in the rat. Behav Brain Res. 2001;124:55–70. doi: 10.1016/S0166-4328(01)00234-0. [DOI] [PubMed] [Google Scholar]
- Eichenbaum H, Lipton PA. Towards a functional organization of the medial temporal lobe memory system: role of the parahippocampal and medial entorhinal cortical areas. Hippocampus. 2008;18:1314–1324. doi: 10.1002/hipo.20500. [DOI] [PMC free article] [PubMed] [Google Scholar]
- Ennaceur A, Aggleton JP. The effects of neurotoxic lesions of the perirhinal cortex combined to fornix transection on object recognition memory in the rat. Behav Brain Res. 1997;88:181–193. doi: 10.1016/S0166-4328(97)02297-3. [DOI] [PubMed] [Google Scholar]
- Ennaceur A, Neave N, Aggleton JP. Neurotoxic lesions of the perirhinal cortex do not mimic the behavioural effects of fornix transection in the rat. Behav Brain Res. 1996;80:9–25. doi: 10.1016/0166-4328(96)00006-X. [DOI] [PubMed] [Google Scholar]
- Furtak SC, Allen TA, Brown TH. Single-unit firing in rat perirhinal cortex caused by fear conditioning to arbitrary and ecological stimuli. J Neurosci. 2007a;27:12277–12291. doi: 10.1523/JNEUROSCI.1653-07.2007. [DOI] [PMC free article] [PubMed] [Google Scholar]
- Furtak SC, Wei SM, Agster KL, Burwell RD. Functional neuroanatomy of the parahippocampal region in the rat: the perirhinal and postrhinal cortices. Hippocampus. 2007b;17:709–722. doi: 10.1002/hipo.20314. [DOI] [PubMed] [Google Scholar]
- Furtak SC, Ahmed OJ, Burwell RD. Single neuron activity and theta modulation in postrhinal cortex during visual object discrimination. Neuron. 2012;76:976–988. doi: 10.1016/j.neuron.2012.10.039. [DOI] [PMC free article] [PubMed] [Google Scholar]
- Hargreaves EL, Rao G, Lee I, Knierim JJ. Major dissociation between medial and lateral entorhinal input to dorsal hippocampus. Science. 2005;308:1792–1794. doi: 10.1126/science.1110449. [DOI] [PubMed] [Google Scholar]
- Harris KD, Hirase H, Leinekugel X, Henze DA, Buzsáki G. Temporal interaction between single spikes and complex spike bursts in hippocampal pyramidal cells. Neuron. 2001;32:141–149. doi: 10.1016/S0896-6273(01)00447-0. [DOI] [PubMed] [Google Scholar]
- Henriksen EJ, Colgin LL, Barnes CA, Witter MP, Moser MB, Moser EI. Spatial representation along the proximodistal axis of CA1. Neuron. 2010;68:127–137. doi: 10.1016/j.neuron.2010.08.042. [DOI] [PMC free article] [PubMed] [Google Scholar]
- Histed MH, Pasupathy A, Miller EK. Learning substrates in the primate prefrontal cortex and striatum: sustained activity related to successful actions. Neuron. 2009;63:244–253. doi: 10.1016/j.neuron.2009.06.019. [DOI] [PMC free article] [PubMed] [Google Scholar]
- Kajiwara R, Takashima I, Mimura Y, Witter MP, Iijima T. Amygdala input promotes spread of excitatory neural activity from perirhinal cortex to the entorhinal-hippocampal circuit. J Neurophysiol. 2003;89:2176–2184. doi: 10.1152/jn.01033.2002. [DOI] [PubMed] [Google Scholar]
- Kealy J, Commins S. The rat perirhinal cortex: a review of anatomy, physiology, plasticity, and function. Prog Neurobiol. 2011;93:522–548. doi: 10.1016/j.pneurobio.2011.03.002. [DOI] [PubMed] [Google Scholar]
- Kepecs A, Uchida N, Zariwala HA, Mainen ZF. Neural correlates, computation and behavioural impact of decision confidence. Nature. 2008;455:227–231. doi: 10.1038/nature07200. [DOI] [PubMed] [Google Scholar]
- Kim J, Delcasso S, Lee I. Neural correlates of object-in-place learning in hippocampus and prefrontal cortex. J Neurosci. 2011;31:16991–17006. doi: 10.1523/JNEUROSCI.2859-11.2011. [DOI] [PMC free article] [PubMed] [Google Scholar]
- Kim S, Lee J, Lee I. The hippocampus is required for visually cued contextual response selection, but not for visual discrimination of contexts. Front Behav Neurosci. 2012;6:66. doi: 10.3389/fnbeh.2012.00066. [DOI] [PMC free article] [PubMed] [Google Scholar]
- Lee AC, Bussey TJ, Murray EA, Saksida LM, Epstein RA, Kapur N, Hodges JR, Graham KS. Perceptual deficits in amnesia: challenging the medial temporal lobe ‘mnemonic’ view. Neuropsychologia. 2005;43:1–11. doi: 10.1016/j.neuropsychologia.2004.07.017. [DOI] [PubMed] [Google Scholar]
- Lee I, Lee SH. Putting an object in context and acting on it: neural mechanisms of goal-directed response to contextual object. Rev Neurosci. 2013;24:27–49. doi: 10.1515/revneuro-2012-0073. [DOI] [PubMed] [Google Scholar]
- Li S, Cullen WK, Anwyl R, Rowan MJ. Dopamine-dependent facilitation of LTP induction in hippocampal CA1 by exposure to spatial novelty. Nat Neurosci. 2003;6:526–531. doi: 10.1038/nn1049. [DOI] [PubMed] [Google Scholar]
- Liu P, Bilkey DK. Excitotoxic lesions centered on perirhinal cortex produce delay-dependent deficits in a test of spatial memory. Behav Neurosci. 1998;112:512–524. doi: 10.1037/0735-7044.112.3.512. [DOI] [PubMed] [Google Scholar]
- Liu Z, Richmond BJ. Response differences in monkey TE and perirhinal cortex: stimulus association related to reward schedules. J Neurophysiol. 2000;83:1677–1692. doi: 10.1152/jn.2000.83.3.1677. [DOI] [PubMed] [Google Scholar]
- Liu Z, Murray EA, Richmond BJ. Learning motivational significance of visual cues for reward schedules requires rhinal cortex. Nat Neurosci. 2000;3:1307–1315. doi: 10.1038/81841. [DOI] [PubMed] [Google Scholar]
- Meunier M, Bachevalier J, Mishkin M, Murray EA. Effects on visual recognition of combined and separate ablations of the entorhinal and perirhinal cortex in rhesus monkeys. J Neurosci. 1993;13:5418–5432. doi: 10.1523/JNEUROSCI.13-12-05418.1993. [DOI] [PMC free article] [PubMed] [Google Scholar]
- Miyashita Y, Chang HS. Neuronal correlate of pictorial short-term memory in the primate temporal cortex. Nature. 1988;331:68–70. doi: 10.1038/331068a0. [DOI] [PubMed] [Google Scholar]
- Mogami T, Tanaka K. Reward association affects neuronal responses to visual stimuli in macaque te and perirhinal cortices. J Neurosci. 2006;26:6761–6770. doi: 10.1523/JNEUROSCI.4924-05.2006. [DOI] [PMC free article] [PubMed] [Google Scholar]
- Murray EA, Bussey TJ, Saksida LM. Visual perception and memory: a new view of medial temporal lobe function in primates and rodents. Annu Rev Neurosci. 2007;30:99–122. doi: 10.1146/annurev.neuro.29.051605.113046. [DOI] [PubMed] [Google Scholar]
- Murty VP, Labar KS, Adcock RA. Threat of punishment motivates memory encoding via amygdala, not midbrain, interactions with the medial temporal lobe. J Neurosci. 2012;32:8969–8976. doi: 10.1523/JNEUROSCI.0094-12.2012. [DOI] [PMC free article] [PubMed] [Google Scholar]
- Narayanan NS, Laubach M. Neuronal correlates of post-error slowing in the rat dorsomedial prefrontal cortex. J Neurophysiol. 2008;100:520–525. doi: 10.1152/jn.00035.2008. [DOI] [PMC free article] [PubMed] [Google Scholar]
- Narayanan NS, Cavanagh JF, Frank MJ, Laubach M. Common medial frontal mechanisms of adaptive control in humans and rodents. Nat Neurosci. 2013;16:1888–1895. doi: 10.1038/nn.3549. [DOI] [PMC free article] [PubMed] [Google Scholar]
- Naya Y, Yoshida M, Miyashita Y. Forward processing of long-term associative memory in monkey inferotemporal cortex. J Neurosci. 2003;23:2861–2871. doi: 10.1523/JNEUROSCI.23-07-02861.2003. [DOI] [PMC free article] [PubMed] [Google Scholar]
- Norman G, Eacott MJ. Impaired object recognition with increasing levels of feature ambiguity in rats with perirhinal cortex lesions. Behav Brain Res. 2004;148:79–91. doi: 10.1016/S0166-4328(03)00176-1. [DOI] [PubMed] [Google Scholar]
- Norman G, Eacott MJ. Dissociable effects of lesions to the perirhinal cortex and the postrhinal cortex on memory for context and objects in rats. Behav Neurosci. 2005;119:557–566. doi: 10.1037/0735-7044.119.2.557. [DOI] [PubMed] [Google Scholar]
- Ohyama K, Sugase-Miyamoto Y, Matsumoto N, Shidara M, Sato C. Stimulus-related activity during conditional associations in monkey perirhinal cortex neurons depends on upcoming reward outcome. J Neurosci. 2012;32:17407–17419. doi: 10.1523/JNEUROSCI.2878-12.2012. [DOI] [PMC free article] [PubMed] [Google Scholar]
- Paxinos G, Watson C. The rat brain in stereotaxic coordinates. Ed 6. Amsterdam: Academic/Elsevier; 2007. [Google Scholar]
- Paz R, Pelletier JG, Bauer EP, Paré Dp. Emotional enhancement of memory via amygdala-driven facilitation of rhinal interactions. Nat Neurosci. 2006;9:1321–1329. doi: 10.1038/nn1771. [DOI] [PubMed] [Google Scholar]
- Perugini A, Laing M, Berretta N, Aicardi G, Bashir ZI. Synaptic plasticity from amygdala to perirhinal cortex: a possible mechanism for emotional enhancement of visual recognition memory? Eur J Neurosci. 2012;36:2421–2427. doi: 10.1111/j.1460-9568.2012.08146.x. [DOI] [PubMed] [Google Scholar]
- Pitkanen A, Pikkarainen M, Nurminen N, Ylinen A. Reciprocal connections between the amygdala and the hippocampal formation, perirhinal cortex, and postrhinal cortex in rat: a review. Parahippocampal Region. 2000;911:369–391. doi: 10.1111/j.1749-6632.2000.tb06738.x. [DOI] [PubMed] [Google Scholar]
- Schmitzer-Torbert N, Jackson J, Henze D, Harris K, Redish AD. Quantitative measures of cluster quality for use in extracellular recordings. Neuroscience. 2005;131:1–11. doi: 10.1016/j.neuroscience.2004.09.066. [DOI] [PubMed] [Google Scholar]
- Schoenbaum G, Chiba AA, Gallagher M. Orbitofrontal cortex and basolateral amygdala encode expected outcomes during learning. Nat Neurosci. 1998;1:155–159. doi: 10.1038/407. [DOI] [PubMed] [Google Scholar]
- Schultz W. Predictive reward signal of dopamine neurons. J Neurophysiol. 1998;80:1–27. doi: 10.1152/jn.1998.80.1.1. [DOI] [PubMed] [Google Scholar]
- Schultz W, Apicella P, Ljungberg T. Responses of monkey dopamine neurons to reward and conditioned-stimuli during successive steps of learning a delayed-response task. J Neurosci. 1993;13:900–913. doi: 10.1523/JNEUROSCI.13-03-00900.1993. [DOI] [PMC free article] [PubMed] [Google Scholar]
- Snow JC, Pettypiece CE, McAdam TD, McLean AD, Stroman PW, Goodale MA, Culham JC. Bringing the real world into the fMRI scanner: repetition effects for pictures versus real objects. Sci Rep. 2011;1:130. doi: 10.1038/srep00130. [DOI] [PMC free article] [PubMed] [Google Scholar]
- Van Hoesen GW, Yeterian EH, Lavizzo-Mourey R. Widespread corticostriate projections from temporal cortex of the rhesus monkey. J Comp Neurol. 1981;199:205–219. doi: 10.1002/cne.901990205. [DOI] [PubMed] [Google Scholar]
- Winters BD, Bussey TJ. Glutamate receptors in perirhinal cortex mediate encoding, retrieval, and consolidation of object recognition memory. J Neurosci. 2005;25:4243–4251. doi: 10.1523/JNEUROSCI.0480-05.2005. [DOI] [PMC free article] [PubMed] [Google Scholar]
- Wirth S, Avsar E, Chiu CC, Sharma V, Smith AC, Brown E, Suzuki WA. Trial outcome and associative learning signals in the monkey hippocampus. Neuron. 2009;61:930–940. doi: 10.1016/j.neuron.2009.01.012. [DOI] [PMC free article] [PubMed] [Google Scholar]