

Abstract
As humans age, a characteristic pattern of widespread neocortical dendritic disruption coupled with compensatory effects in hippocampus and other subcortical structures is shown in postmortem investigations. It is now possible to address age-related effects on gray matter (GM) neuritic organization and density in humans using multishell diffusion-weighted MRI and the neurite-orientation dispersion and density imaging (NODDI) model. In 45 healthy individuals across the adult lifespan (21–84 years), we used a multishell diffusion imaging and the NODDI model to assess the intraneurite volume fraction and neurite orientation-dispersion index (ODI) in GM tissues. We also determined the functional correlates of variations in GM microstructure by obtaining resting-state fMRI and behavioral data. We found a significant age-related deficit in neocortical ODI (most prominently in frontoparietal regions), whereas increased ODI was observed in hippocampus and cerebellum with advancing age. Neocortical ODI outperformed cortical thickness and white matter fractional anisotropy for the prediction of chronological age in the same individuals. Higher GM ODI sampled from resting-state networks with known age-related susceptibility (default mode and visual association networks) was associated with increased functional connectivity of these networks, whereas the task-positive networks tended to show no association or even decreased connectivity. Frontal pole ODI mediated the negative relationship of age with executive function, whereas hippocampal ODI mediated the positive relationship of age with executive function. Our in vivo findings align very closely with the postmortem data and provide evidence for vulnerability and compensatory neural mechanisms of aging in GM microstructure that have functional and cognitive impact in vivo.
Keywords: cognitive aging, diffusion-weighted MRI, GBSS, gray matter, neurite orientation dispersion, structure–function relationship
Introduction
Dendrites are key sites for synaptic integration and neuronal connectivity in the brain (Spruston, 2008). Postmortem studies have demonstrated that morphological alterations in dendritic structures are hallmarks of aging in gray matter (GM) (Dickstein et al., 2013) characterized by reduced complexity and regression of the dendritic tree in the neocortex (de Brabander et al., 1998; Duan et al., 2003). In contrast, dendritic growth and increased dendritic complexity occur within paleocortex (parahippocampal gyrus) and archicortex (hippocampus) in successful human aging (Buell and Coleman, 1979; Flood et al., 1985) and senescent animals (Pyapali and Turner, 1996).
GM structure has been extensively assessed in vivo at a macroscopic scale. However, in humans, the evaluation of GM microstructure, and dendritic organization in particular, is typically limited to postmortem tissue. These studies are generally confounded by progressive alterations that occur during the postmortem interval before tissue fixation (Penzes et al., 2011). In addition, postmortem studies typically obviate any possibility of meaningfully studying structure–function relationships.
Recent advances in diffusion-weighted MRI have opened new vistas to examine brain tissue microstructure in vivo (Assaf et al., 2013). These techniques use the diffusion properties of water molecules to estimate underlying cellular microstructural properties of brain tissue in the context of specific biophysical models. Neurite-orientation dispersion and density imaging (NODDI) is a recently proposed model that extends application of diffusion imaging from white matter (WM) to the GM tissue microstructure (Zhang et al., 2012). NODDI indexes neuritic density and dispersion of neurites in the brain tissue with intraneurite volume fraction (νIN) and orientation dispersion index (ODI), respectively. These indices can be used to assess dendritic organization in vivo (Jespersen et al., 2007; Zhang et al., 2012). Others have attempted to investigate different aspects of GM microstructure using myelin mapping (Glasser and Van Essen, 2011; Grydeland et al., 2013) and diffusion tensor imaging (DTI) (Ball et al., 2013; Pereira et al., 2014) and, more recently, NODDI indices (Winston et al., 2014). However, the NODDI model (unlike DTI) fully accounts for effects of free-water contamination, which is of particular relevance in aging (Rathi et al., 2014).
As a primary aim, we sought to investigate regional patterns of GM microstructure in healthy humans across the adult life. We adopted a GM-based spatial statistics (GBSS) approach (Ball et al., 2013) for voxelwise analysis of NODDI-derived indices within the GM, including enhanced registration steps and customization to take full advantage of the NODDI model. We hypothesized that consistent with the postmortem data neocortical vulnerability and compensatory effects in hippocampal GM microstructure would be observed. In addition, recent evidence suggests that there is a close coupling between dendritic activity and blood-oxygen-level-dependent signal variation (Viswanathan and Freeman, 2007). Many studies find effects of age in brain networks using resting-state functional connectivity; however, whereas certain networks show age-related differences more often than others, there is no established consensus regarding the network or networks that are consistently affected (Ferreira and Busatto, 2013). Therefore, we also aimed to uncover the functional consequences of age-related GM microstructural variation using fMRI approaches as well as assessment of cognitive performance in the same individuals.
Materials and Methods
Participants.
Forty-five healthy participants across the adult lifespan (21–84 years of age; female/male: 24/21) were recruited at the Centre for Addiction and Mental Health (CAMH) in Toronto, Canada via referrals, study registries, and advertisements. All participants completed the Structured Clinical Interview for DSM-IV Disorders, the Mini-Mental Status Examination, and a urine toxicology screen. Exclusion criteria were any history of a mental disorder (including a dementia, current substance abuse, or a lifetime substance dependence, except for simple phobias); positive urine toxicology, a first-degree relative with a history of psychotic mental disorder, a history of head trauma with loss of consciousness, seizure, or another neurological disorder. Participants were characterized with the Wechsler Test for Adult Reading (WTAR); Edinburgh handedness inventory (Oldfield, 1971); Hollingshead index; Clinical Illness Rating Scale for Geriatrics (CIRS-G) (Miller et al., 1992); weight, height, and blood pressure (Table 1). The study was approved by the Research Ethics Board of CAMH and all participants provided written informed consent.
Table 1.
Demographic characteristics of participants (n = 45)
| Age (y), range | 53.9 (18), 21–84 |
| Sex (F/M) | 24/21 |
| Handedness (R/L) | 43/2 |
| Education (y) | 15.5 (2.4) |
| WTAR IQ | 118.2 (7.7) |
| MMSE | 29.3 (1.0) |
| Diastolic BP (mmHg) | 74.7 (9.6) |
| Systolic BP (mmHg) | 122.4 (15.8) |
| BMI | 26.2 (5.8) |
| CIRS-G (ratio score) | 1.61 (0.58) |
MMSE, Mini-Mental State Examination; BP, blood pressure; BMI, body mass index. Data are presented as mean (SD).
All participants underwent a battery of cognitive testing. Raw cognitive scores were converted to z-scores. Performance in working memory/processing speed was computed as the average of standardized scores from: Stroop ratio index (ratio of color–word time score to color time score; Trenerry et al., 1989), Trail-Making Test B (Reitan and Wolfson, 1985), and the Letter-Number Sequencing Test (Wechsler, 1997).
Imaging protocol.
Diffusion, structural, and functional images were acquired for all participants on a 3 T Discovery MR750 system (General Electric) equipped with an 8-channel head coil. High-resolution T1-weighted anatomical images were acquired using a 3D inversion-prepared fast spoiled gradient-recalled echo acquisition, FSPGR-BRAVO (TE/TR = 3/6.7 ms) with an isotropic voxel size of 0.9 × 0.9 × 0.9 mm3. For the diffusion imaging, a multishell protocol was acquired along 30 noncollinear directions at 3 b-values (1000, 3000, 4500 s/mm2) in addition to 15 interspersed b = 0 images using a single-shot echoplanar sequence. To increase the signal-to-noise ratio, the high b-value images (b = 4500 s/mm2) were acquired with NEX = 2. The acquisition parameters were as follows: TE/TR = 108/12,000 ms, voxel dimension of 2 × 2 × 2 mm3, 82 slices. Resting-state functional scans were acquired using an axial spiral fMRI acquisition with the following parameters: TE/TR = 30/2000 ms, 210 volumes, voxel dimension of 3.4 × 3.4 × 5 mm3, 31 slices. During the resting-state fMRI, participants were requested to close their eyes and let their mind wander.
Diffusion MRI processing.
Eddy current-induced distortions and motion-related misalignment of diffusion images were corrected using FMRIB's Software Library (FSL) version 5.0.6 (Jenkinson et al., 2012). After brain extraction (Smith, 2002), the diffusion tensor model was fitted in each voxel using the dtifit function to estimate fractional anisotropy (FA) maps.
In the NODDI model, three microstructural environments are distinguished (intracellular, extracellular, and CSF compartments; Zhang et al., 2012). The intracellular component models dendrites and axons as a set of sticks with restricted diffusion perpendicular to neurite axes and unhindered diffusion along them (Sotiropoulos et al., 2012). NODDI adopts the Watson distribution to model distribution of these sticks (neurites), which permits modeling of highly dispersed neuritic structures such as dendritic trees in the GM tissue (Zhang et al., 2012). NODDI generates five independent parametric maps, three of which were used in this study: (1) ODI, which is the dispersion coefficient of the sticks (neurites) and ranges from 0 for no dispersion to 1 for fully dispersed; (2) νIN, which indexes the fraction of tissue volume restricted within neurites, (3) fraction of CSF (fCSF), which indexes percentage of the volume in each voxel that is occupied by free water. The NODDI model was fitted using the NODDI toolbox (https://www.nitrc.org/projects/noddi_toolbox/) in the MATLAB environment.
GM-based spatial statistics.
We adopted GM-based spatial statistics (GBSS) methodology (Ball et al., 2013) to investigate effects of age on GM in a voxelwise fashion. As discussed below, the registration steps were enhanced and customized to exploit the potential of the NODDI modeling. The processing pipeline is summarized in Figure 1. As in other voxel-based approaches, accurate cross-subject alignment of anatomically related regions is of paramount importance. This issue is even more critical with diffusion imaging analysis of the cortical regions (cerebellar and cerebral cortex), given the relatively thin cortical structures and sensitivity of diffusion metrics to partial volume contamination (Koo et al., 2009). To overcome these caveats, GBSS adapts the tract-based spatial statistics (TBSS) (Smith et al., 2006) framework for GM analysis by skeletonizing the GM and projecting diffusion metrics (e.g., FA) from the most probable local GM voxel on to the skeleton for group comparison.
Figure 1.

Overview of the pipeline proposed in this study. A, Diffusion image processing steps. FA maps were created by fitting the DTI model (orange box); the CSF fraction, ODI, and neurite density (νIN) images were generated by applying the NODDI model to the diffusion images (green boxes). WM and GM fraction were estimated indirectly. Finally, images with a pseudo-T1 contrast were generated for registration steps. B, Registration and skeletonization of GM. A norm-template was created by iterative nonlinear registration of pseudo-T1 images.
Unlike the original GBSS pipeline, in which tissue classification takes place in the structural images (Ball et al., 2013), we directly segmented brain tissues using the diffusion data as follows: (1) CSF partial volume in each voxel was directly estimated using the NODDI model parameter, fCSF (Zhang et al., 2012); (2) WM segmentation was performed on the FA images using Atropos (Avants et al., 2011a) for two class classification (WM/non-WM) to derive fraction of WM (fWM) (it has been previously shown that FA images can be used to robustly classify WM tissue; Liu et al., 2007; Kumazawa et al., 2010); and (3) fraction of GM (fGM) in each voxel was determined by simply subtracting fractions of CSF and WM from 1 as follows:
Diffusion parameter maps do not have sufficient gray/white/CSF contrast to allow for accurate registration of cortical GM. Therefore, we generated maps with a contrast similar to T1 images (pseudo-T1 images) by multiplying partial volume estimations of each tissue class by their corresponding contrast (contrasts for CSF = 0, GM = 1, WM = 2). For groupwise nonlinear registration, we used the buildtemplateparallel.sh script in the ANTS software package version 1.9 (Avants et al., 2011b), which has recently been shown to significantly improve registration of diffusion images (Schwarz et al., 2014). Aligned GM probability maps were averaged across individuals and thinned (skeletonized) so that the skeleton represents the center of highly probable GM voxels. Each subject's (aligned) ODI, νIN, and fGM image were then projected onto the skeleton. This is achieved, for each skeleton voxel, by searching perpendicular to the skeleton structure for the most probable local GM voxel (Ball et al., 2013). Only voxels with fGM >0.7 in >75% of the subjects were retained in the skeleton. The remaining voxels with nonsatisfactory fGM <0.7 were excluded from the analysis using the setup_masks script, implemented in FSL.
Region of interest analysis.
Lobar (frontal, occipital, parietal, temporal), striatal, and cerebellar regions of interest (ROIs) from the MNI atlas, along with hippocampal mask from the Harvard Oxford subcortical atlas (http://fsl.fmrib.ox.ac.uk/fsl/fslwiki/Atlases) were transformed to individual diffusion spaces by applying inverse warp fields generated during ANTS nonlinear registration step. The fGM images in the diffusion native space were thresholded at 0.7 and binarized. The resulting GM masks were multiplied by the transformed ROIs. Finally, average ODIs were extracted separately from each ROI.
To control for the effects of cortical thickness and subcortical volume, cortical surface reconstruction, cortical thickness measurement, and subcortical segmentation were performed on structural T1 images using the FreeSurfer toolkit version 5.1 (Dale et al., 1999; Fischl and Dale, 2000; Fischl, 2012). Average lobar cortical thickness and subcortical volume were recorded for each individual.
For WM analysis, all FA images were nonlinearly transformed to the MNI space and then averaged to create the mean FA map. Next, a skeletonization procedure was applied to the resulting mean FA image (Smith et al., 2006). Non-WM voxels were discarded from the skeleton by thresholding the skeletonized mean FA (FA >0.2) (Smith et al., 2006). To account for residual misalignments and to facilitate groupwise comparison, each individual's FA image was searched orthogonal to the skeleton to find the local maxima. These local maxima were then projected back onto the skeleton. Finally, average FA was extracted from each skeletonized lobar ROI.
Resting-state fMRI analysis.
Functional image preprocessing and analysis were conducted using FSL version 5.0.6 (Jenkinson et al., 2012). Functional data preprocessing included: discarding the first 5 volumes, motion correction with MCFLIRT, brain extraction using BET (Smith, 2002), spatial smoothing with a Gaussian kernel (σ = 4 mm), and high-pass temporal filter with a 100 s cutoff. fMRI volumes were linearly registered to the individual's structural scan and nonlinearly transformed to the MNI space images using FNIRT. Next, functional images were denoised using FMRIB's independent component analysis (ICA)-based Xnoiseifier (FIX) version 1.0.6 (Griffanti et al., 2014; Salimi-Khorshidi et al., 2014). This algorithm provides an automatic solution for denoising fMRI data via accurate classification of components derived from ICA (Salimi-Khorshidi et al., 2014). Each individual's preprocessed functional volumes were submitted to single-session ICA using FSL MELODIC version 3.14 (Beckmann and Smith, 2004; Beckmann et al., 2005). The FIX algorithm was trained using a library of noise components (manually classified in 10 randomly selected subjects). Finally, the entire functional dataset was denoised by automatically classifying artifactual components.
For voxelwise comparisons of resting-state functional connectivity among subjects, we used the “dual regression” approach implemented in FSL (Filippini et al., 2009). Denoised functional data containing 205 time points for each subject were temporally concatenated across subjects. The resulting 4D dataset was submitted to groupwise ICA (http://fsl.fmrib.ox.ac.uk/fsl/fslwiki/MELODIC) with a dimensionality of 25. The components that corresponded to previously described functional networks that involve neocortical regions were selected for further analysis (Smith et al., 2009). Six resting-state networks were identified. These included the primary visual network (corresponding to components 120 and 220 of 20-dimensional ICA resting-fMRI components available on http://www.fmrib.ox.ac.uk/analysis/brainmap+rsns), visual association network (corresponding to component 320), default mode (DMN, corresponding to component 420), sensorimotor network (corresponding to component 620), right frontotemporal network (corresponding to component 920), and left frontotemporal network (corresponding to component 1020) (Smith et al., 2009). Next, temporal dynamics for each independent component for each individual subject was determined using spatial regression. Finally, using temporal regression, the resulting time courses were regressed into the same 4D dataset to get a subject-specific set of spatial connectivity maps.
For each of these networks, average neocortical ODI was extracted using a similar approach as described above for ROI analyses. Resting-state networks were thresholded at z > 3, binarized, nonlinearly transformed to the diffusion space, and multiplied by the cortical mask derived from the Harvard-Oxford atlas.
Statistical analyses.
Cross-subject voxelwise analyses were performed nonparametrically using Randomise (part of FSL, 5000 permutation; Nichols and Holmes, 2002) to test the effects of age independent of sex on GM microstructure (GBSS), the effects of ODI extracted from resting-state networks on functional connectivity of the corresponding network while controlling for effects of age and sex (dual regression), and the effects of age on functional connectivity of each resting-state network while controlling for sex (dual regression). Threshold-free cluster enhancement was used to provide brain-wide significance without defining an arbitrary cluster-forming threshold (Smith and Nichols, 2009). A familywise error (FWE)-corrected p (pFWE) <0.05 was considered significant for GBSS. For dual regression analyses, statistical thresholds were determined by application of Bonferroni correction for 6 resting-state networks, where pFWE <0.0083 (0.05/6) was considered significant.
To investigate the effect of age on regional ODI, ROI analyses were performed using general linear models in the R version 3.0.2 environment. To further evaluate the nonlinear effects of aging on ODI values extracted from cortical (frontal, occipital, parietal, and temporal lobe GM) and subcortical (cerebellum, hippocampus, and striatum) ROIs, regression with a restricted cubic spline function was conducted (rms package implemented in R). Statistical thresholds were determined by application of Bonferroni correction for 7 ROIs at which p < 0.0071 (0.05/7) was considered significant. To determine how well neocortical microstructure (ODI) predicts chronological age compared with the macrostructural properties of these structures (average cortical thickness) and lobar mean FA, root mean squared error (RMSE) and R2 of the respective models were compared.
Effects of regional ODI (extracted from 48 cortical regions using Harvard-Oxford cortical atlas) on cognitive function were interrogated using stepwise forward-regression analysis, whereas accounting for effects of age and sex. Assuming that regional ODI would serve as mediators between age and cognitive performance, we conducted bootstrapping tests for mediation analysis, using the Preacher and Hayes (2008) SPSS macro with 5000 samples in the SPSS version 21.0 environment (Preacher and Hayes, 2008). This approach yields β regression values for the indirect effect estimates and the corresponding 95% accelerated and bias-corrected confidence intervals (mediation effect is considered significant if the interval does not include 0).
Results
Aging pattern of GM microstructure
In a sample of 45 healthy subjects across the adult lifespan (21–84 years of age; female/male: 24/21; Table 1), we found a widespread decrease in the neocortical-ODI (pFWE <0.05) with advancing age. In contrast, only voxels in the cerebellar crus I/II demonstrated a significant age-related increase in ODI (Fig. 2, Table 2). No significant age-related difference was observed for GM νIN. When we repeated the analysis using different fGM thresholds (fGM > 0.65 and fGM > 0.75), similar patterns of lower neocortical ODI and higher cerebellar ODI were observed with older age (data not shown).
Figure 2.
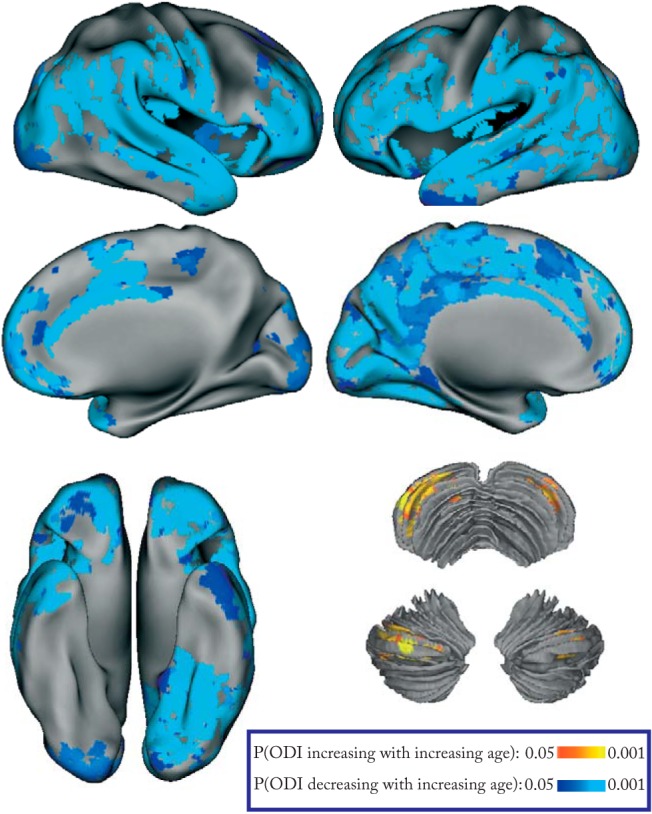
Effects of aging on regional GM microstructure. GBSS results demonstrating significant (pFWE <0.05) ODI reduction with advancing age throughout neocortex and increased ODI in cerebellar lobule-VIIA.
Table 2.
MNI coordinates, volume, and cortical regions of GM clusters from GBSS analysis demonstrating significant (pFWE<0.05) effect of age on GM ODI
| Cluster | Volume (mm3) | Minimum p-value | MNI coordinates |
Hemisphere | Brain regions | ||
|---|---|---|---|---|---|---|---|
| X | Y | Z | |||||
| ODI increase with age | |||||||
| A1 | 1087 | 0.005 | 36 | −71 | −38 | Right | Crus I, Crus II |
| A2 | 303 | 0.015 | −29 | −74 | −38 | Left | Crus I, Crus II |
| ODI decline with age | |||||||
| B1 | 6111 | 0.003 | 43 | 50 | −12 | Right | FPo, ACC, MFG, SFG |
| B2 | 4984 | 0.004 | −1 | 4 | 35 | Left | Precuneus, PCC, ACC, PoCG, PreCG |
| B3 | 7599 | 0.003 | 56 | −62 | −5 | Right | LOC, SMG, MTG, STG, PoCG, COC |
| B4 | 2768 | 0.003 | 42 | 5 | −43 | Right | TPo, MTG |
| B5 | 10669 | 0.003 | −39 | 48 | −13 | Left | SFG, MFG, IFG, OFC, FPo |
| B6 | 7828 | 0.003 | −41 | −73 | −17 | Left | LOC, SMG, AG, Fus |
| B7 | 2174 | 0.003 | −41 | 3 | −23 | Left | TPo, MTG |
ACC, anterior cingulate cortex; AG, angular gyrus; COC, central opercular cortex; OFC, orbitofrontal cortex; FPo, frontal pole; Fus, fusiform gyrus; IFG, inferior frontal gyrus; LOC, lateral occipital cortex; MedFC, medial frontal cortex; MTG, middle temporal gyrus; PoCG, postcentral gyrus; PreCG, precentral gyrus; PCC, posterior cingulate cortex; SMG, supramarginal gyrus; SFG, superior frontal gyrus; STG, superior temporal gyrus.
ROI analysis (Fig. 3) revealed significant linear decline with advancing age for frontal ODI (t = −6.41, p = 1.04 × 10⁻⁷), occipital ODI (t = −5.66, p = 1.23 × 10⁻⁶), parietal ODI (t = −8.31, p = 2.09 × 10⁻¹⁰), and temporal ODI (t = −4.39 p = 7.51 × 10⁻⁵), whereas a similar trend, albeit nonsignificant after multiple-comparison correction, was also found for striatum (t = −2.56, p = 0.014). In contrast, a significant linear age-related increase in cerebellar (t = 3.25, p = 0.0022) and hippocampal-ODI (t = 2.25, p = 0.0071) was observed. In addition, hippocampal ODI demonstrated a significant nonlinear relationship with age (nonlinear term: p = 0.006). These effects remained stable after inclusion of cortical thickness/subcortical volume measurements in the model (frontal lobe: p = 1.86 × 10⁻⁵, occipital lobe: p = 1.2 × 10⁻⁵, parietal lobe: p = 2.20 × 10⁻⁸, temporal lobe: p = 0.0018, hippocampus nonlinear effect: 0.008, and cerebellum: p = 0.034). A more detailed analysis using 48 cortical ROIs revealed that ODI extracted from a majority of cortical regions (27 of 48) showed a significant decline with advancing age (p < 0.001, after correction for multiple comparisons). A similar trend was observed in 10 additional cortical regions (p < 0.05).
Figure 3.

Cortical (A) and subcortical (B) ROI analysis demonstrating significant age effects on regional ODI. A nonlinear fit for the hippocampal ODI–age relationship is shown given its significant nonlinear relationship with age.
Hippocampal ODI and cerebellar ODI showed negative correlation (p < 0.05) with hippocampal and cerebellar volumes, respectively, whereas frontal ODI and parietal ODI demonstrated a positive correlation with frontal and parietal cortical thickness measurements, respectively (p < 0.05). However, these apparently significant correlations disappeared after controlling for the effects of age.
Prediction of chronological age
The best prediction performance of chronological age was for the parietal ODI (R2 = 0.63, RMSE = 10.8y) followed by frontal ODI (R2 = 0.51, RMSE = 12.5 y). For each lobar ROI, mean GM ODI consistently outperformed other measures of brain structure, namely the mean cortical thickness measurements and lobar WM fractional anisotropy for the prediction of chronological age (Table 3).
Table 3.
RMSE and R2 of mean GM ODI, mean cortical thickness, and mean WM FA predicting chronological age
| Lobar region | Mean GM ODI (R2, RMSE) | Mean cortical thickness (R2, RMSE) | Mean WM FA (R2, RMSE) |
|---|---|---|---|
| Frontal lobe | 0.51, 12.5 y | 0.34, 14.4 y | 0.18, 16.1 y |
| Occipital lobe | 0.45, 13.2 y | 0.16, 16.2 y | 0.13, 16.6 y |
| Parietal lobe | 0.63, 10.8 y | 0.19, 16.0 y | 0.12, 16.6 y |
| Temporal lobe | 0.33, 14.5 y | 0.17, 16.2 y | 0.15, 16.4 y |
GM microstructure in relation to brain resting-state functional connectivity
In the same participants, we evaluated the effects of average GM-ODI extracted from neocortical regions of resting-state networks on the brain-wide functional connectivity of these networks, whereas controlling for age and sex. From the group ICA, 6 of the 25 components (DMN, visual association, primary visual, sensorimotor, and left/right frontotemporal networks) were visually identified as corresponding to previously described functional networks that predominantly involve neocortical regions (Smith et al., 2009). A significant positive relationship between mean GM ODI extracted from the DMN and functional connectivity (temporal-coherence) between DMN and occipital cortex was observed (p = 0.002, Fig. 4, Table 4). Similarly, higher GM-ODI extracted from the visual association network was associated with increased connectivity between this network and the medial aspect of the frontal lobe, corresponding to the anterior DMN (p = 0.003; Fig. 4, Table 4). GM-ODI extracted from sensorimotor and primary visual networks correlated positively, albeit nonsignificantly after multiple-comparison correction (sensorimotor network: p = 0.020; primary visual network: p = 0.021), with functional connectivity between these networks and insula, anterior and posterior cingulate cortices, and precuneus. In contrast, we did not detect any significant positive relationship between mean ODI extracted from the two lateralized frontotemporal networks (right and left) and functional connectivity of these networks. Furthermore, we found a tendency toward reduced functional connectivity between the right frontotemporal network and right frontal pole with higher ODI from this resting state network (p = 0.027; Table 4).
Figure 4.

Effects of GM ODI extracted from DMN and visual association networks (VANs) on voxelwise functional connectivity (temporal coherence) of the corresponding network while controlling for effects of age and sex(dual regression). Age-related differences in resting-state functional connectivity for each network are also depicted for both networks.
Table 4.
MNI coordinates and volume of clusters (pFWE <0.05) demonstrating effect of ODI extracted from each resting-state network (RSN) on its voxelwise functional connectivity (temporal coherence) while controlling for effects of age and sex (dual regression)
| Cluster | Volume (mm3) | Minimum p-value | MNI coordinates |
Hemisphere | Brain regions | ||
|---|---|---|---|---|---|---|---|
| X | Y | Z | |||||
| Default mode network (ODI/RSN overlapa: 9.0%, ODI/age similarityb: 0.16) | |||||||
| D1 | 174720 | 0.002 | 18 | −70 | 28 | Bilateral | Cuneus, Lingual gyrus, OccPo, LOC, Occipital Fus. gyrus, Precuneus |
| D2 | 67072 | 0.026 | −2 | 14 | 4 | Left | Caudate nucleus |
| D3 | 3392 | 0.039 | 38 | 42 | −20 | Right | FPo |
| Visual association network (ODI/RSN overlap: 8.5%, ODI/age similarity: 0.30) | |||||||
| V1 | 234944 | 0.003 | −10 | 38 | −12 | Bilateral | MedFC, ACC, FPo, ParaCG, OFC, IFG |
| V2 | 15680 | 0.021 | 14 | −50 | −12 | Right | Lingual Gyrus, Fus. cortex |
| V3 | 6272 | 0.021 | −50 | −6 | 44 | Left | PreCG |
| V4 | 3904 | 0.021 | 14 | −62 | 32 | Right | Precuneus |
| V5 | 3072 | 0.043 | 6 | −90 | 28 | Right | Cuneus, OccPo |
| V6 | 2304 | 0.027 | 46 | 30 | 12 | Right | IFG |
| V7 | 1600 | 0.029 | −22 | 26 | 28 | Left | MFG |
| Sensorimotor network (ODI/RSN overlap: 30.0%, ODI/age similarity: 0.27) | |||||||
| S1 | 65728 | 0.02 | 30 | −22 | 20 | Right | Insula, Lingual gyrus, Fus. cortex |
| S2 | 28544 | 0.026 | 2 | −18 | 44 | Bilateral | PCC, JLC, Precuneus |
| S3 | 2176 | 0.04 | 2 | 38 | −4 | Bilateral | ACC |
| S4 | 1984 | 0.034 | −10 | 46 | 28 | Left | Lingual gyrus, Fus. cortex |
| S5 | 1856 | 0.037 | 62 | 14 | −8 | Right | TPo |
| Primary visual network (ODI/RSN overlap: <1%, ODI/age similarity: 0.11) | |||||||
| P1 | 21504 | 0.021 | 22 | 18 | 8 | Right | Caudate Nucleus, Insula |
| P2 | 14528 | 0.021 | 14 | 10 | 28 | Bilateral | ACC |
| P3 | 9344 | 0.021 | −18 | −42 | 40 | Left | PCC, Precuneus |
| P4 | 3520 | 0.031 | −54 | 2 | 8 | Left | PreCG, Insula |
| P5 | 2880 | 0.04 | −26 | 26 | 8 | Left | Insula |
| Right frontotemporal networkc (ODI/RSN overlap: 26.5%, ODI/age similarity: no significant age effect) | |||||||
| R1 | 1600 | 0.03 | 22 | 50 | 24 | Right | FPo |
| R2 | 768 | 0.027 | 50 | 34 | −8 | Right | FPo |
ACC, anterior cingulate cortex; FOC, orbitofrontal cortex; FPo, frontal pole; Fus, fusiform; IFG, inferior frontal gyrus; JLC, juxtapositional cortex; LOC, lateral occipital cortex; MedFC, medial frontal cortex; MFG, middle frontal gyrus; OccPo, Occipital Pole; ParaCG, paracingulate gyrus; PreCG, precentral gyrus; PCC, posterior cingulate cortex.
aODI/RSN overlap was calculated as the percentage of voxels demonstrating effect of orientation dispersion index (using a more liberal threshold: pFWE <0.10) that were located inside the main loci of the RSN (z > 3).
bODI/age spatial similarity was indexed using a Dice similarity score between the voxels demonstrating effect of orientation dispersion index and the voxels demonstrating effect of age (both thresholded at a more liberal pFWE <0.10).
cExcept for right frontotemporal network, higher ODI was associated with increased functional connectivity.
We further investigated age-related differences in resting-state functional connectivity for each network (Fig. 4, Table 4). All four networks that showed higher functional connectivity with higher GM ODI also demonstrated age-related deficits in functional connectivity (pFWE <0.05). No age effect was observed for the left and right lateralized frontotemporal networks. These age-related effects disappeared when effects of age were modeled in conjunction with GM ODI.
Cognitive correlates of GM microstructure
Across 48 cortical ROIs, frontal pole ODI was a significant determinant of working memory/processing speed independent of age (partial r = 0.49, p = 0.0009) after correction for multiple comparisons. In the follow-up analysis, hippocampal ODI (t = 2.05, p = 0.047) also contributed positively to working memory/processing speed performance along with frontal pole ODI (t = 3.9, p = 0.0004) independent of age/sex. Consistent with our hypothesis, the mediation analysis demonstrated that frontal pole ODI mediated the negative relationship of age with cognition, whereas hippocampal-ODI mediated the protective effects of age (Fig. 5).
Figure 5.
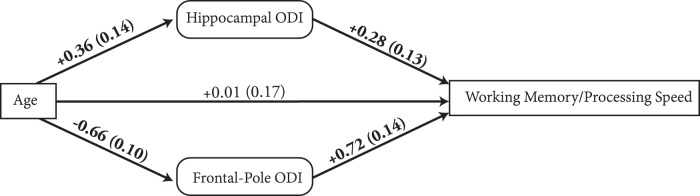
Mediation analysis of relationships among age (exogenous variable), frontal pole ODI, hippocampal ODI, and cognitive performance. Significant regression coefficients (SE) of associated paths are shown in boldface.
Discussion
By applying the NODDI model to multishell diffusion images, we found an in vivo pattern aligned very closely with published postmortem data indexing neocortical vulnerability and hippocampal compensation. We further demonstrated that these microstructural differences have consequences in cognitive function and brain resting-state networks with age-related susceptibility.
Effects of age on GM ODI were independent of GM volume/cortical thickness measurements. Moreover, there were no associations between GM ODI and cortical thickness or subcortical volume after controlling for age. This suggests that GM microstructure (ODI) and macrostructure (volume/cortical thickness) likely represent independent processes in normal aging. Age trends for ODI exhibited substantial regional specificity and matched age-related dendritic changes previously documented in each region. Congruent with neocortical dendritic deficits with advancing age, decreased complexity, and regression of the dendritic tree (Duan et al., 2003; Dickstein et al., 2013), we observed pervasive age-related decline in neocortical ODI. Age-related deficits in frontoparietal ODI were more pronounced than those in temporo-occipital ODI in coherence with a retrogenesis pattern (i.e., GM regions that mature last are the first to be affected in later life; Reisberg et al., 1999). Only a small number of quantitative dendritic postmortem investigations (either in humans or in nonhuman primates) have studied regional specificity of aging in the neocortex (Jacobs et al., 1997; Young et al., 2014) because most studies have typically focused on only a single cortical area (Nakamura et al., 1985; Jacobs and Scheibel, 1993; Anderson and Rutledge, 1996; Duan et al., 2003). Future postmortem studies that examine the effect of aging simultaneously on multiple cortical regions throughout the neocortex would help to facilitate comparison between our in vivo results and postmortem findings (Kim et al., 2013).
We observed a possible protective effect of higher hippocampal ODI with advancing age. Intriguingly, age-related extension and growth of the dendritic tree have been reported in the hippocampus (Flood et al., 1985; Pyapali and Turner, 1996). These changes have been regarded as a compensatory mechanism that occurs in successful aging in response to partial deafferentation (Buell and Coleman, 1979; Pyapali and Turner, 1996). Our in vivo results agree with previous postmortem results and could be interpreted as age-related increases of hippocampal ODI playing a protective role against cognitive aging. In cerebellum, we found a nonsignificant (pFWE = 0.11) age-related decline of ODI within the vermal region. However, ODI increased significantly with age in the hemispheric regions of lobule VIIA (cerebro-cerebellum) (Schmahmann and Pandya, 1997). Virtually all previous studies examining the impact of aging on cerebellar dendritic organization have focused solely on the vermal region of the cerebellum and have observed age-related dendritic and synaptic deficits in this region (Rogers et al., 1984; Chen and Hillman, 1999), which is consistent with our results. Lobule VIIA, however, is an evolutionary recent area of the cerebellum that is densely connected to the neocortex (Schmahmann and Pandya, 1997). This suggests that ODI increases in the cerebellar hemispheres may also be a compensatory response to age-related deafferentation.
Higher GM ODI sampled from DMN and visual association network was associated with increased functional connectivity of these networks. A similar trend was also observed for primary visual and sensorimotor networks. We also observed age-related deficits in functional connectivity of networks that were positively correlated with GM ODI. There was partial anatomical overlap between effects of ODI and age on functional connectivity for each of these networks. Furthermore, age-related effects disappeared when age was modeled together with GM ODI. These findings collectively suggest that GM ODI partially mediates the effects of age on resting-state functional connectivity.
Functional connectivity disruption of the DMN with advancing age is a well replicated fMRI finding in healthy aging (Mowinckel et al., 2012; Ferreira and Busatto, 2013). Our findings demonstrate how both intrinsic (within the DMN itself) and extrinsic (within other resting-state networks) microstructural GM differences could contribute to functional connectivity variations of the DMN. In addition, we observed that GM ODI was related to functional connectivity of resting-state networks with several regions outside of the boundaries of these networks. Permutation testing after dual regression analysis permits identification of any brain region where functional connectivity with a network is related to GM ODI. Therefore, it is possible that clusters demonstrating differential connectivity (in relation to ODI) with resting-state networks fall outside the main foci of a given network (Voets et al., 2012). Therefore, ODI may predict both intranetwork connectivity and internetwork connectivity. Although the implication of these relationships is still unclear, there is a growing interest in evaluating such between-network connections (Smith et al., 2013).
Our results suggest that resting-state networks are differentially affected by GM microstructure, in which task-negative and lower sensory/sensorimotor network connectivity associated positively with ODI, lateralized task-positive networks involved in higher cognition and attention remained unaffected or even decreased with higher ODI. These results align closely with network-specific effects of aging reported previously (Mowinckel et al., 2012). In previous endeavors linking brain structure to functional connectivity, long-range WM tracts have been a focus (Bullmore and Bassett, 2011). Assessment of GM microstructure, perhaps by indexing local circuitry and ensemble cyto-architecture (Assaf et al., 2013), provides additional insight into structure–function relationships in the human brain (Bullmore and Bassett, 2011).
In terms of our diffusion image analysis approach, we used a conservative inclusion criterion (estimated GM fraction >0.7) for voxels entering statistical analyses to further limit potential partial volume effects. However, this approach may inadvertently decrease statistical power in regions with thin cortical GM. Conversely, given our results, it appears that we had more than adequate power to achieve our stated aims. Even greater power is achievable with ultra-high-resolution diffusion-weighted MRI (Sotiropoulos et al., 2013). Our structure–function relationships were elicited using fMRI only in the resting condition. Future studies will have to be performed to broaden these findings and the potential effects of GM microstructure on the brain's functional dynamics during behavioral tasks and/or causal modeling of functional data (Friston et al., 2003) may provide additional useful knowledge. In addition, relaxation times (T1 and T2) vary across brain tissues. This results in greater relative signal from the free water component (CSF) compared with other brain tissues given the same echo time. It has been shown that this issue may result in free water fraction overestimation in a bitensor model using single-shell diffusion data (Pasternak et al., 2009). Although T1-related effects tend to be minimal given the long TRs commonly used for diffusion imaging (as in our study: TR = 12,000 ms), T2-related effects are more pronounced when TE is longer (Pasternak et al., 2009). However, to the best of our knowledge, no study to date has shown whether such biases exist for the NODDI model as well, which uses multishell diffusion data. In our study, CSF fraction estimates were only used to calculate the GM fraction and were not used as an outcome measure (Pasternak et al., 2012). Therefore, we believe that any potential overestimation of the CSF-fraction would have minimal effect on the findings in our study.
Our cross-sectional design limits our ability to examine the temporal dynamics among aging, GM microstructural changes, and cognitive performance. Cohort effects and sampling biases can potentially confound effects of aging in studies using a cross-sectional design. Previously published work has shown that a cross-sectional design can either overestimate (Nyberg et al., 2010) or underestimate (Raz et al., 2005) age-related changes in relational to longitudinal data. In this regard, our findings should be interpreted with caution because they are the first of their kind and our sample size can be considered relatively small. Although strong effects of age on GM ODI were detected, additional studies with larger sample sizes may detect relationships of smaller effect sizes and may allow for more complex multivariate modeling with age. Despite the agreement of our results with the postmortem literature, our interpretation of subcortical ODI changes as “compensatory” should be taken with caution. Tissue organization of subcortical regions that showed higher ODI with aging (i.e., three-layered cerebellar cortex and hippocampus) are considerably different from that of neocortex, which has a six-layered architecture (Shepherd, 2011; Roostaei et al., 2014). Therefore, an alternative interpretation is that age-related ODI differences in these structures represent different underlying microstructural phenomena.
Our findings provide evidence for vulnerability and compensatory neural mechanisms of cognitive aging in GM microstructure in vivo that have functional and cognitive impact. Microstructural GM changes represent a new target of investigation, not only for aging, but also for brain disorders with known dendritic susceptibility such as Alzheimer's disease (Penzes et al., 2011). These alterations may serve as either a diagnostic marker for at the earliest stage of illness or as targets for therapeutic intervention.
Footnotes
A.N.V. is funded by the Canadian Institutes of Health Research, Ontario Mental Health Foundation, NARSAD, and the National Institute of Mental Health, National Institutes of Health (Grants R01MH099167 and R01MH102324). M.M.C. is funded by the W. Garfield Weston Foundation and Natural Sciences and Engineering Research Council. A.N. is a recipient of a fellowship from the Centre for Addiction and Mental Health.
The authors declare no competing financial interests.
References
- Anderson B, Rutledge V. Age and hemisphere effects on dendritic structure. Brain. 1996;119:1983–1990. doi: 10.1093/brain/119.6.1983. [DOI] [PubMed] [Google Scholar]
- Assaf Y, Alexander DC, Jones DK, Bizzi A, Behrens TE, Clark CA, Cohen Y, Dyrby TB, Huppi PS, Knoesche TR, Lebihan D, Parker GJ, Poupon C, Poupon C, Anaby D, Anwander A, Bar L, Barazany D, Blumenfeld-Katzir T, De-Santis S, Duclap D, Figini M, Fischi E, Guevara P, Hubbard P, Hofstetter S, Jbabdi S, Kunz N, Lazeyras F, Lebois A, Liptrot MG, Lundell H, Mangin JF, Dominguez DM, Morozov D, Schreiber J, Seunarine K, Nava S, Poupon C, Riffert T, Sasson E, Schmitt B, Shemesh N, Sotiropoulos SN, Tavor I, Zhang HG, Zhou FL. The CONNECT project: combining macro-and micro-structure. Neuroimage. 2013;80:273–282. doi: 10.1016/j.neuroimage.2013.05.055. [DOI] [PubMed] [Google Scholar]
- Avants BB, Tustison NJ, Wu J, Cook PA, Gee JC. An open source multivariate framework for n-tissue segmentation with evaluation on public data. Neuroinformatics. 2011a;9:381–400. doi: 10.1007/s12021-011-9109-y. [DOI] [PMC free article] [PubMed] [Google Scholar]
- Avants BB, Tustison NJ, Song G, Cook PA, Klein A, Gee JC. A reproducible evaluation of ANTs similarity metric performance in brain image registration. Neuroimage. 2011b;54:2033–2044. doi: 10.1016/j.neuroimage.2010.09.025. [DOI] [PMC free article] [PubMed] [Google Scholar]
- Ball G, Srinivasan L, Aljabar P, Counsell SJ, Durighel G, Hajnal JV, Rutherford MA, Edwards AD. Development of cortical microstructure in the preterm human brain. Proc Natl Acad Sci U S A. 2013;110:9541–9546. doi: 10.1073/pnas.1301652110. [DOI] [PMC free article] [PubMed] [Google Scholar]
- Beckmann CF, Smith SM. Probabilistic independent component analysis for functional magnetic resonance imaging. IEEE Trans Med Imaging. 2004;23:137–152. doi: 10.1109/TMI.2003.822821. [DOI] [PubMed] [Google Scholar]
- Beckmann CF, DeLuca M, Devlin JT, Smith SM. Investigations into resting-state connectivity using independent component analysis. Philos Trans R Soc Lond B Biol Sci. 2005;360:1001–1013. doi: 10.1098/rstb.2005.1634. [DOI] [PMC free article] [PubMed] [Google Scholar]
- Buell SJ, Coleman PD. Dendritic growth in the aged human brain and failure of growth in senile dementia. Science. 1979;206:854–856. doi: 10.1126/science.493989. [DOI] [PubMed] [Google Scholar]
- Bullmore ET, Bassett DS. Brain graphs: graphical models of the human brain connectome. Annu Rev Clin Psychol. 2011;7:113–140. doi: 10.1146/annurev-clinpsy-040510-143934. [DOI] [PubMed] [Google Scholar]
- Chen S, Hillman DE. Dying-back of Purkinje cell dendrites with synapse loss in aging rats. J Neurocytol. 1999;28:187–196. doi: 10.1023/A:1007015721754. [DOI] [PubMed] [Google Scholar]
- Dale AM, Fischl B, Sereno MI. Cortical surface-based analysis: I. Segmentation and surface reconstruction. Neuroimage. 1999;9:179–194. doi: 10.1006/nimg.1998.0395. [DOI] [PubMed] [Google Scholar]
- de Brabander JM, Kramers RJ, Uylings HB. Layer-specific dendritic regression of pyramidal cells with ageing in the human prefrontal cortex. Eur J Neurosci. 1998;10:1261–1269. doi: 10.1046/j.1460-9568.1998.00137.x. [DOI] [PubMed] [Google Scholar]
- Dickstein DL, Weaver CM, Luebke JI, Hof PR. Dendritic spine changes associated with normal aging. Neuroscience. 2013;251:21–32. doi: 10.1016/j.neuroscience.2012.09.077. [DOI] [PMC free article] [PubMed] [Google Scholar]
- Duan H, Wearne SL, Rocher AB, Macedo A, Morrison JH, Hof PR. Age-related dendritic and spine changes in corticocortically projecting neurons in macaque monkeys. Cereb Cortex. 2003;13:950–961. doi: 10.1093/cercor/13.9.950. [DOI] [PubMed] [Google Scholar]
- Ferreira LK, Busatto GF. Resting-state functional connectivity in normal brain aging. Neurosci Biobehav Rev. 2013;37:384–400. doi: 10.1016/j.neubiorev.2013.01.017. [DOI] [PubMed] [Google Scholar]
- Filippini N, MacIntosh BJ, Hough MG, Goodwin GM, Frisoni GB, Smith SM, Matthews PM, Beckmann CF, Mackay CE. Distinct patterns of brain activity in young carriers of the APOE-ε4 allele. Proc Natl Acad Sci U S A. 2009;106:7209–7214. doi: 10.1073/pnas.0811879106. [DOI] [PMC free article] [PubMed] [Google Scholar]
- Fischl B. FreeSurfer. Neuroimage. 2012;62:774–781. doi: 10.1016/j.neuroimage.2012.01.021. [DOI] [PMC free article] [PubMed] [Google Scholar]
- Fischl B, Dale AM. Measuring the thickness of the human cerebral cortex from magnetic resonance images. Proc Natl Acad Sci U S A. 2000;97:11050–11055. doi: 10.1073/pnas.200033797. [DOI] [PMC free article] [PubMed] [Google Scholar]
- Flood DG, Buell SJ, Defiore CH, Horwitz GJ, Coleman PD. Age-related dendritic growth in dentate gyrus of human brain is followed by regression in the ‘oldest old’. Brain Res. 1985;345:366–368. doi: 10.1016/0006-8993(85)91018-2. [DOI] [PubMed] [Google Scholar]
- Friston KJ, Harrison L, Penny W. Dynamic causal modelling. Neuroimage. 2003;19:1273–1302. doi: 10.1016/S1053-8119(03)00202-7. [DOI] [PubMed] [Google Scholar]
- Glasser MF, Van Essen DC. Mapping human cortical areas in vivo based on myelin content as revealed by T1-and T2-weighted MRI. J Neurosci. 2011;31:11597–11616. doi: 10.1523/JNEUROSCI.2180-11.2011. [DOI] [PMC free article] [PubMed] [Google Scholar]
- Griffanti L, Salimi-Khorshidi G, Beckmann CF, Auerbach EJ, Douaud G, Sexton CE, Zsoldos E, Ebmeier KP, Filippini N, Mackay CE, Moeller S, Xu J, Yacoub E, Baselli G, Ugurbil K, Miller KL, Smith SM. ICA-based artefact removal and accelerated fMRI acquisition for improved resting state network imaging. Neuroimage. 2014;95:232–247. doi: 10.1016/j.neuroimage.2014.03.034. [DOI] [PMC free article] [PubMed] [Google Scholar]
- Grydeland H, Walhovd KB, Tamnes CK, Westlye LT, Fjell AM. Intracortical myelin links with performance variability across the human lifespan: results from T1-and T2-weighted MRI myelin mapping and diffusion tensor imaging. J Neurosci. 2013;33:18618–18630. doi: 10.1523/JNEUROSCI.2811-13.2013. [DOI] [PMC free article] [PubMed] [Google Scholar]
- Jacobs B, Scheibel AB. A quantitative dendritic analysis of Wernicke's area in humans. I. Lifespan changes. J Comp Neurol. 1993;327:83–96. doi: 10.1002/cne.903270107. [DOI] [PubMed] [Google Scholar]
- Jacobs B, Driscoll L, Schall M. Life-span dendritic and spine changes in areas 10 and 18 of human cortex: A quantitative Golgi study. J Comp Neurol. 1997;386:661–680. doi: 10.1002/(SICI)1096-9861(19971006)386:4<661::AID-CNE11>3.0.CO;2-N. [DOI] [PubMed] [Google Scholar]
- Jenkinson M, Beckmann CF, Behrens TE, Woolrich MW, Smith SM. Fsl. Neuroimage. 2012;62:782–790. doi: 10.1016/j.neuroimage.2011.09.015. [DOI] [PubMed] [Google Scholar]
- Jespersen SN, Kroenke CD, Østergaard L, Ackerman JJ, Yablonskiy DA. Modeling dendrite density from magnetic resonance diffusion measurements. Neuroimage. 2007;34:1473–1486. doi: 10.1016/j.neuroimage.2006.10.037. [DOI] [PubMed] [Google Scholar]
- Kim SY, Chung K, Deisseroth K. Light microscopy mapping of connections in the intact brain. Trends Cogn Sci. 2013;17:596–599. doi: 10.1016/j.tics.2013.10.005. [DOI] [PubMed] [Google Scholar]
- Koo BB, Hua N, Choi CH, Ronen I, Lee JM, Kim DS. A framework to analyze partial volume effect on gray matter mean diffusivity measurements. Neuroimage. 2009;44:136–144. doi: 10.1016/j.neuroimage.2008.07.064. [DOI] [PubMed] [Google Scholar]
- Kumazawa S, Yoshiura T, Honda H, Toyofuku F, Higashida Y. Partial volume estimation and segmentation of brain tissue based on diffusion tensor MRI. Med Phys. 2010;37:1482–1490. doi: 10.1118/1.3355886. [DOI] [PubMed] [Google Scholar]
- Liu T, Li H, Wong K, Tarokh A, Guo L, Wong ST. Brain tissue segmentation based on DTI data. Neuroimage. 2007;38:114–123. doi: 10.1016/j.neuroimage.2007.07.002. [DOI] [PMC free article] [PubMed] [Google Scholar]
- Miller MD, Paradis CF, Houck PR, Mazumdar S, Stack JA, Rifai AH, Mulsant B, Reynolds CF., 3rd Rating chronic medical illness burden in geropsychiatric practice and research: application of the Cumulative Illness Rating Scale. Psychiatry Res. 1992;41:237–248. doi: 10.1016/0165-1781(92)90005-N. [DOI] [PubMed] [Google Scholar]
- Mowinckel AM, Espeseth T, Westlye LT. Network-specific effects of age and in-scanner subject motion: a resting-state fMRI study of 238 healthy adults. Neuroimage. 2012;63:1364–1373. doi: 10.1016/j.neuroimage.2012.08.004. [DOI] [PubMed] [Google Scholar]
- Nakamura S, Akiguchi I, Kameyama M, Mizuno N. Age-related changes of pyramidal cell basal dendrites in layers III and V of human motor cortex: a quantitative Golgi study. Acta Neuropathol. 1985;65:281–284. doi: 10.1007/BF00687009. [DOI] [PubMed] [Google Scholar]
- Nichols TE, Holmes AP. Nonparametric permutation tests for functional neuroimaging: a primer with examples. Hum Brain Mapp. 2002;15:1–25. doi: 10.1002/hbm.1058. [DOI] [PMC free article] [PubMed] [Google Scholar]
- Nyberg L, Salami A, Andersson M, Eriksson J, Kalpouzos G, Kauppi K, Lind J, Pudas S, Persson J, Nilsson LG. Longitudinal evidence for diminished frontal cortex function in aging. Proc Natl Acad Sci U S A. 2010;107:22682–22686. doi: 10.1073/pnas.1012651108. [DOI] [PMC free article] [PubMed] [Google Scholar]
- Oldfield RC. The assessment and analysis of handedness: the Edinburgh inventory. Neuropsychologia. 1971;9:97–113. doi: 10.1016/0028-3932(71)90067-4. [DOI] [PubMed] [Google Scholar]
- Pasternak O, Sochen N, Gur Y, Intrator N, Assaf Y. Free water elimination and mapping from diffusion MRI. Magn Reson Med. 2009;62:717–730. doi: 10.1002/mrm.22055. [DOI] [PubMed] [Google Scholar]
- Pasternak O, Westin CF, Bouix S, Seidman LJ, Goldstein JM, Woo TU, Petryshen TL, Mesholam-Gately RI, McCarley RW, Kikinis R, Shenton ME, Kubicki M. Excessive extracellular volume reveals a neurodegenerative pattern in schizophrenia onset. J Neurosci. 2012;32:17365–17372. doi: 10.1523/JNEUROSCI.2904-12.2012. [DOI] [PMC free article] [PubMed] [Google Scholar]
- Penzes P, Cahill ME, Jones KA, VanLeeuwen JE, Woolfrey KM. Dendritic spine pathology in neuropsychiatric disorders. Nat Neurosci. 2011;14:285–293. doi: 10.1038/nn.2741. [DOI] [PMC free article] [PubMed] [Google Scholar]
- Pereira JB, Valls-Pedret C, Ros E, Palacios E, Falcón C, Bargalló N, Bartrés-Faz D, Wahlund LO, Westman E, Junque C. Regional vulnerability of hippocampal subfields to aging measured by structural and diffusion MRI. Hippocampus. 2014;24:403–414. doi: 10.1002/hipo.22234. [DOI] [PubMed] [Google Scholar]
- Preacher KJ, Hayes AF. Asymptotic and resampling strategies for assessing and comparing indirect effects in multiple mediator models. Behav Res Methods. 2008;40:879–891. doi: 10.3758/BRM.40.3.879. [DOI] [PubMed] [Google Scholar]
- Pyapali GK, Turner DA. Increased dendritic extent in hippocampal CA1 neurons from aged F344 rats. Neurobiol Aging. 1996;17:601–611. doi: 10.1016/0197-4580(96)00034-6. [DOI] [PubMed] [Google Scholar]
- Rathi Y, Pasternak O, Savadjiev P, Michailovich O, Bouix S, Kubicki M, Westin CF, Makris N, Shenton ME. Gray matter alterations in early aging: A diffusion magnetic resonance imaging study. Hum Brain Mapp. 2014;35:3841–3856. doi: 10.1002/hbm.22441. [DOI] [PMC free article] [PubMed] [Google Scholar]
- Raz N, Lindenberger U, Rodrigue KM, Kennedy KM, Head D, Williamson A, Dahle C, Gerstorf D, Acker JD. Regional brain changes in aging healthy adults: general trends, individual differences and modifiers. Cereb Cortex. 2005;15:1676–1689. doi: 10.1093/cercor/bhi044. [DOI] [PubMed] [Google Scholar]
- Reisberg B, Franssen EH, Hasan SM, Monteiro I, Boksay I, Souren LEM, Kenowsky S, Auer SR, Elahi S, Kluger A. Retrogenesis: clinical, physiologic, and pathologic mechanisms in brain aging, Alzheimer's and other dementing processes. Eur Arch Psychiatry Clin Neurosci. 1999;249:S28–S36. doi: 10.1007/PL00014170. [DOI] [PubMed] [Google Scholar]
- Reitan RM, Wolfson D. The Halstead-Reitan neuropsychological test battery: theory and clinical interpretation: Neuropsychology Tucson, AZ. 1985 [Google Scholar]
- Rogers J, Zornetzer SF, Bloom FE, Mervis RE. Senescent microstructural changes in rat cerebellum. Brain Res. 1984;292:23–32. doi: 10.1016/0006-8993(84)90886-2. [DOI] [PubMed] [Google Scholar]
- Roostaei T, Nazeri A, Sahraian MA, Minagar A. The human cerebellum: a review of physiologic neuroanatomy. Neurol Clin. 2014;32:859–869. doi: 10.1016/j.ncl.2014.07.013. [DOI] [PubMed] [Google Scholar]
- Salimi-Khorshidi G, Douaud G, Beckmann CF, Glasser MF, Griffanti L, Smith SM. Automatic denoising of functional MRI data: combining independent component analysis and hierarchical fusion of classifiers. Neuroimage. 2014;90:449–468. doi: 10.1016/j.neuroimage.2013.11.046. [DOI] [PMC free article] [PubMed] [Google Scholar]
- Schmahmann JD, Pandya DN. The cerebrocerebellar system. Int Rev Neurobiol. 1997;41:31–60. doi: 10.1016/S0074-7742(08)60346-3. [DOI] [PubMed] [Google Scholar]
- Schwarz CG, Reid RI, Gunter JL, Senjem ML, Przybelski SA, Zuk SM, Whitwell JL, Vemuri P, Josephs KA, Kantarci K, Thompson PM, Petersen RC, Jack CR, Jr Alzheimer's Disease Neuroimaging Initiative. Improved DTI registration allows voxel-based analysis that outperforms Tract-Based Spatial Statistics. Neuroimage. 2014;94:65–78. doi: 10.1016/j.neuroimage.2014.03.026. [DOI] [PMC free article] [PubMed] [Google Scholar]
- Shepherd GM. The microcircuit concept applied to cortical evolution: from three-layer to six-layer cortex. Front Neuroanat. 2011:5. doi: 10.3389/fnana.2011.00030. [DOI] [PMC free article] [PubMed] [Google Scholar]
- Smith SM. Fast robust automated brain extraction. Hum Brain Mapp. 2002;17:143–155. doi: 10.1002/hbm.10062. [DOI] [PMC free article] [PubMed] [Google Scholar]
- Smith SM, Nichols TE. Threshold-free cluster enhancement: addressing problems of smoothing, threshold dependence and localisation in cluster inference. Neuroimage. 2009;44:83–98. doi: 10.1016/j.neuroimage.2008.03.061. [DOI] [PubMed] [Google Scholar]
- Smith SM, Jenkinson M, Johansen-Berg H, Rueckert D, Nichols TE, Mackay CE, Watkins KE, Ciccarelli O, Cader MZ, Matthews PM, Behrens TE. Tract-based spatial statistics: voxelwise analysis of multi-subject diffusion data. Neuroimage. 2006;31:1487–1505. doi: 10.1016/j.neuroimage.2006.02.024. [DOI] [PubMed] [Google Scholar]
- Smith SM, Fox PT, Miller KL, Glahn DC, Fox PM, Mackay CE, Filippini N, Watkins KE, Toro R, Laird AR, Beckmann CF. Correspondence of the brain's functional architecture during activation and rest. Proc Natl Acad Sci U S A. 2009;106:13040–13045. doi: 10.1073/pnas.0905267106. [DOI] [PMC free article] [PubMed] [Google Scholar]
- Smith SM, Vidaurre D, Beckmann CF, Glasser MF, Jenkinson M, Miller KL, Nichols TE, Robinson EC, Salimi-Khorshidi G, Woolrich MW, Barch DM, Uğurbil K, Van Essen DC. Functional connectomics from resting-state fMRI. Trends Cogn Sci. 2013;17:666–682. doi: 10.1016/j.tics.2013.09.016. [DOI] [PMC free article] [PubMed] [Google Scholar]
- Sotiropoulos SN, Behrens TE, Jbabdi S. Ball and rackets: inferring fiber fanning from diffusion-weighted MRI. Neuroimage. 2012;60:1412–1425. doi: 10.1016/j.neuroimage.2012.01.056. [DOI] [PMC free article] [PubMed] [Google Scholar]
- Sotiropoulos SN, Jbabdi S, Xu J, Andersson JL, Moeller S, Auerbach EJ, Glasser MF, Hernandez M, Sapiro G, Jenkinson M, Yacoub E, Lenglet C, Van Essen DC, Ugurbil K, Behrens TE, Behrens TE. Advances in diffusion MRI acquisition and processing in the Human Connectome Project. Neuroimage. 2013;80:125–143. doi: 10.1016/j.neuroimage.2013.05.057. [DOI] [PMC free article] [PubMed] [Google Scholar]
- Spruston N. Pyramidal neurons: dendritic structure and synaptic integration. Nat Rev Neurosci. 2008;9:206–221. doi: 10.1038/nrn2286. [DOI] [PubMed] [Google Scholar]
- Trenerry MR, Crosson B, DeBoe J, Leber WR. Stroop neuropsychological screening test manual. Odessa, FL: Psychological Assessment Resources; 1989. [Google Scholar]
- Viswanathan A, Freeman RD. Neurometabolic coupling in cerebral cortex reflects synaptic more than spiking activity. Nat Neurosci. 2007;10:1308–1312. doi: 10.1038/nn1977. [DOI] [PubMed] [Google Scholar]
- Voets NL, Beckmann CF, Cole DM, Hong S, Bernasconi A, Bernasconi N. Structural substrates for resting network disruption in temporal lobe epilepsy. Brain. 2012;135:2350–2357. doi: 10.1093/brain/aws137. [DOI] [PubMed] [Google Scholar]
- Wechsler D. The Wechsler Memory Scale. San Antonio, TX: Psychological Corporation, Harcourt Brace Jovanovich; 1997. [Google Scholar]
- Winston GP, Micallef C, Symms MR, Alexander DC, Duncan JS, Zhang H. Advanced diffusion imaging sequences could aid assessing patients with focal cortical dysplasia and epilepsy. Epilepsy Res. 2014;108:336–339. doi: 10.1016/j.eplepsyres.2013.11.004. [DOI] [PMC free article] [PubMed] [Google Scholar]
- Young ME, Ohm DT, Dumitriu D, Rapp PR, Morrison JH. Differential effects of aging on dendritic spines in visual cortex and prefrontal cortex of the rhesus monkey. Neuroscience. 2014;274:33–43. doi: 10.1016/j.neuroscience.2014.05.008. [DOI] [PMC free article] [PubMed] [Google Scholar]
- Zhang H, Schneider T, Wheeler-Kingshott CA, Alexander DC. NODDI: practical in vivo neurite orientation dispersion and density imaging of the human brain. Neuroimage. 2012;61:1000–1016. doi: 10.1016/j.neuroimage.2012.03.072. [DOI] [PubMed] [Google Scholar]