

Abstract
This human study is based on an established cohort of “SuperAgers,” 80+-year-old individuals with episodic memory function at a level equal to, or better than, individuals 20–30 years younger. A preliminary investigation using structural brain imaging revealed a region of anterior cingulate cortex that was thicker in SuperAgers compared with healthy 50- to 65-year-olds. Here, we investigated the in vivo structural features of cingulate cortex in a larger sample of SuperAgers and conducted a histologic analysis of this region in postmortem specimens. A region-of-interest MRI structural analysis found cingulate cortex to be thinner in cognitively average 80+ year olds (n = 21) than in the healthy middle-aged group (n = 18). A region of the anterior cingulate cortex in the right hemisphere displayed greater thickness in SuperAgers (n = 31) compared with cognitively average 80+ year olds and also to the much younger healthy 50–60 year olds (p < 0.01). Postmortem investigations were conducted in the cingulate cortex in five SuperAgers, five cognitively average elderly individuals, and five individuals with amnestic mild cognitive impairment. Compared with other subject groups, SuperAgers showed a lower frequency of Alzheimer-type neurofibrillary tangles (p < 0.05). There were no differences in total neuronal size or count between subject groups. Interestingly, relative to total neuronal packing density, there was a higher density of von Economo neurons (p < 0.05), particularly in anterior cingulate regions of SuperAgers. These findings suggest that reduced vulnerability to the age-related emergence of Alzheimer pathology and higher von Economo neuron density in anterior cingulate cortex may represent biological correlates of high memory capacity in advanced old age.
Keywords: aging, Alzheimer's pathology, cingulate cortex, cognition, histology, structural MRI
Introduction
Neurons are predominantly postmitotic cells and therefore accumulate an unusually heavy burden of wear and tear over the lifespan. This may be one reason why aging is the strongest risk factor for Alzheimer's disease (AD), an age-related neurodegenerative disease characterized by both severe memory impairment and characteristic accumulation of amyloid plaques (APs) and neurofibrillary tangles (NFTs). The AD stage is preceded by a prodromal amnestic mild cognitive impairment stage (aMCI) (Albert et al., 2011) in which plaques and tangles have a relatively limited distribution. In turn, the aMCI stage is preceded by a period of time during which amyloid processing becomes abnormal and tangles begin to sparsely appear in memory-related regions of medial temporal lobe, but without resultant memory impairment (Braak and Braak, 1991; Jack et al., 2013). Conceivably, these pre-MCI stages of Alzheimer pathology could be responsible for the ubiquitous “age-related” decline of memory capacity considered to be an inevitable part of normal (or average) aging (Salthouse, 2009). A relatively unexplored question is whether a continuum that leads from age-related memory changes to AD dementia is inherent to growing old or if alternative trajectories are possible.
To address this question, we recruited a cohort of individuals 80+ years of age whose memory performance was at least as high as the performance of average 50 to 65 year olds and whose performance in other cognitive domains was average for their own age or better. We coined the term “SuperAger” for these individuals with the assumption that they had a high likelihood of having avoided the involutional effects of age on memory function. Previous investigations of this cohort (Harrison et al., 2012) found that in a small group of SuperAgers (N = 12), there was little evidence of the age-related cortical atrophy that has been demonstrated in numerous studies on cognitively average populations of healthy elderly (Salat et al., 2004; Yao et al., 2012). Most surprisingly, a patch of anterior cingulate cortex was thicker in the SuperAger group than even in cognitively normal 50- to 65-year-old subjects (Harrison et al., 2012).
These initial findings from a whole-brain MRI prompted the current investigation, which expands upon earlier results through a focused region-of-interest (ROI) analysis of morphometric and histologic features of cingulate cortex in SuperAgers. We first compared the structural integrity of the cingulate cortex in larger groups of SuperAgers, cognitively average elderly individuals, and middle-aged controls using an in vivo ROI structural MRI approach. A second goal, in a smaller number of SuperAgers who came to postmortem brain autopsy, was to determine whether the cingulate cortex was less vulnerable to the formation of APs and NFTs. In initial stages of histopathologic evaluations, we were struck by an unusually high prominence of specialized nerve cells known as von Economo neurons (VENs) in the cingulate cortex of SuperAgers. Because these neurons are selectively concentrated within anterior limbic areas (Nimchinsky et al., 1995) and are vulnerable to frontotemporal neurodegeneration (Seeley et al., 2006), we undertook a stereological quantification to evaluate whether these neurons contribute to enhanced thickness of anterior cingulate cortex seen in SuperAgers.
Materials and Methods
MRI study methods
Recruitment and participants.
Eighteen middle-aged controls (50–65 years) were recruited through the Northwestern University's Alzheimer's Disease Center (ADC) Clinical Core. Thirty-one community-dwelling SuperAgers and 13 age-matched but cognitively average elderly individuals were identified through the Northwestern University SuperAging Study. Sample size for the cognitively average, elderly cohort was enlarged using data from nine participants obtained through the Alzheimer's Disease Neuroimaging Initiative (ADNI) database (www.adni.loni.usc.edu). The primary goal of ADNI has been to measure the progression of MCI and early AD and to aid researchers and clinicians in developing new treatments for AD. Subjects are recruited into ADNI from >50 sites in the United States and Canada, including Northwestern University's ADC, and their neuroimaging and neuropsychological data are made available to approved investigators. For up-to-date information on ADNI, see www.adni-info.org. ADNI participants were similar to the cognitively average sample in age, sex, and education and met all other criteria for that group.
Participants were identified based on strict neuropsychological criteria (detailed below), availability of a 3T structural MRI scan, and chronologic age, for which SuperAgers and elderly controls were required to be 80 years of age or older and middle-aged controls were required to be age 50–65. In this MRI portion of the study, 41% of all subjects were male. All participants were required to lack clinical evidence or history of neurologic or psychiatric disease. Apolipoprotein (ApoE) genotyping was available for the majority of SuperAgers and elderly control subjects (44 subjects of 52 total). Written informed consent was obtained from all participants in the study and the study was approved by the Northwestern University Institutional Review Board and in accordance with the Helsinki Declaration (www.wma.net/en/30publications/10policies/b3/). See Table 1 for demographic information and neuropsychological test scores for each subject group.
Table 1.
MRI study: subject demographic information and neuropsychological test scores with ANOVA comparisons
| SA (n = 31) | MAC (n = 18) | EC (n = 21) | ANOVA post hoc comparisons |
|||
|---|---|---|---|---|---|---|
| SA vs MAC | EC vs MAC | SA vs EC | ||||
| Age at baseline (y) | 82.52 (2.93) | 58.39 (3.70) | 83.76 (4.0) | SA > MACa | EC > MACa | NS |
| Education (y) | 15.52 (2.51) | 15.67 (2.25) | 16.19 (3.44) | NS | NS | NS |
| Gender (% male) | 32% | 33% | 62% | NS | NS | NS |
| % of subjects with ≥1 ApoE-4 allele | 15% | NA | 18% | — | — | NS |
| RAVLT Delay-Recall Raw (total = 15) | 11.32 (1.62) | 10.80 (2.70) | 5.57 (0.98) | NS | MAC > ECa | SA > ECa |
| RAVLT Delay-Recall (ss)* | 11.68 (1.22) | 11.27 (2.28) | 7.05 (0.59) | NS | MAC > ECa | SA > ECa |
| MMSE Raw (total = 30) | 29.23 (0.88) | 29.67 (0.49) | 28.86 (1.06) | NS | MAC > ECb | NS |
| Category Fluency Raw | 22.26 (5.16) | 23.72 (4.64) | 18.95 (4.54) | NS | MAC > ECb | SA > ECc |
| BNT-30 Raw | 28.68 (1.47) | 28.89 (1.13) | 27.57 (2.82) | NS | NS | NS |
| Trail-Making Test Part A Raw (sec) | 35.45 (12.95) | 29.28 (6.88) | 38.52 (14.10) | NS | NS | NS |
| Trail-Making Test Part B Raw (sec) | 87.81 (32.72) | 67.17 (24.69) | 118.38 (72.91) | NS | MAC < ECb | SA < ECc |
Values and scores are represented as mean (SD).
aSignificant at p < 0.0001.
bSignificant at p < 0.01.
cSignificant at p < 0.05.
*Scores were translated into scaled scores (ss; M = 10; SD = 3), based on normative values for younger individuals in their 50s and 60s.
NS, Not significant by ANOVA; SA, SuperAgers; MAC, middle-aged controls; EC, elderly controls; NA, not available.
Neuropsychological criteria for group inclusion.
All 31 community-dwelling SuperAging participants were required to meet strict psychometric criteria on a battery of neuropsychological tests, which were chosen for their relevance to cognitive aging and their sensitivity to detect clinical symptoms associated with dementia of the Alzheimer's type (Weintraub et al., 2012). The delayed recall score (30 min) of the Rey Auditory Verbal Learning Test (RAVLT) was used as a measure of episodic memory and SuperAgers were required to perform at or above average normative values for individuals in their 50s and 60s (midpoint age = 61 years; RAVLT delayed-recall raw score ≥9; RAVLT delayed-recall scaled score ≥10). A 30-item version of the Boston Naming Test (BNT-30; Saxton et al., 2000), Trail-Making Test Part B (TMT Part B; Reitan, 1958), and Category Fluency test [“Animals” (Morris et al., 1989), a semantic memory test that is sensitive to early stages of AD dementia] were used to measure cognitive function in nonmemory domains. On the BNT-30, TMT Part B, and Category Fluency, SuperAgers were required to perform within or above 1 SD of the average range for their age and demographics according to published normative values (Ivnik et al., 1996; Heaton, 2004; Shirk et al., 2011). In this study, the MMSE (Folstein et al., 1975) was administered as a general cognitive screening measure and the TMT Part A was included as a measure of psychomotor speed.
Middle-aged controls.
Eighteen middle-aged control participants (ages 50–65 years) were administered the same neuropsychological battery as SuperAgers and performed at a similar level to the SuperAger group. This younger, cognitively average-for-age group was used as a cognitive-status control group for which differences from SuperAgers could be attributed to age.
Cognitively average elderly controls.
A total of 21 age-matched, cognitively normal-for-age elderly controls were included in this study. Thirteen were recruited through the Northwestern SuperAging Study and identified as “average” compared with their same-age peers based on neuropsychological norms for the same tests administered to SuperAgers. Their test scores were required to fall within 1 SD of the average range for their age and education according to published normative values (Ivnik et al., 1996; Heaton, 2004; Shirk et al., 2011). Data for the remaining nine elderly controls were obtained through the ADNI database and subjects were identified based on neuropsychological test scores (some identical to the ones we used) and in accordance with the above criteria. Comparisons between SuperAgers and this control group would highlight differences not due to age, but rather to the SuperAgers' higher cognitive status.
MRI acquisition and preprocessing.
All SuperAgers, middle-aged control participants, and a subset of the elderly control participants were scanned at Northwestern University Feinberg School of Medicine's Center for Translational Imaging (CTI) on a Siemens 3T TIM TRIO system equipped with a 12-channel birdcage head coil. The structural scans consisted of a 3D T1-weighted MP-RAGE pulse sequence (TR = 2300 ms, TE = 2.91 ms, flip angle = 9°, FoV = 256 mm; slice thickness = 1.0 mm). The remaining scans from the elderly controls were acquired through the ADNI protocol using similar scanning procedures (Jack et al., 2008).
MR images were processed using the image analysis suite FreeSurfer (version 5.1.0), which is documented and freely available for download online (http://surfer.nmr.mgh.harvard.edu/). Cortical thickness estimates were calculated by measuring the distance between representations of the white-gray and pial–CSF boundaries across each point of the cortical surface. Images were visually inspected for errors and manually corrected when necessary. This method has been demonstrated to be reliable across scanning protocols and platforms in comparisons of cognition and cortical thickness (Dickerson et al., 2008). These procedures have been described previously in detail by Fischl and Dale (2000).
ROI-based cortical thickness generation and statistical analysis.
An a priori ROI-based approach in three bilateral cingulate regions was used to analyze differences in mean cortical thickness among the SuperAgers, cognitively average elderly, and middle-aged control groups. Each of the three cingulate ROIs were defined as described in Desikan et al. (2006) and for the purposes of this study were labeled according to the widely adopted terminology offered by Vogt (2009). Mean cortical thickness measures were extracted from cingulate areas that include the left and right cortical divisions from the rostral anterior cingulate [pregenual anterior cingulate cortex (prACC)], caudal anterior cingulate [anterior midcingulate cortex (aMCC)], and posterior cingulate cortex [posterior midcingulate cortex] (Fig. 1).
Figure 1.

Three cingulate ROIs. Medial ROIs of the cingulate cortex in the Desikan-Killiany (Desikan et al., 2006) cortical labeling protocol are color-coded with their corresponding parcellations characterized by Vogt (2009).
Statistical analysis of MRI study participants and cortical thickness.
ANOVAs with post hoc Tukey tests were used to determine differences in age, education, and neuropsychological performance on given tests across the three subject groups (Table 1). A χ2 analysis was used to determine if there were differences in sex distributions across subject groups. A mixed-model ANOVA with Bonferroni-corrected pairwise comparisons was used to compare cortical thickness across the three cingulate ROIs in both hemispheres and among the three subject groups; hemisphere was added as an interaction variable. Subsequent two-tailed Pearson correlations were performed to determine relationships between performance on neuropsychological measures (RAVLT, Animal fluency, 30-item BNT, TMT Parts A and B) and MRI thickness measures in mean anterior cingulate ROIs. A two-tailed Fisher's exact test was used to analyze differences in ApoE-4 allele frequency across two groups of samples for which genotyping was obtained (SuperAgers and elderly controls only). Statistical analysis was performed using SPSS software (version 20) and SAS software (version 8; SAS Institute).
Cellular and pathologic analysis
Postmortem cases and inclusion criteria.
Specimens belonging to the Northwestern University Alzheimer's Disease Center Brain Bank were surveyed to identify five right-handed cases (per group) that met criteria as described above for inclusion into the following three groups: SuperAgers, elderly cognitively average control group, and a group of individuals who were identified as having amnestic mild cognitive impairment (aMCI) based on the criteria proposed by the National Institute on Aging and Alzheimer's Association (NIA-AA) (Albert et al., 2011). Based on chart review, aMCI cases were required to show clear impairment on neuropsychological tests of memory and no impairment in other cognitive domains. Twenty percent of the entire postmortem sample was male. In contrast to the MRI portion of this multimodal study, a group of cognitively average 50- to 65-year-old specimens (i.e., middle-aged controls) were not included due to lack of availability of postmortem cases in this age group.
For most cases (four per group), ApoE genotyping was obtained. Three SuperAgers were participants of the Northwestern University SuperAging brain donation program and the remaining cases were identified through retrospective chart review based on extensive longitudinal cognitive assessment that was available within 24 months before death (range = 1–21 months). One cognitively average elderly control case (elderly control 3) was included despite a slightly younger age (72 years) and based on comprehensive chart review. Cases with evidence of a history of neurological or psychiatric disease were excluded.
Tissue processing and histopathology.
Postmortem intervals ranged from 3 to 12 h. After autopsy, each specimen was cut into 3–4 cm coronal blocks and fixed in 4% paraformaldehyde for 30–36 h at 4°C, and then taken through sucrose gradients (10–40% in 0.1 m sodium phosphate buffer, pH 7.4) for cryoprotection and stored at 4°C. Blocks were sectioned at a thickness of 40 μm on a freezing microtome and stored in 0.1 m phosphate buffer containing 0.02% sodium azide at 4°C until use. Regions were equivalent across tissue blocks, taken from the midportion of each subregion of the prACC (BA25/32 and pregenual BA24), aMCC (BA24), and pMCC (BA23/31) and were matched for each region across subject specimen. Within each cingulate block, the start of the section sampling was randomized per the requirement of stereologic counting principles. Up to 6 sections (intersection interval = 24 or 54) in each cortical region were stained with 0.1% thioflavin-S (Sigma Aldrich), which recognizes β-pleated sheet protein conformations, to visualize NFTs and mature/compact APs. A 1.0% cresyl violet Nissl stain was used to visualize neurons, including VENs, in the cingulate cortex. Samples from representative brain regions of each case were surveyed qualitatively by a neuropathologist and found to be free of pathologies other than APs and NFTs. Braak staging (Braak et al., 1993) was also surveyed in each case to identify NFT involvement in transentorhinal/entorhinal cortex, other limbic cortical areas, and neocortical regions.
Quantitation of Alzheimer pathology and numbers of neurons.
Modified stereological methods were used to estimate the density of thioflavin-S-stained plaques and tangles using fluorescence (380–420 nm) microscopy. For each case, the three cingulate subregions were traced at 4× and analyzed at 40× magnification by an individual blinded to group affiliation. Modified stereological analysis was performed on up to six sections according to procedures previously described in detail (Geula et al., 2003) using the fractionator method and the StereoInvestigator software from MBF Biosciences MicroBrightField. The sections used in analysis were treated as adjacent sections, allowing for calculation of the density in the total volume within the sections. The cingulate section to be studied was traced from the cortical surface to the white matter. The top and bottom 2 μm of each section were set as guard height. The dimensions of the counting frame chosen were 170 × 170 μm based on trials. For each set of stereologic markers, the coefficient of error was calculated and sampling parameters were adjusted so that the coefficient of error would reach <0.1. Stereological counts were combined for the total number of sections available per brain area and expressed as mean counts per cubic millimeter based on planimetric calculation of volume by the fractionator software. Counts included NFTs, APs, VENs, total number of neurons, and the ratio of VENs to total neuronal number to account for VEN concentration relative to baseline total neurons. VENs were defined by their location in the deep cortical layers and distinct morphology: thin, elongated cell body and long, bipolar dendrites (Watson et al., 2006). Mean counts were compared among the three groups to evaluate histopathologic differences between subject groups and to evaluate subregional differences across the cingulate.
Measurement of neuronal size.
Given our prior findings of the preservation of the cingulate cortex and increased cortical thickness observed in our SuperAging group, we determined the potential contribution of larger neuronal size to cortical integrity. Because pyramidal neurons represent the overwhelming majority of cingulate neurons, the size of these neurons was measured in layer III and layer V of each cingulate region per subject. VENs were also included in measurement upon appearance in the frame of interest. To measure neuronal size, ∼six photomicrographs were obtained from combined layer III and V per each cortical area and analyzed using the image-analysis program ImageJ version 1.45. The tracing function was used to measure the area of soma at 5.5 pixels/μm (image size = 1600 × 1200 pixels). Mean total area of neuronal soma was calculated in layer III and layer V per region, per case, and evaluated for differences across groups.
Statistical analysis of histopathologic data.
Nonparametric ANOVAs with post hoc Kruskal-Wallis tests were used to compare demographic characteristics among the groups. Other data were analyzed using Wilcoxon rank-sum tests and a mixed-model repeated-measures ANOVA with Bonferroni-corrected pairwise comparisons for tangles, plaques, neuronal counts, and neuronal size, where p < 0.05 was considered significant and p < 0.017 was considered significant with Bonferroni correction. Based on quantification of mean NFTs in rostral anterior cingulate in SuperAgers and control groups, a power analysis showed that, with a sample size of 5 per group, there is 80% power to detect a mean difference of 1.96 SDs assuming a 2-tailed test and a type 1 error rate of 5%. Other markers in anterior regions showed effect sizes that were near 1 SD, indicating adequate power for stereologic analysis. A two-tailed Fisher's exact test was used to analyze differences in ApoE-4 allele frequency across the three groups of samples. Statistical analysis was performed using SAS version 8 software.
Results
Demographics and neuropsychological performance of MRI study participants
Based on selection criteria, SuperAgers and elderly controls did not differ in age or education (p > 0.05; Table 1). χ2 analyses revealed no difference in number of males versus females across groups. According to psychometric and group requirements and based on age and demographically adjusted normative values, there were no significant differences between SuperAger subjects and middle-aged controls in performance on the RAVLT Delay-Recall, Category Fluency, BNT-30, and TMT Part B. Although performance on the MMSE and the TMT Part A were not primary tests used to determine SuperAging group membership, SuperAgers and middle-aged controls showed no difference in performance on either of these two tests, confirming that these two groups were cognitively matched despite their 20- to 30-year age difference. In general, elderly controls performed at lower levels compared with SuperAgers and middle-aged controls on the majority of neuropsychological tests, consistent with typical age-related cognitive decline based on average norms for older individuals. See Table 1 for demographic and neuropsychological testing information with post hoc statistical comparisons.
Apolipoprotein genotype
Apolipoprotein genotypes were available for most of the SuperAgers and elderly control participants within the MRI portion of this study (Table 1). The most extensively documented genetic risk factor for dementia due to Alzheimer neuropathology is the ApoE ε4 allele (Corder et al., 1993; Corder et al., 1994), which is also associated with patterns of cortical atrophy (Geroldi et al., 1999). In our sample, the frequency of ε4 alleles across our two subject groups did not differ statistically (p > 0.05).
MRI ROI cortical thickness findings
Mean cortical thickness values (millimeters; average of left and right hemispheres) from three cingulate ROIs, including rostral anterior (corresponding to prACC), caudal anterior (aMCC), and posterior (pMCC) were extracted and compared across SuperAgers, middle-aged controls, and elderly controls. Overall, mean cingulate thickness was highest in SuperAgers, followed by middle-aged controls and elderly controls (Fig. 2A). Specifically, analyses revealed that in the posterior cingulate, elderly controls showed lower thickness values relative to both SuperAgers (t[67] = 2.70, p = 0.009) and middle-aged controls (t[67] = 2.48, p = 0.016). In caudal anterior regions, elderly controls showed lower thickness measures compared with SuperAgers only (t[67] = 2.72, p = 0.008), despite a trend when compared with middle-aged controls. Interestingly, there was a significant group-by-hemisphere interaction (t[67] = 2.31, p = 0.007): in the right rostral anterior cingulate, thickness was greater in SuperAgers compared with middle-aged controls (t[67] = 3.24, p = 0.002).
Figure 2.

A–C, Cingulate ROI cortical thickness from superagers, middle-aged controls, and elderly controls. A, Bar graphs demonstrate the distribution of mean (average of left and right hemisphere) cortical thickness values in SuperAgers, middle-aged controls, and elderly controls and SE bars are shown. B, C, Scatterplots show individual cortical thickness measures in left hemisphere (LH) and right hemisphere (RH) in all three ROIs across subject groups. Black bars indicate means of each scatterplot column. SuperAger 3 is indicated to emphasize high caudal anterior thickness. *p < 0.05; **p < 0.01.
In general, findings suggest that, compared with SuperAgers and middle-aged controls, typical age-related atrophy occurred only in cognitively average elderly individuals and, despite the 20- to 30-year difference, SuperAgers showed nearly identical or greater thickness compared with middle-aged controls across cingulate ROIs, with right rostral anterior thickness significantly greater in SuperAgers. See Figure 2A for mean cortical thickness measures across cingulate ROIs and Figure 2, B and C, for individual subject thickness measures in each ROI bilaterally across groups.
Relationships between neuropsychological performance and MRI thickness of anterior cingulate
Given MRI findings in our sample of 70 subjects, we undertook a subsequent correlation analysis to determine whether performance on specific measures of cognition were in fact related to anterior cingulate thickness. Two-tailed Pearson correlations were performed to establish relationships between raw performance scores on neuropsychological measures and MRI thickness measures in mean (left + right) anterior cingulate ROIs (rostral anterior and caudal anterior cingulate cortex). As expected based on selection criteria, there was a significant positive correlation between RAVLT raw scores and rostral anterior cingulate thickness (r = 0.262, p = 0.032) and caudal anterior cingulate thickness (r = 0.242, p = 0.049). There was a significant negative correlation (r = −0.285, p = 0.017) between raw scores (time in seconds) on the TMT Part B and mean rostral anterior thickness; that is, slower performance on TMT Part B, a measure of executive functioning, was related to lower values of cortical thickness (i.e., more atrophy). Correlations were driven predominantly by poorer performance achieved by the elderly control group. These findings suggest that cognitive control, an element of executive function, serves as a functional correlate of cingulate integrity in our sample.
Cellular and pathologic findings
Demographic information and postmortem findings
There were no significant differences among postmortem intervals, age at death, and years of education between SuperAgers, cognitively average elderly controls, and aMCI individuals (n = five per group; p > 0.05) from whom postmortem tissue had been obtained for study. The Barona demographic equation was used to derive estimates of premorbid intellectual functioning (Barona et al., 1984); all subjects scored between the average and high average range based on Barona premorbid estimates (M = 100, SD = 15) and there were no statistically significant differences in pairwise comparisons between groups on these demographically based estimates (Table 2).
Table 2.
Postmortem study: case information on SuperAgers, elderly controls, and aMCI subjects
| Case | Age at death (y) | Sex | Education (y) | Cognitive score | Testing obtained ante mortem (mo) | Barona premorbid intelligence (M = 100; SD = 15) | PMI (hours) | ApoE | Brain weight (g) | Braak staging |
|---|---|---|---|---|---|---|---|---|---|---|
| SA 1 | 87 | F | 18 | 13/15a | 4 | 119.13 | 11 | ϵ3/ϵ3 | 1090 | III |
| SA 2 | 90 | F | 14 | 11/15a | 9 | 108.91 | 4.5 | ϵ2/ϵ3 | 1100 | II |
| SA 3 | 90 | F | 18 | 12/15a | 2 | 119.6 | 4 | ϵ3/ϵ3 | 990 | III |
| SA 4 | 81 | F | 18 | 9/10b | 8 | 106.76 | 9.5 | ϵ3/ϵ3 | 1269 | 0 |
| SA 5 | 95 | F | 18 | 49/50c | 12 | 113.81 | 5 | NA | 1241 | 0-I |
| EC 1 | 95 | F | 12 | 6b | 4 | 108.34 | 3.25 | ϵ2/ϵ3 | 1096 | III |
| EC 2 | 89 | F | 16 | 8b | 9 | 116.65 | 9 | ϵ3/ϵ3 | 1180 | II |
| EC 3 | 72 | F | 13–15 | Chart review | Chart review | 110.22 | 7.5 | ϵ3/ϵ3 | 1310 | III-IV |
| EC 4 | 88 | M | 12 | 5b | 11 | 100.81 | 12 | NA | 1250 | III-IV |
| EC 5 | 89 | F | 16 | 8a | 21 | 115.83 | 6 | ϵ2/ϵ3 | 1160 | III-IV |
| aMCI 1 | 89 | F | 18 | 2b | 16 | 103.5 | 4.5 | NA | 1280 | II |
| aMCI 2 | 99 | F | 13 | 1b | 1 | 114.46 | 5 | ϵ3/ϵ3 | 1060 | IV |
| aMCI 3 | 92 | F | 12 | 2b | 7 | 107.08 | 3.5 | ϵ3/ϵ3 | 1084 | IV |
| aMCI 4 | 90 | M | 14 | 2b | 2 | 115.75 | 3 | ϵ3/ϵ3 | 1380 | III |
| aMCI 5 | 92 | M | 16 | 3b | 12 | 118.88 | 4.5 | ϵ3/ϵ4 | 1100 | V |
Cognitive measures were not identical for all participants. Cognitive scores are provided as actual/total possible score.
aDelayed recall score from the RAVLT (Schmidt, 2004).
bDelayed recall score from the Consortium to Establish a Registry for Alzheimer's Disease word list; total possible = 10 (Morris et al., 1989).
cTotal score from the telephone interview for cognitive status (Brandt et al., 1988),[A] which includes immediate and delayed recall of a 10-word list. All subjects were right handed. Braak staging followed published guidelines (Braak and Braak, 1991, 1993).
PMI, Postmortem interval (hours); NA, not available; SA, SuperAgers; EC, elderly controls.
Apolipoprotein genotype
Apolipoprotein genotypes were available for four of five postmortem samples in each subject group. As was shown in the larger MRI portion of the study, the frequency of ε4 alleles across these three subject groups did not differ statistically (p > 0.05). One SuperAger and two age-matched controls carried one ε2 allele and none carried ε4 alleles. Of the aMCI specimens, none carried an ε2 allele and one subject carried one ε4 allele.
Stereological quantitation of NFTs and APs
Thioflavin-S stain provided the material for stereological analyses in three cingulate regions in all 15 subjects (Fig. 3). Mean numerical estimates of AP and NFT density were lowest in SuperAgers, followed by the elderly control (EC) and aMCI groups, across all cingulate regions, with the exception of AP density in aMCC and prACC, which was highest in elderly control subjects. Specifically, statistical analyses revealed significantly lower NFT density in SuperAgers in prACC compared with both EC (z = 2.40, p = 0.014) and aMCI (z = 2.61, p = 0.009), and in aMCC compared with both EC (z = 2.40, p = 0.016) and aMCI (z = 2.61, p = 0.009), with no differences between EC and aMCI groups. No differences were found between groups in pMCC. AP distributions were highly variable across subject groups and across cingulate regions; nevertheless, elderly controls showed significantly more APs compared with SuperAgers in aMCC region (z = 2.40, p = 0.016) and prACC (p < 0.05; Figs. 3, 4A,B). Braak staging showed qualitative differences in tangle densities that generally matched NFT distribution within the cingulate across groups; no cases reached a Braak stage of VI (Table 2).
Figure 3.
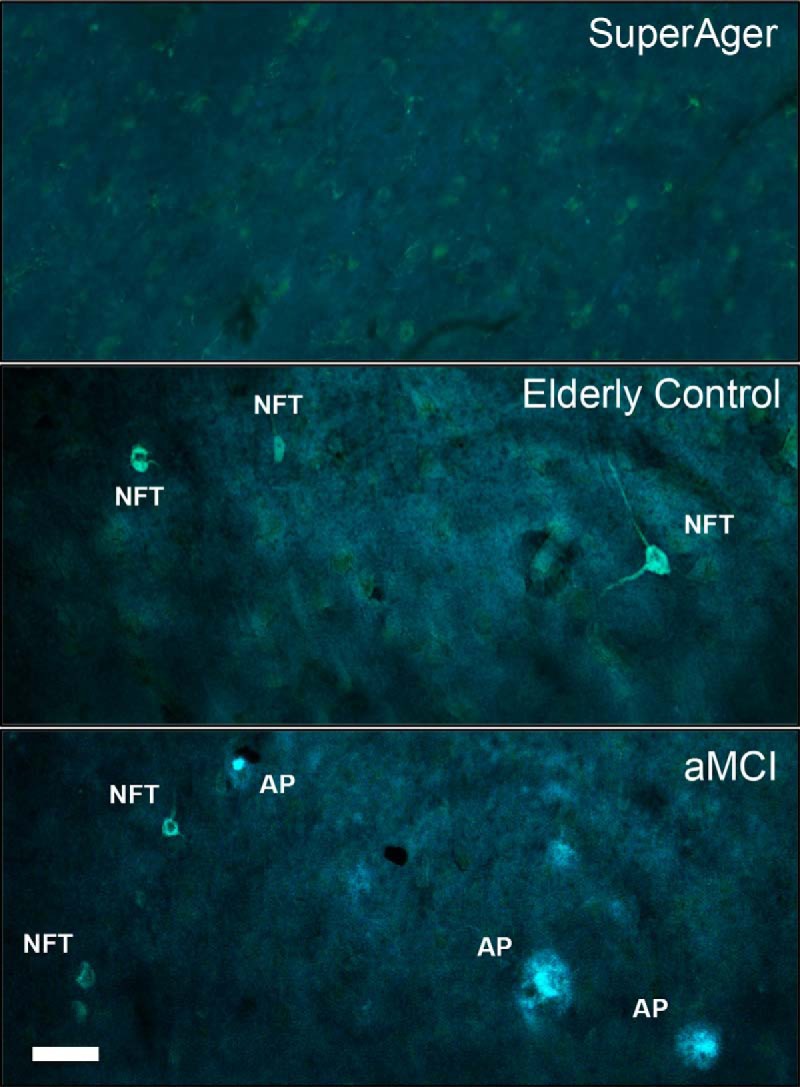
Thioflavin-S staining of NFTs and APs at 20× magnification. The photomicrographs above show no (or extremely sparse) Alzheimer neuropathology (APs and NFTs) in the anterior aspects of cingulate cortex (aMCC) in a 90-year-old SuperAger (SuperAger 3) compared with an age-matched elderly control (middle), and an individual diagnosed clinically with aMCI (bottom). Scale bar in bottom left corner indicates 50 μm at 20×.
Figure 4.

A–F, Heights of the bars represent mean estimated counts of NFTs, APs, VENs, total neurons, and size of neurons, respectively, per cubic millimeter in subject groups (n = 5 per group). A, B, Mean numerical estimates of NFT and AP density were lowest in SuperAgers, followed by the elderly control and aMCI groups across all cingulate regions, with the exception of AP density in aMCC. Significantly lower NFT density in anterior cingulate regions (prACC and aMCC) in SuperAgers compared with the other groups were found, whereas AP density was more variable, with differences reaching statistical significance between SuperAgers and elderly controls in anterior cingulate regions. C, The inverse pattern was demonstrated in VEN counts across regions, where SuperAgers showed highest counts, especially in anterior cingulate regions (aMCC), followed by elderly controls and aMCI individuals. D, There were no differences in total neuronal counts across the subject groups. E, When total neuronal count was accounted for, patterns of VEN distributions (illustrated as the ratio of VEN counts to total neuronal counts) remained similar to the distribution illustrated in VEN counts alone (C); this is due to generally equal counts of total neurons within regions and across groups. F, No differences in total mean neuronal size (area is in mean squared micrometers) across groups were found. *p < 0.05; **p < 0.01.
Quantitation of neuronal number and size
All three groups demonstrated highest VEN counts in the most anterior cingulate regions (prACC) and lowest counts in posterior regions (pMCC) (Fig. 4C). We were struck by the abundance of VENs in most SuperAger cases (Fig. 5), in which they were visibly abundant at 4× magnification. When analyzed stereologically, the ratio of VEN density to total neuronal count was greater in SuperAgers in aMCC compared with the elderly control (p < 0.05) and aMCI (p < 0.05) groups, in which VEN density was ∼3- to 5-fold higher in SuperAgers. In pMCC, aMCI showed significantly lower VEN densities than both the elderly control (z = 2.61, p = 0.009) and SuperAger groups (z = 2.40, p = 0.016). In prACC, aMCI also showed significantly lower VEN densities than elderly controls (z = 2.45, p = 0.014) and SuperAgers (p < 0.05) (Fig. 4E). Similar results held for VEN counts (Fig. 4C). It should be noted that we did not encounter in our investigation any tangle-bearing VENs across specimens. Stereological results revealed no difference in total neuronal count among the three groups (p > 0.05; Fig. 4D); measurement of neuronal size (including VENs and pyramidal neurons) in layer III and V of anterior and posterior regions of the cingulate cortex generated no significant results across areas or subject groups (Fig. 4E).
Figure 5.

A–D, Nissl stain at 20× magnification in aMCC shows higher density of VENS (green arrows) in a SuperAger (A, SuperAger 3) compared with an elderly control (C) and an individual with aMCI (D). Photomicrograph B displays very densely packed VENs in SuperAger 3, clearly visible in abundance at 10× magnification; selected dashed region highlights the same region that is displayed in higher power in 5A. Scale bar in bottom right corner indicates 50 μm in photomicrographs A, C, and D at 20×, and 100 μm in photomicrograph B at 10×.
In one case worth highlighting, SuperAger 3, quantitative MRI scanning and comprehensive neuropsychological testing was obtained within 2.5 months before death. In relation to quantitative in vivo MRI measures, of all middle-aged controls, elderly controls, and SuperAgers (n = 70), SuperAger 3 maintained relatively higher thickness values in all cingulate ROIs; most dramatically, this subject showed the thickest right hemisphere aMCC of all 70 subjects (Fig. 2C). Consistent with the anatomy of cortical thickness in this area, this case also showed the highest number of VEN counts of all SuperAgers, elderly controls, and aMCI postmortem samples (n = 15, total) in aMCC (Fig. 5). Overall neuronal density was not at the higher end of the distribution relative to other samples. NFTs and AP counts were among the lowest in this cingulate area relative to the other 15 postmortem specimens (Fig. 3). This particular SuperAger case emphasizes the possible concordance of histopathologic features and in vivo MRI measures of cortical thickness in anterior cingulate regions.
Discussion
This study is based on a selected group of healthy persons at or over the age of 80 years identified as “SuperAgers” on the basis of memory test scores at least as high as scores obtained by healthy 50 to 65 year olds, and with performance levels in other cognitive domains at least average for age. Our assumption has been that this group is likely to be enriched in individuals who are resilient to age-related involutional changes and that investigations of this group may reveal factors that are relevant to this resilience. The present study is focused on the cingulate cortex, which was shown in our preliminary whole-brain MRI investigation to be particularly free of age-related cortical thinning and to be significantly thicker in anterior cingulate regions in the brains of SuperAgers compared with individuals 20–30 years their junior (Harrison et al., 2012). We first investigated whether this observation could be confirmed in a larger group of subjects and if its anatomy could be defined more precisely. We then investigated whether this region had less vulnerability to the age-related appearance of Alzheimer-spectrum neurodegenerative markers and sought to identify a possible neural substrate for the apparently greater thickness of anterior cingulate cortex in SuperAgers.
The cingulate cortex has attracted a great deal of attention within the context of the aging-MCI-Alzheimer dementia spectrum. Atrophy (Chételat et al., 2002), hypoperfusion (Johnson et al., 1998; Huang et al., 2002), amyloid load, and neurofibrillary degeneration (Braak and Braak, 1991; Chu et al., 1997) in this region have been linked to cognitive decline associated with MCI and dementia of the Alzheimer's type. Consistent with earlier findings (Harrison et al., 2012), the elderly control group in our sample showed the expected age-related thinning of the cingulate cortex compared with the middle-aged control group. This age effect was not seen in the SuperAgers. They showed cortical thickness values across most cingulate ROIs that were similar to those of the middle-aged group, except in the rostral anterior cingulate region of the right hemisphere, where cortical thickness was the greatest in SuperAgers. It is well documented that patterns of cingulate atrophy function as a predictor of progression to dementia (Whitwell et al., 2008; Tosun et al., 2011; Dickerson and Wolk, 2013). In these contexts, it is tempting to speculate that the inverse phenomenon of preserved or unusually high cortical thickness in cingulate regions may contribute to preserved cognitive functioning in old age. Functionally, anterior cingulate is indirectly related to episodic memory through its influence on related functions such as cognitive control, conflict resolution, motivation, and perseverance (Devinsky et al., 1995; Carter et al., 1999; Carter and van Veen, 2007). Our correlation analyses that showed positive relationships between TMT Part B and mean rostral anterior cingulate thickness further suggest that well preserved executive function (cognitive control) is functionally correlated with cingulate integrity that may serve to facilitate more efficient memory processes. Our study focuses on the cingulate cortex, but in the absence of in-depth analyses of other key paralimbic and limbic regions, the true uniqueness of cingulate architecture and function cannot be fully characterized and, in this context, future clinicopathologic studies are needed to underscore the uniqueness of the cingulate in SuperAging.
Numerous studies have shown that NFTs frequently emerge in the course of “normal” aging, that they become increasingly more prominent in aMCI, and that their densities are correlated with cognitive performance (Arriagada et al., 1992; Gómez-Isla et al., 1997; Mesulam, 1999; Guillozet et al., 2003; Balasubramanian et al., 2012). The NFT density in the anterior cingulate region (prACC and aMCC) was lower in SuperAgers than in cognitively average elderly controls and individuals with aMCI, suggesting that resistance to the well known age-related emergence of Alzheimer-type neurofibrillary pathology may promote the preservation of memory function in advanced age. Because the anterior cingulate cortex is a paralimbic region that provides a site for interactions between the limbic system and high-order association cortex (Pandya et al., 1981), its integrity may promote effective memory function through its known importance in various aspects of complex attention and cognitive control (Devinsky et al., 1995; Carter et al., 1999; Bush et al., 2000; van Veen et al., 2001). Unexpectedly, APs had the greatest density in elderly individuals identified as cognitively normal. This last result is consistent with multiple reports showing that AP density is poorly correlated with cognitive state (Arriagada et al., 1992; Bobinski et al., 1996; Guillozet et al., 2003; Nelissen et al., 2007).
Neither neuronal counts nor neuronal size differences could account for the greater thickness of the anterior cingulate region in SuperAgers. This finding is consistent with other studies showing that neuronal number (Freeman et al., 2008) and size (Peters, 2002; Riudavets et al., 2007) do not necessarily vary with changes in age-related brain structure or cognition. We did not quantitate capillaries, glia, or myelin and therefore cannot comment on their possible contributions to the observed differences of cortical thickness. The one potential factor we identified was the VENs, which displayed the greatest number and density in the anterior cingulate of SuperAgers. VENs comprise a peculiar set of spindle-shaped neurons confined to anterior paralimbic areas such as the anterior cingulate and frontoinsular regions (Allman et al., 2001; Allman et al., 2010). The proposed functional correlates of VENs are speculative, based mostly on descriptive studies of comparative neuroanatomy (Allman et al., 2010; Butti et al., 2013; Seeley et al., 2012). The detection of these neurons predominantly in great apes, hominids, and cetaceans (Hof and Van der Gucht, 2007) has led to the suggestion that they have selectively emerged in species with complex behavioral repertoires and that they play a critical role in the rapid transmission of behaviorally relevant contextual information related to social interactions (Hakeem et al., 2009). The most recent findings of VENs in macaques (Evrard et al., 2012) and a more diverse array of terrestrial mammals (Raghanti et al., 2014) suggest that, in the near future, hypotheses about VEN function may be in fact testable. In humans, there is considerable evidence for the vulnerability of VENs in neurodegenerative disorders such as the behavioral variant of frontotemporal dementia (Seeley et al., 2006; Kim et al., 2012; Santillo et al., 2013). In contrast to other studies, which have reported that the VENs are spared in AD (Seeley et al., 2006), our results in the aMCI sample show that VENs may be vulnerable to Alzheimer-type neurodegeneration as well. The mechanism of this putative vulnerability appears independent from neurofibrillary degeneration because we did not identify tangle-bearing VENs in the aMCI sample. It should be mentioned that it is possible that methodological differences, including sample size, precise sampling location, and/or clinical criteria all account for the inconsistencies between studies. Future experiments with larger sample sizes and more comprehensive focus on morphometric and histologic properties of other limbic regions in both demented and successful agers will be imperative to challenge questions of selective vulnerability.
Conclusions
Our findings seem to converge toward the conclusion that the cognitively defined SuperAger phenotype has a biological signature (Harrison et al., 2012; Rogalski et al., 2013; Gefen et al., 2014). The present investigation was focused on the cingulate cortex of SuperAgers, their cognitively average peers of the same age, healthy middle agers, and persons with the mild cognitive impairment stage of Alzheimer pathology. We found that anterior parts of the cingulate cortex were the thickest in SuperAgers, that this region contained the least density of neurofibrillary degeneration, and that it contained the highest number of VENs. These features of the SuperAger biological signature may provide a foundation for future exploration of the factors that promote resistance to age-related involutional phenomena.
Footnotes
This project was supported by a grant from the National Institute on Aging, National Institutes of Health (NIH Grant AG045571), The Davee Foundation, the Northwestern University Alzheimer's Disease Core Center grant from the National Institute on Aging (Grant AG13854), an NRSA fellowship from the National Institute on Aging (Grant F31-AG043270), the American Psychological Foundation (Grant 5UL1RR025741 now at the National Center for Advancing Translational Sciences Grant 8UL1TR000150), and an Early Investigator Grant from the Alzheimer's Disease Research Fund, Illinois Department of Public Health. Data collection and sharing for this project was funded by the Alzheimer's Disease Neuroimaging Initiative (ADNI; NIH Grant U01 AG024904) and Department of Defense ADNI (Grant W81XWH-12-2-0012). ADNI is funded by the National Institute on Aging, the National Institute of Biomedical Imaging and Bioengineering, and through generous contributions from the following: Alzheimer's Association; Alzheimer's Drug Discovery Foundation; BioClinica, Inc.; Biogen Idec; Bristol-Myers Squibb Company; Eisai; Elan Pharmaceuticals; Eli Lilly and Company; F. Hoffmann-La Roche and its affiliated company Genentech; GE Healthcare; Innogenetics; IXICO; Janssen Alzheimer Immunotherapy Research and Development; Johnson and Johnson Pharmaceutical Research and Development; Medpace; Merck; Meso Scale Diagnostics; NeuroRx Research; Novartis Pharmaceuticals; Pfizer; Piramal Imaging; Servier; Synarc; and Takeda Pharmaceutical. The Canadian Institutes of Health Research is providing funds to support ADNI clinical sites in Canada. Private sector contributions are facilitated by the Foundation for the National Institutes of Health (www.fnih.org). The grantee organization is the Northern California Institute for Research and Education and the study is coordinated by the Alzheimer's Disease Cooperative Study at the University of California, San Diego. ADNI data are disseminated by the Laboratory for Neuroimaging at the University of Southern California.
The authors declare no competing financial interests.
Data used in preparation of this article were obtained from the Alzheimer's Disease Neuroimaging Initiative (ADNI) database (adni.loni.usc.edu). As such, the investigators within the ADNI contributed to the design and implementation of ADNI and/or provided data but did not participate in analysis or writing of this report. A complete listing of ADNI investigators can be found at: http://adni.loni.usc.edu/wp-content/uploads/how_to_apply/ADNI_Acknowledgement_List.pdf.
References
- Albert MS, DeKosky ST, Dickson D, Dubois B, Feldman HH, Fox NC, Gamst A, Holtzman DM, Jagust WJ, Petersen RC, Snyder PJ, Carrillo MC, Thies B, Phelps CH. The diagnosis of mild cognitive impairment due to Alzheimer's disease: recommendations from the National Institute on Aging-Alzheimer's Association workgroups on diagnostic guidelines for Alzheimer's disease. Alzheimers Dement. 2011;7:270–279. doi: 10.1016/j.jalz.2011.03.008. [DOI] [PMC free article] [PubMed] [Google Scholar]
- Allman JM, Hakeem A, Erwin JM, Nimchinsky E, Hof P. The anterior cingulate cortex. Ann N Y Acad Sci. 2001;935:107–117. doi: 10.1111/j.1749-6632.2001.tb03476.x. [DOI] [PubMed] [Google Scholar]
- Allman JM, Tetreault NA, Hakeem AY, Manaye KF, Semendeferi K, Erwin JM, Park S, Goubert V, Hof PR. The von Economo neurons in frontoinsular and anterior cingulate cortex in great apes and humans. Brain Structure and Function. 2010;214:495–517. doi: 10.1007/s00429-010-0254-0. [DOI] [PubMed] [Google Scholar]
- Arriagada PV, Growdon JH, Hedley-Whyte ET, Hyman BT. Neurofibrillary tangles but not senile plaques parallel duration and severity of Alzheimer's disease. Neurology. 1992;42:631–639. doi: 10.1212/WNL.42.3.631. [DOI] [PubMed] [Google Scholar]
- Balasubramanian AB, Kawas CH, Peltz CB, Brookmeyer R, Corrada MM. Alzheimer disease pathology and longitudinal cognitive performance in the oldest-old with no dementia. Neurology. 2012;79:915–921. doi: 10.1212/WNL.0b013e318266fc77. [DOI] [PMC free article] [PubMed] [Google Scholar]
- Barona A, Reynolds CR, Chastain R. A demographically based index of premorbid intelligence for the WAIS-R. Journal of Consulting and Clinical Psychology. 1984;52:885–887. doi: 10.1037/0022-006X.52.5.885. [DOI] [Google Scholar]
- Bobinski M, Wegiel J, Wisniewski HM, Tarnawski M, Bobinski M, Reisberg B, De Leon MJ, Miller DC. Neurofibrillary pathology–Correlation with hippocampal formation atrophy in Alzheimer disease. Neurobiol Aging. 1996;17:909–919. doi: 10.1016/s0197-4580(97)85095-6. [DOI] [PubMed] [Google Scholar]
- Braak H, Braak E. Neuropathological stageing of Alzheimer-related changes. Acta Neuropathol. 1991;82:239–259. doi: 10.1007/BF00308809. [DOI] [PubMed] [Google Scholar]
- Braak H, Braak E, Bohl J. Staging of Alzheimer-related cortical destruction. Eur Neurol. 1993;33:403–408. doi: 10.1159/000116984. [DOI] [PubMed] [Google Scholar]
- Bush G, Luu P, Posner MI. Cognitive and emotional influences in anterior cingulate cortex. Trends Cogn Sci. 2000;4:215–222. doi: 10.1016/S1364-6613(00)01483-2. [DOI] [PubMed] [Google Scholar]
- Butti C, Santos M, Uppal N, Hof PR. Von Economo neurons: clinical and evolutionary perspectives. Cortex. 2013;49:312–326. doi: 10.1016/j.cortex.2011.10.004. [DOI] [PubMed] [Google Scholar]
- Carter CS, van Veen V. Anterior cingulate cortex and conflict detection: an update of theory and data. Cogn Affect Behav Neurosci. 2007;7:367–379. doi: 10.3758/CABN.7.4.367. [DOI] [PubMed] [Google Scholar]
- Carter CS, Botvinick MM, Cohen JD. The contribution of the anterior cingulate cortex to executive processes in cognition. Rev Neurosci. 1999;10:49–57. doi: 10.1515/revneuro.1999.10.1.49. [DOI] [PubMed] [Google Scholar]
- Chételat G, Desgranges B, De La Sayette V, Viader F, Eustache F, Baron JC. Mapping gray matter loss with voxel-based morphometry in mild cognitive impairment. Neuroreport. 2002;13:1939–1943. doi: 10.1097/00001756-200210280-00022. [DOI] [PubMed] [Google Scholar]
- Chu CC, Tranel D, Damasio AR, Van Hoesen GW. The autonomic-related cortex: pathology in Alzheimer's disease. Cereb Cortex. 1997;7:86–95. doi: 10.1093/cercor/7.1.86. [DOI] [PubMed] [Google Scholar]
- Corder EH, Saunders AM, Strittmatter WJ, Schmechel DE, Gaskell PC, Small GW, Roses AD, Haines JL, Pericak-Vance MA. Gene dose of apolipoprotein E type 4 allele and the risk of Alzheimer's disease in late onset families. Science. 1993;261:921–923. doi: 10.1126/science.8346443. [DOI] [PubMed] [Google Scholar]
- Corder EH, Saunders AM, Risch NJ, Strittmatter WJ, Schmechel DE, Gaskell PC, Jr, Rimmler JB, Locke PA, Conneally PM, Schmader KE. Protective effect of apolipoprotein E type 2 allele for late onset Alzheimer disease. Nat Genet. 1994;7:180–184. doi: 10.1038/ng0694-180. [DOI] [PubMed] [Google Scholar]
- Desikan RS, Ségonne F, Fischl B, Quinn BT, Dickerson BC, Blacker D, Buckner RL, Dale AM, Maguire RP, Hyman BT, Albert MS, Killiany RJ. An automated labeling system for subdividing the human cerebral cortex on MRI scans into gyral based regions of interest. Neuroimage. 2006;31:968–980. doi: 10.1016/j.neuroimage.2006.01.021. [DOI] [PubMed] [Google Scholar]
- Devinsky O, Morrell MJ, Vogt BA. Contributions of anterior cingulate cortex to behaviour. Brain. 1995;118:279–306. doi: 10.1093/brain/118.1.279. [DOI] [PubMed] [Google Scholar]
- Dickerson BC, Wolk DA Alzheimer's Disease Neuroimaging Initiative. Biomarker-based prediction of progression in MCI: Comparison of AD signature and hippocampal volume with spinal fluid amyloid-beta and tau. Front Aging Neurosci. 2013;5:55. doi: 10.3389/fnagi.2013.00055. [DOI] [PMC free article] [PubMed] [Google Scholar]
- Dickerson BC, Fenstermacher E, Salat DH, Wolk DA, Maguire RP, Desikan R, Pacheco J, Quinn BT, Van der Kouwe A, Greve DN, Blacker D, Albert MS, Killiany RJ, Fischl B. Detection of cortical thickness correlates of cognitive performance: Reliability across MRI scan sessions, scanners, and field strengths. Neuroimage. 2008;39:10–18. doi: 10.1016/j.neuroimage.2007.08.042. [DOI] [PMC free article] [PubMed] [Google Scholar]
- Evrard HC, Forro T, Logothetis NK. Von Economo neurons in the anterior insula of the macaque monkey. Neuron. 2012;74:482–489. doi: 10.1016/j.neuron.2012.03.003. [DOI] [PubMed] [Google Scholar]
- Fischl B, Dale AM. Measuring the thickness of the human cerebral cortex from magnetic resonance images. Proc Natl Acad Sci U S A. 2000;97:11050–11055. doi: 10.1073/pnas.200033797. [DOI] [PMC free article] [PubMed] [Google Scholar]
- Folstein MF, Folstein SE, McHugh PR. Mini-mental state: A practical method for grading the cognitive state of patients for the clinician. J Psychiatr Res. 1975;12:189–198. doi: 10.1016/0022-3956(75)90026-6. [DOI] [PubMed] [Google Scholar]
- Freeman SH, Kandel R, Cruz L, Rozkalne A, Newell K, Frosch MP, Hedley-Whyte ET, Locascio JJ, Lipsitz LA, Hyman BT. Preservation of neuronal number despite age-related cortical brain atrophy in elderly subjects without Alzheimer disease. J Neuropathol Exp Neurol. 2008;67:1205–1212. doi: 10.1097/NEN.0b013e31818fc72f. [DOI] [PMC free article] [PubMed] [Google Scholar]
- Gefen T, Shaw E, Whitney K, Martersteck A, Stratton J, Rademaker A, Weintraub S, Mesulam MM, Rogalski E. Longitudinal neuropsychological performance of cognitive superagers. J Am Geriatr Soc. 2014;62:1598–1600. doi: 10.1111/jgs.12967. [DOI] [PMC free article] [PubMed] [Google Scholar]
- Geroldi C, Pihlajamäki M, Laakso MP, DeCarli C, Beltramello A, Bianchetti A, Soininen H, Trabucchi M, Frisoni GB. APOE-epsilon4 is associated with less frontal and more medial temporal lobe atrophy in AD. Neurology. 1999;53:1825–1832. doi: 10.1212/WNL.53.8.1825. [DOI] [PubMed] [Google Scholar]
- Geula C, Bu J, Nagykery N, Scinto LF, Chan J, Joseph J, Parker R, Wu CK. Loss of calbindin-D28k from aging human cholinergic basal forebrain: relation to neuronal loss. J Comp Neurol. 2003;455:249–259. doi: 10.1002/cne.10475. [DOI] [PubMed] [Google Scholar]
- Gómez-Isla T, Hollister R, West H, Mui S, Growdon JH, Petersen RC, Parisi JE, Hyman BT. Neuronal loss correlates with but exceeds neurofibrillary tangles in Alzheimer's disease. Ann Neurol. 1997;41:17–24. doi: 10.1002/ana.410410106. [DOI] [PubMed] [Google Scholar]
- Guillozet AL, Weintraub S, Mash DC, Mesulam MM. Neurofibrillary tangles, amyloid, and memory in aging and mild cognitive impairment. Arch Neurol. 2003;60:729–736. doi: 10.1001/archneur.60.5.729. [DOI] [PubMed] [Google Scholar]
- Hakeem AY, Sherwood CC, Bonar CJ, Butti C, Hof PR, Allman JM. Von Economo neurons in the elephant brain. Anat Rec (Hoboken) 2009;292:242–248. doi: 10.1002/ar.20829. [DOI] [PubMed] [Google Scholar]
- Harrison TM, Weintraub S, Mesulam MM, Rogalski E. Superior memory and higher cortical volumes in unusually successful cognitive aging. J Int Neuropsychol Soc. 2012;18:1081–1085. doi: 10.1017/S1355617712000847. [DOI] [PMC free article] [PubMed] [Google Scholar]
- Heaton R, Miller S, Taylor M, Grant I. Revised comprehensive norms for an expanded Halstead-Reitan Battery: demographically adjusted neuropsychological norms for African American and Caucasian adults. Lutz, Florida: Psychological Assessment Resources; 2004. [Google Scholar]
- Hof PR, Van der Gucht E. Structure of the cerebral cortex of the humpback whale, Megaptera novaeangliae (Cetacea, Mysticeti, Balaenopteridae) Anat Rec (Hoboken) 2007;290:1–31. doi: 10.1002/ar.20407. [DOI] [PubMed] [Google Scholar]
- Huang C, Wahlund LO, Svensson L, Winblad B, Julin P. Cingulate cortex hypoperfusion predicts Alzheimer's disease in mild cognitive impairment. BMC Neurol. 2002;2:9. doi: 10.1186/1471-2377-2-9. [DOI] [PMC free article] [PubMed] [Google Scholar]
- Ivnik RJ, Malec JF, Smith GE, Tangalos EG, Petersen RC. Neuropsychological tests' norms above age 55: COWAT, BNT, MAE token, WRAT-R reading, AMNART, STROOP, TMT, and JLO. The Clinical Neuropsychologist. 1996;10:262–278. doi: 10.1080/13854049608406689. [DOI] [Google Scholar]
- Jack CR, Jr, Bernstein MA, Fox NC, Thompson P, Alexander G, Harvey D, Borowski B, Britson PJ, L Whitwell J, Ward C, Dale AM, Felmlee JP, Gunter JL, Hill DL, Killiany R, Schuff N, Fox-Bosetti S, Lin C, Studholme C, DeCarli CS, et al. The Alzheimer's Disease Neuroimaging Initiative (ADNI): MRI methods. JMRI. 2008;27:685–691. doi: 10.1002/jmri.21049. [DOI] [PMC free article] [PubMed] [Google Scholar]
- Jack CR, Jr, Knopman DS, Jagust WJ, Petersen RC, Weiner MW, Aisen PS, Shaw LM, Vemuri P, Wiste HJ, Weigand SD, Lesnick TG, Pankratz VS, Donohue MC, Trojanowski JQ. Tracking pathophysiological processes in Alzheimer's disease: an updated hypothetical model of dynamic biomarkers. Lancet Neurol. 2013;12:207–216. doi: 10.1016/S1474-4422(12)70291-0. [DOI] [PMC free article] [PubMed] [Google Scholar]
- Johnson KA, Jones K, Holman BL, Becker JA, Spiers PA, Satlin A, Albert MS. Preclinical prediction of Alzheimer's disease using SPECT. Neurology. 1998;50:1563–1571. doi: 10.1212/WNL.50.6.1563. [DOI] [PubMed] [Google Scholar]
- Kim EJ, Sidhu M, Gaus SE, Huang EJ, Hof PR, Miller BL, DeArmond SJ, Seeley WW. Selective frontoinsular von Economo neuron and fork cell loss in early behavioral variant frontotemporal dementia. Cereb Cortex. 2012;22:251–259. doi: 10.1093/cercor/bhr004. [DOI] [PMC free article] [PubMed] [Google Scholar]
- Mesulam MM. Neuroplasticity failure in Alzheimer's disease: bridging the gap between plaques and tangles. Neuron. 1999;24:521–529. doi: 10.1016/S0896-6273(00)81109-5. [DOI] [PubMed] [Google Scholar]
- Morris JC, Heyman A, Mohs RC, Hughes JP, van Belle G, Fillenbaum G, Mellits ED, Clark C. The Consortium to Establish a Registry for Alzheimer's Disease (CERAD). Part I. Clinical and neuropsychological assessment of Alzheimer's disease. Neurology. 1989;39:1159–1165. doi: 10.1212/WNL.39.9.1159. [DOI] [PubMed] [Google Scholar]
- Nelissen N, Vandenbulcke M, Fannes K, Verbruggen A, Peeters R, Dupont P, Van Laere K, Bormans G, Vandenberghe R. Abeta amyloid deposition in the language system and how the brain responds. Brain. 2007;130:2055–2069. doi: 10.1093/brain/awm133. [DOI] [PubMed] [Google Scholar]
- Nimchinsky EA, Vogt BA, Morrison JH, Hof PR. Spindle neurons of the human anterior cingulate cortex. J Comp Neurol. 1995;355:27–37. doi: 10.1002/cne.903550106. [DOI] [PubMed] [Google Scholar]
- Pandya DN, Van Hoesen GW, Mesulam MM. Efferent connections of the cingulate gyrus in the rhesus monkey. Exp Brain Res. 1981;42:319–330. doi: 10.1007/BF00237497. [DOI] [PubMed] [Google Scholar]
- Peters A. Structural changes that occur during normal aging of primate cerebral hemispheres. Neurosci Biobehav Rev. 2002;26:733–741. doi: 10.1016/S0149-7634(02)00060-X. [DOI] [PubMed] [Google Scholar]
- Raghanti MA, Spurlock LB, Robert Treichler F, Weigel SE, Stimmelmayr R, Butti C, Hans Thewissen JG, Hof PR. An analysis of von Economo neurons in the cerebral cortex of cetaceans, artiodactyls, and perissodactyls. Brain Struct Funct. 2014 doi: 10.1007/s00429-014-0792-y. In press. [DOI] [PubMed] [Google Scholar]
- Reitan RM. Validity of the Trail Making Test as an indicator of organic brain damage. Perceptual and Motor Skills. 1958;8:271–276. [Google Scholar]
- Riudavets MA, Iacono D, Resnick SM, O'Brien R, Zonderman AB, Martin LJ, Rudow G, Pletnikova O, Troncoso JC. Resistance to Alzheimer's pathology is associated with nuclear hypertrophy in neurons. Neurobiol Aging. 2007;28:1484–1492. doi: 10.1016/j.neurobiolaging.2007.05.005. [DOI] [PMC free article] [PubMed] [Google Scholar]
- Rogalski EJ, Gefen T, Shi J, Samimi M, Bigio E, Weintraub S, Geula C, Mesulam MM. Youthful memory capacity in old brains: anatomic and genetic clues from the Northwestern SuperAging Project. J Cogn Neurosci. 2013;25:29–36. doi: 10.1162/jocn_a_00300. [DOI] [PMC free article] [PubMed] [Google Scholar]
- Salat DH, Buckner RL, Snyder AZ, Greve DN, Desikan RS, Busa E, Morris JC, Dale AM, Fischl B. Thinning of the cerebral cortex in aging. Cereb Cortex. 2004;14:721–730. doi: 10.1093/cercor/bhh032. [DOI] [PubMed] [Google Scholar]
- Salthouse TA. When does age-related cognitive decline begin? Neurobiol Aging. 2009;30:507–514. doi: 10.1016/j.neurobiolaging.2008.09.023. [DOI] [PMC free article] [PubMed] [Google Scholar]
- Santillo AF, Nilsson C, Englund E. von Economo neurones are selectively targeted in frontotemporal dementia. Neuropathol Appl Neurobiol. 2013;39:572–579. doi: 10.1111/nan.12021. [DOI] [PMC free article] [PubMed] [Google Scholar]
- Saxton J, Ratcliff G, Munro CA, Coffey EC, Becker JT, Fried L, Kuller L. Normative data on the Boston Naming Test and two equivalent 30-item short forms. Clin Neuropsychol. 2000;14:526–534. doi: 10.1076/clin.14.4.526.7204. [DOI] [PubMed] [Google Scholar]
- Schmidt M. Rey Auditory Verbal Learning Test: A Handbook. Los Angeles: Western Psychological Services; 2004. [Google Scholar]
- Seeley WW, Carlin DA, Allman JM, Macedo MN, Bush C, Miller BL, Dearmond SJ. Early frontotemporal dementia targets neurons unique to apes and humans. Ann Neurol. 2006;60:660–667. doi: 10.1002/ana.21055. [DOI] [PubMed] [Google Scholar]
- Seeley WW, Merkle FT, Gaus SE, Craig AD, Allman JM, Hof PR, Economo CV. Distinctive neurons of the anterior cingulate and frontoinsular cortex: a historical perspective. Cereb Cortex. 2012;22:245–250. doi: 10.1093/cercor/bhr005. [DOI] [PubMed] [Google Scholar]
- Shirk SD, Mitchell MB, Shaughnessy LW, Sherman JC, Locascio JJ, Weintraub S, Atri A. A web-based normative calculator for the uniform data set (UDS) neuropsychological test battery. Alzheimers Res Ther. 2011;3:32. doi: 10.1186/alzrt94. [DOI] [PMC free article] [PubMed] [Google Scholar]
- Tosun D, Schuff N, Mathis CA, Jagust W, Weiner MW Alzheimer's Disease NeuroImaging Initiative. Spatial patterns of brain amyloid-beta burden and atrophy rate associations in mild cognitive impairment. Brain. 2011;134:1077–1088. doi: 10.1093/brain/awr044. [DOI] [PMC free article] [PubMed] [Google Scholar]
- van Veen V, Cohen JD, Botvinick MM, Stenger VA, Carter CS. Anterior cingulate cortex, conflict monitoring, and levels of processing. Neuroimage. 2001;14:1302–1308. doi: 10.1006/nimg.2001.0923. [DOI] [PubMed] [Google Scholar]
- Vogt BA. Cingulate neuorbiology and disease. London: Oxford UP; 2009. [Google Scholar]
- Watson KK, Jones TK, Allman JM. Dendritic architecture of the von Economo neurons. Neuroscience. 2006;141:1107–1112. doi: 10.1016/j.neuroscience.2006.04.084. [DOI] [PubMed] [Google Scholar]
- Weintraub S, Wicklund AH, Salmon DP. The neuropsychological profile of Alzheimer disease. Cold Spring Harb Perspect Med. 2012;2:a006171. doi: 10.1101/cshperspect.a006171. [DOI] [PMC free article] [PubMed] [Google Scholar]
- Whitwell JL, Shiung MM, Przybelski SA, Weigand SD, Knopman DS, Boeve BF, Petersen RC, Jack CR., Jr MRI patterns of atrophy associated with progression to AD in amnestic mild cognitive impairment. Neurology. 2008;70:512–520. doi: 10.1212/01.wnl.0000280575.77437.a2. [DOI] [PMC free article] [PubMed] [Google Scholar]
- Yao Z, Hu B, Liang C, Zhao L, Jackson M Alzheimer's Disease Neuroimaging Initiative. A longitudinal study of atrophy in amnestic mild cognitive impairment and normal aging revealed by cortical thickness. PLoS One. 2012;7:e48973. doi: 10.1371/journal.pone.0048973. [DOI] [PMC free article] [PubMed] [Google Scholar]