

Abstract
B-cell chronic lymphocytic leukemia (B-CLL) is one of the most common leukemias among the elderly and, despite many efforts, still stays incurable. Recent studies point to the microenvironment as the critical factor providing leukemic lymphocytes with pro-survival signals. Thus, the neighboring cells appear to be a perfect target for antileukemic therapy. Nurse-like cells (NLCs) largely contribute to CLL microenvironmental support. We developed the CLL lymphocyte/NLC co-culture model for the investigation of microenvironmental interactions. Viability and apoptosis were investigated in CLL lymphocytes treated with dexamethasone (DEX) and chlorambucil (CLB), with and without NLCs’ support. For the first time, the capacity of DEX and CLB to affect NLCs viability was also evaluated. Apoptosis-associated gene expression profiles of leukemic lymphocytes ex vivo and cultured with NLCs were assessed by expression arrays. CLL lymphocytes escaped spontaneous apoptosis for several months when cultured with NLCs. The presence of NLCs significantly reduced apoptosis induced with DEX and CLB (p < 0.001; p = 0.012, respectively), and their protective effect was more evident than the effect of recombinant SDF1. Both DEX and CLB also decreased NLCs viability, but to a lesser extent (mean viability in DEX-treated cultures was 37.79 % in NLCs compared to 29.24 % in lymphocytes). NLCs induced the expression of important anti-apoptotic genes in cultured CLL lymphocytes; median expression of BCL2, SURVIVIN, BCL2A1, and XIAP was significantly higher as compared to ex vivo status. The CLL lymphocyte/NLC co-culture makes up the convenient and close to the natural-state model for studying the relationship between leukemic cells and the microenvironment. Direct cell-to-cell contact with NLCs increases the expression of anti-apoptotic genes in CLL lymphocytes, thus protecting them against induced apoptosis. As the effect of antileukemic drugs is not so apparent in NLCs, the combined therapy targeted at both lymphocytes and the microenvironment should be considered for CLL patients. Simultaneous aiming at the disruption of several different signaling pathways and/or anti-apoptotic proteins may further improve treatment efficiency.
Electronic supplementary material
The online version of this article (doi:10.1007/s10238-013-0268-z) contains supplementary material, which is available to authorized users.
Keywords: CLL, Nurse-like cells, Microenvironment, Apoptosis, Gene expression profiling
Introduction
B-cell chronic lymphocytic leukemia (B-CLL) is characterized by an accumulation of leukemic lymphocytes in peripheral blood, bone marrow, and lymphatic organs [1]. Increase in lymphocyte number is due both to decreased apoptosis and to slightly increased proliferation of B cells observed in proliferation centers [2]. Once isolated from circulation, leukemic cells die rapidly by apoptosis, which suggests that not only their intrinsic properties contribute to the prolonged survival. Indeed, growing evidence confirms the importance of microenvironmental signals for leukemic lymphocyte growth and resistance to the therapy [2].
CLL microenvironment is composed of cells of different origin, including activated T lymphocytes, dendritic cells, stromal cells, endothelial cells, and nurse-like cells (NLCs) [3]. The latter were named after thymic nurse cells, which were found to be necessary for proper maturation and differentiation of thymocytes [4]. CLL nurse-like cells were first described by Burger et al. in 2000 [5]. They differentiate from peripheral blood monocytes of CLL patients in in vitro cultures, but were also found in vivo, within pseudo follicles present in tissue infiltrates [6]. In vitro, NLCs protect leukemic cells against spontaneous apoptosis by producing chemokines and interleukins, i.e., SDF1, IL8, CCL2, CXCL9, and by direct cell-to-cell contact [5, 7–9]. Recently, we characterized the gene expression pattern of NLCs and stated that they resemble tumor-associated macrophages (TAMs), which support growth of solid tumor cells and thus may influence the prognosis [9].
The discovery of the role played by microenvironment in CLL development and course resulted in intensive research in this field, mainly aimed at disrupting the pro-survival signalization pathways. Many models mimicking the interactions between CLL cells and their microenvironment were proposed for this purpose. However, the cells used to date resemble CLL environment only in some aspects [10]. Here, we developed the natural model for investigation, which utilizes NLCs grown from peripheral blood of CLL patients, and we compared it with non-cell model of culture supplemented with SDF1, which is considered as the most important NLC-derived chemokine [5]. We also assessed the viability of lymphocytes cultured as such after exposure to two drugs of different mechanisms of action: dexamethasone and chlorambucil. We were the first to evaluate the sensitivity of NLCs to these antileukemic agents. Finally, we have analyzed gene expression pattern of CLL lymphocytes cultured with NLCs with special focus on anti-apoptotic genes and compared it to ex vivo status.
Methods
Patients
With informed consent, in accordance with the Declaration of Helsinki and approval from the Medical University Bioethics Committee, peripheral blood was obtained from 35 previously untreated patients, hospitalized at the Department of Hematooncology and Bone Marrow Transplantation, Medical University of Lublin. Five patients were excluded because less than 15 NLCs/mm2 was obtained in the culture. Among the remaining 30, there were 10 women and 20 men, aged 36–80 years (median 68.5), diagnosed with B-CLL according to standard criteria [11]. According to Rai classification, 5 patients were at stage 0 (16.6 %), 5 at stage I, 18 at stage II (60 %), 1 at stage III (0.3 %), and 1 at stage IV [12]. WBC ranged 10.6–530.0 × 10⁹/l (median 77.7 × 10⁹/l) (Table 1). Detailed patients’ clinical data are presented in Supplementary Table S1.
Table 1.
Summarized clinical characteristics of CLL patients
| n | Mean | Median | Minimum | Maximum | SD | |
|---|---|---|---|---|---|---|
| Age | 30 | 63.3667 | 68.5000 | 36.0000 | 80.0000 | 14.0430 |
| WBC (× 109/l) | 30 | 100.8900 | 77.7000 | 10.6000 | 530.0000 | 99.1000 |
| Absolute lymphocyte count (× 109/l) | 30 | 92.3823 | 68.1500 | 7.5700 | 491.0000 | 93.7696 |
| Absolute monocyte count (× 109/l) | 26 | 1.6126 | 0.6210 | 0.1160 | 14.4000 | 2.8841 |
| Monocytes (%) | 26 | 2.1719 | 1.0450 | 0.1000 | 10.9000 | 2.7014 |
| B2 M (mg/l) | 28 | 4.3700 | 3.6700 | 0.8000 | 17.6200 | 3.2457 |
| LDH (IU/l) | 28 | 364.4286 | 340.0000 | 172.0000 | 664.0000 | 123.5066 |
| CD5/CD19 (%) | 30 | 89.3480 | 91.0250 | 64.9100 | 97.1600 | 7.7009 |
| CD19/ZAP70 (%) | 27 | 21.9300 | 15.8400 | 2.6000 | 68.5800 | 18.7887 |
| CD19/CD38 (%) | 30 | 31.6283 | 23.1900 | 0.4400 | 88.4300 | 31.1744 |
SD standard deviation, WBC white blood cells count, B2 M beta-2-microglobulin, LDH lactate dehydrogenase
Cell isolation, culture, and analyses
PB mononuclear cells (PMBCs) were isolated by gradient density centrifugation (Lymphoprep™, AXIS-SHIELD) in glass tubes, as described elsewhere [13]. Immunophenotype was assessed ex vivo by flow cytometry with FACSCalibur apparatus equipped with CellQuest software (Becton–Dickinson Immunocytometry System) on 10,000 cells for each sample, after incubation with monoclonal mouse antihuman CD5-PE, CD19-PE-Cy5, CD38-FITC, and ZAP70 antibodies along with appropriate isotype controls (all from BD PharMingen). Antibodies were applied at 1 μg/100 μl of cell suspension (1 × 10⁶ cells in 1 % BSA/PBS), and samples were processed according to the manufacturer’s instructions. ZAP70 gene expression was confirmed by RT-PCR using primers shown in supplementary Table S2 (DNA Gdansk). As median percentage of CD5(+)/CD19(+) lymphocytes was 91 % (Table 1), we decided not to enrich leukemic cell subpopulation for further analyses.
RNA was isolated by means of TRI reagent (Sigma), checked by spectrometry (Lambda 25 UV/VIS Spectrometer, PerkinElmer) and used for microarray analyses or for reverse transcription, followed by PCR.
CLL PBMCs (3 × 10⁶/ml) were cultured in culture flasks for adherent cells (for analyses) or on Petri dishes with grid on the bottom (squares 1 × 1 mm; Sarstedt) for counting NLCs, in RPMI 1640 with l-glutamine, supplemented with 15 % FCS and 1 × antibiotics/antimycotics solution (all from Gibco) at 37 °C, 5 % CO2. Culture medium was partially changed (1/3 vol/vol) three times a week. For statistical analyses, CLL lymphocyte suspension was decanted at day 14, and NLCs were stained with May-Grünwald Giemsa (MGG) and counted (from 50 squares of 1 mm2) with an Olympus CX31 microscope equipped with PLAN C 40 ×/0.65 objective.
For apoptosis induction, three versions of culture were prepared: 1. CLL lymphocytes cultured alone in the standard medium (L), 2. CLL lymphocytes co-cultured with NLCs in the standard medium (L/NLC), and 3. CLL lymphocytes cultured in the standard medium supplemented with SDF1 (L/SDF1) (rhSDF1α, 100 ng/ml, UPSTATE) [5].
Apoptosis was induced by treatment with either dexamethasone (DEX, 100nM, 30 patients) or chlorambucil (CLB, 35 μM, 8 patients) (both Sigma-Aldrich) for 24 h. The concentrations of DEX and CLB were adjusted empirically.
For analyses, NLCs were carefully washed out from lymphocytes with fresh medium, harvested by incubation with trypsin/EDTA solution (Gibco) at 37 °C for 5 min and gently scrapped with a cell-scraper (Sarstedt).
Lymphocyte and NLCs’ viability was assessed using trypan blue exclusion (TBE) assay (Trypan Blue, Sigma) and by means of flow cytometry, using fluorescein diacetate assay (FDA) (Fluorescein Diacetate, Sigma); apoptosis was examined with the Active Caspase-3 Mab Apoptosis Kit (BD PharMingen), according to the manufacturer’s protocol.
Live cell confocal microscopy was performed utilizing the Zeiss Axiovert 200 M inverted microscope with fluorescence/phase or DIC (Nomarski) imaging, fitted with 10 × and 20 × high chromatic correction objectives and PASCAL 42SP1 imaging software.
Microarray analyses
Gene expression profiling (GEP) was assessed in CLL lymphocytes isolated ex vivo and in CLL lymphocytes cultured with NLCs for 14 days by means of expression cDNA arrays (BD Atlas Human cDNA Expression Array—Human Apoptosis Array, Clontech), as described, according to the manufacturer’s protocol, utilizing 2–5 μg DNase digested RNA per reaction [14]. Probes were synthesized using 350 mCi/l of [α-32P]dATP, purified by column chromatography, and the radioactivity was checked by scintillation counting. After hybridization and washing, the membranes were incubated in a phosphorimager cassette with an MS Multisensitive Storage Phosphor Screen (PerkinElmer) for 5–17 h at RT, and the image was read with a Cyclon Phosphor Imager (PerkinElmer). The results were analyzed with AtlasImage™2.7 software (BD Biosciences, Clontech). All reactions were performed in duplicate.
In order to verify the results, RNA isolated from the same samples was reverse-transcribed and PCR was carried out with primers on BCL2, SURVIVIN, and GAPDH genes (Supplementary Table S2). Both reactions were performed according to the manufacturer’s instructions (ImProm-II™ Reverse Transcription System, Promega and Taq PCR Core Kit, Qiagen) on 0.3 μg RNA digested with RNase-free DNase (BD PharMingen) per reaction. PCR products were assessed after gel electrophoresis with TotalLab version 1.11 Gel Analysis software.
Statistics
Statistical analyses were performed with a free accessible R statistical package (www.R-project.org) and Statistica 10.0 PL software.
For array data analysis, the genes were filtered based on background threshold, according to the manufacturer’s instructions. The original data were then expressed in logarithmic scale and subjected to quantile normalization [15]. For comparison of pairs of groups, Welch’s corrected t-test was applied. The significance of diversification in the two groups was assessed by a variance analysis test (test F).
For other analyses, the normality of data distribution was tested by means of the Shapiro–Wilk test. Descriptive statistical analysis was performed utilizing median, minimal, and maximal values. The significance of differences between dependent samples was tested by means of the Wilcoxon matched pairs test and between independent samples by the Mann–Whitney U test. The strength of interdependency of two variables was expressed with Spearman’s rank correlation coefficient (R).
The differences were considered statistically significant with P values of less than 0.05.
Results
NLCs’ outgrowth and number
After 3–4 days of CLL cell culture, adherent NLCs with long projections were observed at the bottom of the culture flasks (Fig. 1). The number of NLCs increased up to the 7–8th day and then achieved a plateau. At day 14, it ranged 18–52 cells/mm2 (median 35) (Table 2, Supplementary Table S1). The number of NLCs positively correlated with absolute monocyte count, monocyte percentage, and β-2-microglobulin (B2 M) level (r = 0.45597, r = 0.476191, and r = 0.383003, respectively). No significant correlation was observed for NLC count and the stage of the disease according to Rai, WBC, serum LDH, as well as the expression of ZAP70 and CD38.
Fig. 1.
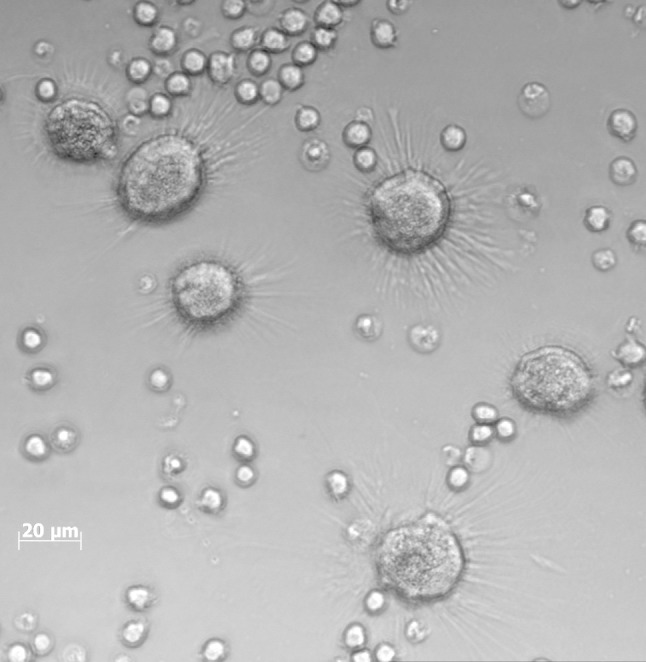
Confocal live cell imaging of CLL PBMCs culture at day 14. Cells were cultured on 3-ml Petri dishes, in standard RPMI-1640 medium supplemented with 15 % FCS and antibiotics/antimycotics. Note, large NLCs with radial projections among small, translucent lymphocytes
Table 2.
Cell viability, BCL2, and SURVIVIN genes’ expression in CLL lymphocytes ex vivo and cultured with NLCs, and NLCs count at day 14
| n | Mean | Median | Minimum | Maximum | SD | |
|---|---|---|---|---|---|---|
| Viability* 0 (%) | 30 | 96.0937 | 96.47000 | 89.20000 | 100.0000 | 2.60281 |
| BCL2** 0 | 30 | 93.9490 | 90.72500 | 46.15000 | 135.0000 | 18.68148 |
| Survivin 0 | 30 | 20.5127 | 17.25500 | 0.00000 | 51.9200 | 15.19931 |
| Viability 14 (%) | 30 | 93.8843 | 95.60000 | 80.60000 | 100.0000 | 5.57868 |
| BCL2 14 | 30 | 102.2823 | 98.34000 | 72.51000 | 143.8000 | 17.05437 |
| Survivin 14 | 30 | 29.8413 | 30.94000 | 0.00000 | 69.4500 | 16.63554 |
| NLC count*** | 30 | 36.2000 | 35.00000 | 18.00000 | 52.0000 | 9.51369 |
SD standard deviation
* Viability was assessed by trypan blue exclusion test
** Gene expression was assessed by RT-PCR and compared to GAPDH expression
*** NLC number per mm2 at day 14
CLL lymphocytes’ viability in cultures with NLCs
Median lymphocyte viability assessed by TBE assay in cultures with NLCs at day 14 was 93.88 % as compared with 96.09 % at day 0, and it significantly positively correlated with the number of NLCs (r = 0.845075, p < 0.05) (Fig. 2a). While most of CLL lymphocytes died after 10 days in cultures depleted of NLCs, the CLL lymphocyte/NLC co-cultures were successfully carried out up to 14 weeks (data not shown).
Fig. 2.

a Scatter diagram of CLL lymphocytes viability against NLCs number. CLL lymphocytes were cultured for 14 days as described in “Methods.” CLL lymphocyte viability was evaluated by trypan blue exclusion (TBE) assay. NLCs number was assessed on Petri dishes by counting cells from 50 squares of 1 mm2. b Apoptosis induced in CLL lymphocytes cultures by DEX and CLB, assessed by flow cytometry using active caspase-3 test. c The viability of CLL lymphocytes treated with DEX depending on culture conditions: L-CLL lymphocytes alone (control), L/NLC—CLL lymphocyte/NLC co-culture, L/SDF1—CLL lymphocytes supplemented with recombinant human SDF1. d The viability of CLL lymphocytes and NLCs treated with DEX. L + DEX—CLL lymphocytes treated with DEX for 24 h, NLC + DEX—NLCs treated with DEX for 24 h
Apoptosis induced by DEX and CLB in CLL lymphocytes
Treatment with either DEX or CLB induced apoptosis in leukemic cells as compared to control cultures (Fig. 3, Supplementary Table S3 and S4). Median lymphocyte viability assessed by FDA was lower in cultures treated with DEX or CLB than in untreated ones (31.81 vs 82.13 %, p < 0.0001 and 45.84 vs 79.34 %, p < 0.0001, respectively).
Fig. 3.

Exemplary CLL lymphocytes viability assessed by FDA in DEX-treated cultures—different variants of culture (patient # 6). FDA—fluorescein diacetate assay, L—untreated CLL lymphocytes (control), L + DEX—CLL lymphocytes treated with dexamethasone for 24 h, L/NLC—CLL lymphocyte/NLC co-culture, L/NLC + DEX—CLL lymphocyte/NLC co-culture treated with DEX for 24 h, L/SDF1—CLL lymphocytes supplemented with SDF1, L/SDF1 + DEX—CLL lymphocytes supplemented with SDF1 treated with DEX for 24 h. (see “Methods” for details). Numbers at the upper right present the proportion of viable cells
Median apoptosis assessed by caspase-3 activity test was higher in DEX-treated cultures (27.12 vs 6.15 % positive cells, p < 0.0001) and CLB-treated cultures (9.1 vs 6.3 %, p < 0.0001) as compared to control cultures (Supplementary Tables S3 and S4). DEX at a concentration of 100 nM was more efficient in inducing cell death as compared to 35 μM CLB (median viability 31.81 vs 45.84 %, respectively, p = 0.003923) (Fig. 2b).
CLL lymphocytes cultured with NLCs were found to be less sensitive to DEX and CLB, as compared with lymphocytes alone and lymphocytes cultured with SDF1 (Figs. 2c, 3). Median lymphocyte viability in DEX-treated cultures was 31.81 % for lymphocytes alone (L + DEX), 42.02 % for co-cultures with NLCs (L/NLC + DEX), and 34.75 % for cultures with the addition of SDF1 (L/SDF1 + DEX). The differences were significant (L + DEX vs. L/NLC + DEX, p = 0.000002 and L + DEX vs. L/SDF1 + DEX, p = 0.000148) (Fig. 2c). Similarly, in CLB-treated cultures, median viability was 45.84 % for lymphocytes alone, 53.69 % for co-cultures with NLCs and 49.66 % for cultures with SDF1 (Supplementary Table S4). In our experiments, SDF1 alone did not improve lymphocyte viability as effectively as NLCs; median viability without drugs was 82.13 % for lymphocytes alone, 82.94 % for SDF1 cultures and 88.53 % for co-cultures with NLCs (Supplementary Table S3). The difference in lymphocyte viability between the latter two culture variants was statistically significant (p = 0.000047).
Apoptosis induced by DEX and CLB in NLCs
Apoptosis-inducing drugs induced decrease in viability of NLCs as well, but to a lesser extent than that of lymphocytes. Mean NLCs’ viability after DEX treatment was 37.79 %, as compared to 29.24 % of CLL lymphocytes’ viability, and the difference was statistically significant (p = 0.0387) (Fig. 2d, Supplementary Table S5). CLB at concentration used was less toxic than DEX; mean viability of CLB-treated NLCs was 50.66 % as assessed by FDA test.
Gene expression profiling
After data filtering and normalization for both groups examined, the informative data concerning the expression level of 179 genes (out of 218) were obtained (Supplementary Table S6). Significant differences between CLL lymphocytes ex vivo and CLL lymphocytes cultured with NLCs concerned 36 genes (20 %), 17 genes being up-regulated at day 14. Higher expression in cultured CLL lymphocytes was observed for genes encoding anti-apoptotic proteins: BCL2, BCL2A1, SURVIVIN, XIAP, and regulators of the cell cycle, differentiation and transcription: CDK4, E2F3, CDK9, CDK5R1, MAPK3, MAPK7, and CDKN1C (Table 3). Increased BCL2 and SURVIVIN expressions were confirmed by means of RT-PCR (Table 2). Moreover, using RT-PCR, we have identified three alternatively spliced SURVIVIN transcript variants in CLL lymphocytes: SURVIVIN-wt, SURVIVIN-2B, and SURVIVIN-ΔEx3 (Supplementary Figure 1).
Table 3.
Genes up-regulated in CLL lymphocytes cultured with NLCs for 14 days compared to the ex vivo status (in descending order of mean expression values at day 0)
| Gene/description | GeneBank accession # | Exp. 0* (%) | Exp. 14* (%) | Fold change | p |
|---|---|---|---|---|---|
| Apoptosis regulator BCL-2 | M14475 | 88 | 100 | 1.13 | 0.0139 |
| Cyclin-dependent kinase 4 (CDK4) | M14505 | 68 | 80 | 1.17 | 0.0178 |
| CASP8 and FADD-like apoptosis regulator, CFLAR | AF010127 | 54 | 75 | 1.38 | 0.0448 |
| E2F-3, E2F transcription factor 3 | Y10479 | 53 | 74 | 1.39 | 0.0412 |
| BCL-2-related protein A1 (BCL2A1) | U29680 | 47 | 60 | 1.27 | 0.0320 |
| Cell division protein kinase 9 (CDK9) | L25676 | 42 | 60 | 1.42 | 0.0184 |
| RBP2 retinoblastoma binding protein | S66431 | 36 | 63 | 1.75 | 0.0223 |
| G2/mitotic-specific cyclin G1 (CCNG1; CYCG1) | U47413 | 33 | 58 | 1.75 | 0.0467 |
| p53-associated mdm2 protein; MDM2 | Z12020 | 28 | 45 | 1.61 | 0.0487 |
| Extracellular signal-regulated kinase 5 (ERK5); MAPK7 | U25278 | 27 | 50 | 1.85 | 0.0382 |
| Receptor interacting serine/threonine protein kinase 2 (RIPK2) | U25994 | 26 | 40 | 1.53 | 0.0275 |
| Apoptosis inhibitor Survivin | U75285 | 24 | 58 | 2.41 | 0.0046 |
| TNF receptor-associated factor 5, TRAF5 | U69108 | 22 | 42 | 1.9 | 0.0421 |
| Inhibitor of apoptosis protein 3 (API3; IAP3); XIAP | U45880 | 18 | 52 | 2.88 | 0.0116 |
| Cyclin-dependent kinase 5 activator precursor (CDK5R1) | X80343 | 16 | 49 | 3.06 | 0.0277 |
| Extracellular signal-regulated kinase 3 (ERK3); MAP kinase 3, MAPK3 | X80692 | 14 | 35 | 2.5 | 0.0323 |
| Cyclin-dependent kinase inhibitor 1C (CDKN1C); p57-KIP2 | U22398 | 11 | 33 | 3 | 0.0418 |
* Expression assessed by means of expression arrays
Genes down-regulated in cultured CLL lymphocytes included pro-apoptotic BCL2 family members: BAD, BNIP1, and BNIP3; genes coding for repair proteins: GADD45 and ERCC6; growth factor/chemokine receptors: IGFBP1, IGFBP2, and IGFBP6; genes for antioxidant enzymes: MGST12, GSTP1, and GPX1; and gene coding for death receptor FAS (Table 4).
Table 4.
Genes down-regulated in CLL lymphocytes cultured with NLCs for 14 days compared to the ex vivo status (in descending order of mean expression values at day 0)
| Gene/description | GeneBank accession # | Exp. 0* (%) | Exp. 14* (%) | Fold change | p |
|---|---|---|---|---|---|
| Insulin-like growth factor binding protein 2 (IGFBP2) | M35410 | 83 | 46 | 1.8 | 0.0421 |
| Insulin-like growth factor binding protein 6 precursor (IGFPB6) | M62402 | 83 | 34 | 2.44 | 0.0365 |
| Microsomal glutathione S-transferase 12 (MGST12) | J03746 | 72 | 53 | 1.35 | 0.0474 |
| Growth arrest and DNA damage-inducible protein (GADD45) | M60974 | 70 | 48 | 1.46 | 0.0238 |
| Insulin-like growth factor 1 (somatomedin C), IGF1 | M27544 | 67 | 13 | 5.15 | 0.0312 |
| BCL2-associated agonist of cell death, BAD | U66879 | 62 | 47 | 1.31 | 0.0121 |
| Retinoic acid receptor epsilon (RAR-epsilon); RARB | X07282 | 48 | 29 | 1.65 | 0.0452 |
| Cyclin-dependent protein kinase 2 (CDK2) | M68520 | 47 | 15 | 3.13 | 0.0339 |
| Cell division cycle 25A, CDC25A | M81933 | 44 | 21 | 2.09 | 0.0386 |
| FAS soluble protein; APO1 | Z70519 | 44 | 26 | 1.69 | 0.0211 |
| Glutathione S-transferase pi (GSTP1) | X15480 | 41 | 4 | 10.25 | 0.0439 |
| BCL2/adenovirus E1B kDa interacting protein 1, BNIP1 | U15172 | 39 | 7 | 5.27 | 0.0398 |
| Cytochrome P450 reductase, POR | S90469 | 38 | 3 | 12.6 | 0.0385 |
| Defender against cell death 1 (DAD1) | D15057 | 37 | 7 | 5.28 | 0.0486 |
| BCL2/adenovirus E1B kDa interacting protein 3, BNIP3 | U15174 | 33 | 2 | 16.5 | 0.0284 |
| Glutathione peroxidase (GPX1) | Y00433 | 31 | 6 | 5.16 | 0.0399 |
| Excision repair protein ERCC6 | L04791 | 30 | 17 | 1.76 | 0.0437 |
| Insulin-like growth factor 2 (IGF2); somatomedin A | M29645 | 27 | 14 | 1.92 | 0.0486 |
| CSE1 chromosome segregation 1-like (yeast); cellular apoptosis susceptibility protein | U33286 | 25 | 8 | 3.5 | 0.0436 |
* Expression assessed by means of expression arrays
The Spearman’s rank correlation test demonstrated that the expression of BCL2, SURVIVIN, and GAPDH genes assessed by microarrays and RT-PCR in the same samples was comparable (p < 0.02).
Discussion
Historically, CLL has been considered as an accumulative disease of lymphocytes defective in apoptosis, and this particular mechanism, but not increased proliferation, was thought to contribute toward leukemogenesis. The discovery of high spontaneous apoptosis level of CLL lymphocytes transferred to an ex vivo conditions has completely changed our conception of their intrinsic properties. In addition, telomere length studies together with proliferation assays based on deuterated water labeling pointed to the role of proliferation in lymphocyte accumulation as well [16]. Since it was not evident in peripheral blood, the thorough investigations were carried out, which unraveled dividing cells within proliferation centers of pseudofollicles located in bone marrow, spleen, and lymph nodes of CLL patients [1]. Pseudofollicle centers are composed of a mixture of small to medium and sporadically larger lymphocytes, prolymphocytes, and paraimmunoblasts [3]. They are surrounded and infiltrated by stromal cells, follicular dendritic cells, endothelial cells, and nurse-like cells. Expanded size of such proliferation centers seems to be associated with aggressive clinical course [17]. It was the second hint on the role of environment in CLL development. Recently, growing evidence confirms the significance of microenvironmental factors for CLL cell survival and proliferation. Hidden in their microenvironmental niches, leukemic lymphocytes are also resistant to therapy, which makes this issue even more important [18].
The CLL lymphocyte/NLC co-culture model
Previously, we characterized one of the components of CLL microenvironment, nurse-like cells (NLCs) [9]. Their number in vitro correlated with serum beta-2-microglobulin, absolute monocyte count, and monocyte percentage, but not with other clinical/hematological features of CLL patients, such as stage of the disease according to Rai, lymphocytosis or CD38 and ZAP70 expression. The aforementioned observations were confirmed in the current study group.
NLCs considerably support the growth and survival of leukemic lymphocytes in vitro—in our laboratory, the co-cultures were successfully carried out for up to 14 weeks. NLCs also seem to protect leukemic cells in vivo, as we observed the tendency for longer overall survival in our patients producing less NLCs in vitro [9].
In the present study, we established the natural model for the investigation of mutual lymphocyte–environment interaction, utilizing NLCs grown from peripheral blood of CLL patients. It is easy to assemble and very convenient for studies on new therapies. Different cell culture systems mimicking CLL microenvironment have been proposed before, including murine fibroblast cells (NIH3T3) expressing CD154, murine bone marrow stromal cells (M2-10B4 line), and others [5, 10, 19]. However, these cells only in part resemble the natural cells, which compose the microenvironment.
One of the most important chemokines responsible for the enhanced survival of CLL lymphocytes is SDF1 (CXCL12), which acts via its receptor, CXCR4 [5]. SDF1 is normally produced by stromal cells within bone marrow, and it regulates B-cell development by retaining their precursors within the supportive hematopoietic microenvironment, until they are mature enough to be released into the circulation [5]. CLL lymphocytes express high levels of CXCR4, and activation of this signal transduction pathway was found to reduce spontaneous apoptosis via AKT and ERK phosphorylation [20]. Burger et al. [5] stated that NLCs were characterized by high expression of SDF1 mRNA, and synthetic SDF1 rescued CLL lymphocytes from spontaneous apoptosis. This is why we decided to use recombinant SDF1 as the control of our experiments.
Nurse-like cells exert their support not only by secreting SDF1. They enhance CLL cells survival by releasing BAFF (B-cell activating factor, CD257) and proliferation-inducing ligand APRIL (CD256) [8].
Our studies showed that NLCs might protect lymphocytes also by the secretion of IL8, the interleukin of many important functions [9]. IL8 was found to decrease CLL lymphocyte apoptosis, both spontaneous and induced by glucocorticoids [21]. Furthermore, gene expression profiling demonstrated that NLCs strongly express genes for other molecules important for lymphocyte “nursing,” such as growth factors, chemokines, cell signalization molecules, and cell adhesion molecules (i.e., CCL2, CCL8, CCL19, CXCL5, CXCL9, CX3CL1, FLT3LG, IL10, MIC3, CD44H, CD105, ICAM1, ITGAM, ITGAX, ITGB2, and SELP) [9]. High expression of genes encoding cell adhesion molecules points to the importance of direct NLC/lymphocyte contact, which in turn enables CD31–CD38 interaction, resulting in the increase in leukemic cells proliferation and migration [19, 22, 23].
The relationship between CLL lymphocytes and NLCs is clearly mutual, as the former secrete CCL3 and CCL4, which recruit NLC precursors and T lymphocytes to CLL niches [18]. In our experiments, NLCs from the cultures depleted of lymphocytes survived several days (data not shown). As the network of mutual lymphocyte–NLC interactions is so complex, the animal models that mimic the natural CLL microenvironment are far inaccurate.
Another issue important for the studies of new drugs is that NLC/lymphocyte model allows for simultaneous assessment of the effect of particular treatment both on lymphocytes and on NLCs as microenvironmental compounds.
Apoptosis induced in the CLL lymphocyte/NLC co-cultures
Although treatment for CLL patients has dramatically changed during the last decade with the introduction of monoclonal antibodies, glucocorticoids (GCs) still are part of the therapeutic regimen, especially in fludarabine-refractory cases [24, 25].
Dexamethasone (DEX) triggers apoptosis by either transactivation through the glucocorticoid response element (GRE), transrepression of NF-kappaB, phosphorylation of intracytoplasmic tyrosine kinase RAFTK, or induction of BCL2L11 (BIM) gene [26]. Moreover, since 1940 s, when GCs were introduced as first systemic therapy for CLL patients, it is known that they interfere with leukemic lymphocytes homing and redistribution between blood and secondary lymphoid tissues [27]. This brings to mind an attractive idea of combining GCs with other cytotoxic agents, which will act at leukemic cells expelled from their supportive niches.
Chlorambucil (CLB) is an alkylating agent, which impedes DNA replication and induces cellular apoptosis via the accumulation of cytosolic TP53 and subsequent activation of pro-apoptotic BAX gene. For many years, chlorambucil has been a standard first-line chemotherapeutic agent for patients with CLL who required treatment [11]. As orally administered, well tolerated, and inexpensive drug, it still remains an appropriate option for elderly or unfit patients [28].
We have chosen dexamethasone and chlorambucil as drugs of different mechanisms of action to induce apoptosis in CLL lymphocytes cultured in different conditions. We also wanted to evaluate whether DEX and CLB at used concentrations have any activity on NLCs.
In our study, NLCs attenuated apoptosis induced in CLL lymphocytes by both DEX and CLB (Fig. 2c). Their indirect protective effect is much more evident than the effect of recombinant SDF1, which was also observed for spontaneous apoptosis (Supplementary Table S4) [5]. This again points to the complexity of the network of pathways activated between lymphocytes and microenvironment, as well as the role of direct cell-to-cell contact [22, 23].
For the first time, the sensitivity of NLCs to antileukemic drugs was evaluated. Both DEX and CLB induced NLCs apoptosis, but the resulting decrease in their viability was not as obvious as that of lymphocytes (Fig. 2d). Given that the above observations concern the in vitro conditions, one may assume that in vivo NLCs may be even more resistant. It suggests that to achieve better response, the combined therapy, aimed both at lymphocytes and at their microenvironment, should definitely be considered.
Changes in gene expression profiles
CLL lymphocyte gene expression in NLC co-cultures was studied by Burger and colleagues [7]. However, in our studies, we have focused strictly on the expression of genes contributing to apoptosis (Human Apoptosis Array, Clontech, 218 genes) as the process that is known to be altered in CLL. We have also selected the cases where the number of NLCs was > 15/mm2, to be sure that the potential gene expression changes were NLC-associated.
CLL lymphocytes cultured with NLCs demonstrated the up-regulation of genes encoding anti-apoptotic proteins, i.e., BCL2, BCL2A1, SURVIVIN (BIRC5), and XIAP (Table 3). The most important apoptosis-related gene in CLL is BCL2 (B-cell leukemia/lymphoma). We first described in follicular lymphoma as translocated to Ig heavy chain gene locus, for many years, and BCL2 has been considered as one of certain contributors to CLL development [29]. Its overexpression is linked to enhanced resistance to apoptosis observed in CLL lymphocytes. Deletion of 13q14, a common cytogenetic aberration in CLL, may partially account for BCL2 up-regulation, because it involves miR-15a and miR-16 loci, both being negative BCL2 regulators [30]. BCL2 expression may be also regulated by environmental signals. Deaglio and coworkers discovered that the expression of BCL2 was increased in CLL lymphocytes located within proliferation centers [2]. Our results confirm that the resistance of leukemic cells to apoptosis associated with high BCL2 expression is not solely their intrinsic feature, but is largely induced by the microenvironmental stimuli.
BCL2 itself is considered as very attractive target of the therapy in many types of cancer. First attempts with oblimersen (BCL2 antisense phosphorothioate oligodeoxynucleotide G3139) and Oblataclax (BH3 mimetic BCL2 inhibitor GX15-070) were not very successful in CLL [26]. The results of the phase I study of Navitoclax (ABT-263, disruptor of BCL2–BCL-xL interactions with pro-apoptotic proteins) in patients with relapsed or refractory CLL were more promising, but it caused thrombocytopenia due to BCL-xL inhibition [31, 32]. Treatment with another specific BCL2 inhibitor, ABT-199, is expected to be associated with less adverse effects [32]. However, such monotherapy still aims at only one out of many factors responsible for malignant potential of CLL cells.
SURVIVIN/BIRC5 belongs to the inhibitor of apoptosis (IAP) family genes, which encode negative regulatory proteins that prevent apoptotic cell death. Its overexpression in cancer cells is an adverse prognostic factor, for it is associated with chemotherapy resistance, increased tumor recurrence, and shorter patient survival [33]. SURVIVIN expression in circulating CLL lymphocytes is low, and it was only found to be induced within proliferation centers [17]. By means of RT-PCR, we identified three alternatively spliced SURVIVIN transcript variants in CLL lymphocytes: SURVIVIN-wt, SURVIVIN-2B, and SURVIVIN-ΔEx3. The predominant one was SURVIVIN-wt, which was described also in ALL, AML, and B-cell lymphoma [33]. NLCs may induce SURVIVIN expression via activation of PI3 K/AKT pathway through BAFF and APRIL, and this up-regulation contributes to the enhanced survival of leukemic cells [8].
Another phenomenon observed in CLL lymphocytes cultured with NLCs was down-regulation of genes BAD, BNIP1, and BNIP3. These are BCL2 family genes encoding pro-apoptotic proteins. The higher is the ratio of anti-apoptotic BCL2 family proteins to pro-apoptotic ones, the stronger is the signal for survival. Decreased expression of BAD, BNIP1, and BNIP3 may contribute to the resistance to apoptosis.
Cultured CLL lymphocytes demonstrated also the decrease in the expression of genes coding for antioxidant enzymes, i.e., MGST12, GSTP1, and GPX1. Oxidative stress is well known to play an important role in solid tumors development and response to the therapy, but there were only a few studies performed in hematological malignancies [34]. Pasanen et al. [34] described the increased expression of oxidative stress markers and antioxidative enzymes in B-cell-derived lymphomas, and its positive correlation with aggressive clinical course. As some antioxidants may also act as growth factors by inhibiting apoptosis and activating a number of transcription factors (e.g., NF-κB), the observed up-regulation may also be important for prolonged CLL cells’ survival [35].
Conclusion
Despite many efforts, as elegantly reviewed by Hallek and by Burger, CLL still stays an incurable disease [25, 28]. The network of factors influencing proliferation and survival of leukemic cells is quite complex. Undisputedly, microenvironmental signals are crucial and should absolutely be considered in the design of new therapies. Our results proved that conventional antileukemic drugs affected microenvironment only in a small degree. Thus, the combined therapy, targeted both on lymphocytes and on the cells composing the microenvironment, should be developed. However, we have shown that NLC-derived chemokine SDF1 alone was not as effective in the protection of leukemic cells against induced apoptosis as was the presence of NLCs, which points to the involvement of other microenvironment-related factors. Hence, therapies combining conventional antileukemic drugs with disruptors of single signaling pathway, such as CXCR4 inhibitors or inhibitors of B-cell receptor-associated kinases, may not be sufficient. Strategies aimed at several different targets simultaneously should be worked out to bring an evident progress in CLL treatment. The CLL lymphocyte/NLC co-culture, as entirely comprised of the human leukemic cells, seems to be the perfect model for preliminary studies.
Electronic supplementary material
Below is the link to the electronic supplementary material.
Acknowledgments
The authors are grateful to the patients who participated in this study. We would like to thank Barbara Kwiatkowska-Drabik and Małgorzata Luterek for assistance with culture issues, Dr. Krystyna Różyńska and Dr. Tomasz Kubiatowski for preparing and reading the arrays, Dr. Piotr Pokarowski for help with the statistical analyses, and Dr. Tomasz Piersiak for photographic documentation. This project was supported by the Medical University of Lublin, Poland (Grants PW 487/03-04-06 and DS225 to AAF).
Conflict of interest
None.
References
- 1.Müller-Hermerink HK, Montserrat E, Catovsky D, Campo E, Harris NL, Stein H, et al. Chronic lymphocytic leukaemia/small lymphocytic leukaemia. In: Swerdlow SH, Campo E, Harris NL, Jaffe ES, Pileri SA, Stein H, et al., editors. WHO classification of tumours of haematopoietic and lymphoid tissues. 4. Lyon: IARC Press; 2008. pp. 180–182. [Google Scholar]
- 2.Deaglio S, Malavasi F. Chronic lymphocytic leukemia microenvironment: shifting the balance from apoptosis to proliferation. Haematologica. 2009;94:752–756. doi: 10.3324/haematol.2009.006676. [DOI] [PMC free article] [PubMed] [Google Scholar]
- 3.Ponzoni M, Doglioni C, Caligaris-Cappio F. Chronic lymphocytic leukemia: the pathologist’s view of lymph node microenvironment. Semin Diagn Pathol. 2011;28:161–166. doi: 10.1053/j.semdp.2011.02.014. [DOI] [PubMed] [Google Scholar]
- 4.Hendrix TM, Chilukuri RV, Martinez M, Olushoga Z, Blake A, Brohi M, Walker C, Samms M, Guyden JC. Thymic nurse cells exhibit epithelial progenitor phenotype and create unique extra-cytoplasmic membrane space for thymocyte selection. Cell Immunol. 2010;261:281–292. doi: 10.1016/j.cellimm.2009.11.004. [DOI] [PMC free article] [PubMed] [Google Scholar]
- 5.Burger JA, Tsukada N, Burger M, Zvaifler NJ, Dell’Aquilla M, Kipps TJ. Blood derived nurse cells protect leukemia B cells from spontaneous apoptosis through stromal-cell derived factor-1. Blood. 2000;96:2655–2663. [PubMed] [Google Scholar]
- 6.Tsukada N, Burger AJ, Zvaifler NJ, Kipps TJ. Distinctive features of “nurselike” cells that differentiate in the context of chronic lymphocytic leukemia. Blood. 2002;99:1030–1037. doi: 10.1182/blood.V99.3.1030. [DOI] [PubMed] [Google Scholar]
- 7.Burger JA, Quiroga MP, Hartmann E, Bürkle A, Wierda WG, Keating MJ, et al. High-level expression of the T-cell chemokines CCL3 and CCL4 by chronic lymphocytic leukemia B cells in nurselike cell co-cultures and after BCR stimulation. Blood. 2009;113:3050–3058. doi: 10.1182/blood-2008-07-170415. [DOI] [PMC free article] [PubMed] [Google Scholar]
- 8.Cols M, Barra CM, He B, Puga I, Xu W, Chiu A, Tam W, Knowles DM, Dillon SR, Leonard JP, Furman RR, Chen K, Cerutti A. Stromal endothelial cells establish a bidirectional crosstalk with chronic lymphocytic leukemia cells through the TNF-related factors BAFF, APRIL, and CD40L. J Immunol. 2012;188:6071–6083. doi: 10.4049/jimmunol.1102066. [DOI] [PMC free article] [PubMed] [Google Scholar]
- 9.Filip AA, Ciseł B, Koczkodaj D, Wąsik-Szczepanek E, Piersiak T, Dmoszyńska A. Circulating microenvironment of CLL: are nurse-like cells related to tumor-associated macrophages? Blood Cells Mol Dis. 2013;50:263–270. doi: 10.1016/j.bcmd.2012.12.003. [DOI] [PubMed] [Google Scholar]
- 10.Natoni A, O’Dwyer M, Santocanale C. A cell culture system that mimics chronic lymphocytic leukemia cells microenvironment for drug screening and characterization. Methods Mol Biol. 2013;986:217–226. doi: 10.1007/978-1-62703-311-4_14. [DOI] [PubMed] [Google Scholar]
- 11.Hallek M, Cheson BD, Catovsky D, Caligaris-Cappio F, Dighiero G, Döhner H, Hillmen P, Keating MJ, Montserrat E, Rai KR, Kipps TJ, International Workshop on Chronic Lymphocytic Leukemia (2008) Guidelines for the diagnosis and treatment of chronic lymphocytic leukemia: a report from the International Workshop on chronic lymphocytic leukemia updating the National Cancer Institute—working Group 1996 guidelines. Blood 111:5446–5456. doi:10.1182/blood-2007-06-093906 [DOI] [PMC free article] [PubMed]
- 12.Rai KR, Sawitsky A, Cronkite EP, Chanana AD, Levy RN, Pasternack BS. Clinical staging of chronic lymphocytic leukemia. Blood. 1975;46:219–234. doi: 10.1182/blood-2016-08-737650. [DOI] [PubMed] [Google Scholar]
- 13.Böyum A. Separation of leukocytes from blood and bone marrow, introduction. Scand J Lab Clin Invest Suppl. 1968;97:7. [PubMed] [Google Scholar]
- 14.Duff MD, Mestre J, Maddali S, Yan ZP, Stapleton P, Daly JM. Analysis of gene expression in the tumor-associated macrophage. J Surg Res. 2007;142:119–128. doi: 10.1016/j.jss.2006.12.542. [DOI] [PubMed] [Google Scholar]
- 15.Bolstad BM, Irizarry RA, Astrand M, Speed TP. A comparison of normalization methods for high density oligonucleotide array data based on bias and variance. Bioinformatics. 2003;19:185–193. doi: 10.1093/bioinformatics/19.2.185. [DOI] [PubMed] [Google Scholar]
- 16.Herishanu Y, Pérez-Galán P, Liu D, Biancotto A, Pittaluga S, Vire B, Gibellini F, Njuguna N, Lee E, Stennett L, Raghavachari N, Liu P, McCoy JP, Raffeld M, Stetler-Stevenson M, Yuan C, Sherry R, Arthur DC, Maric I, White T, Marti GE, Munson P, Wilson WH, Wiestner A. The lymph node microenvironment promotes B-cell receptor signaling, NF-kappaB activation, and tumor proliferation in chronic lymphocytic leukemia. Blood. 2011;117:563–574. doi: 10.1182/blood-2010-05-284984. [DOI] [PMC free article] [PubMed] [Google Scholar]
- 17.Giné E, Martinez A, Villamor N, López-Guillermo A, Camos M, Martinez D, et al. Expanded and highly active proliferation centers identify a histological subtype of chronic lymphocytic leukemia (“accelerated” chronic lymphocytic leukemia) with aggressive clinical behavior. Haematologica. 2010;95:1526–1533. doi: 10.3324/haematol.2010.022277. [DOI] [PMC free article] [PubMed] [Google Scholar]
- 18.Fecteau JF, Kipps TJ. Structure and function of the hematopoietic cancer niche: focus on chronic lymphocytic leukemia. Front Biosci (Schol Ed) 2012;4:61–73. doi: 10.2741/S251. [DOI] [PMC free article] [PubMed] [Google Scholar]
- 19.Buchner M, Brantner P, Stickel N, Prinz G, Burger M, Bär C, Dierks C, Pfeifer D, Ott A, Mertelsmann R, Gribben JG, Veelken H, Zirlik K. The microenvironment differentially impairs passive and active immunotherapy in chronic lymphocytic leukaemia—CXCR4 antagonists as potential adjuvants for monoclonal antibodies. Br J Haematol. 2010;151:167–178. doi: 10.1111/j.1365-2141.2010.08316.x. [DOI] [PubMed] [Google Scholar]
- 20.McCaig AM, Cosimo E, Leach MT, Michie AM. Dasatinib inhibits CXCR4 signaling in chronic lymphocytic leukaemia cells and impairs migration towards CXCL12. PLoS ONE. 2012;7:e48929. doi: 10.1371/journal.pone.0048929. [DOI] [PMC free article] [PubMed] [Google Scholar]
- 21.di Celle PF, Carbone A, Marchis D, Zhou D, Sozzani S, Zupo S, Pini M, Mantovani A, Foa R. Cytokine gene expression in B-cell chronic lymphocytic leukemia: evidence of constitutive interleukin-8 (IL-8) mRNA expression and secretion of biologically active IL-8 protein. Blood. 1994;84:220–228. [PubMed] [Google Scholar]
- 22.Poggi A, Prevosto C, Catellani S, Rocco I, Garuti A, Zocchi MR. Engagement of CD31 delivers an activating signal that contributes to the survival of chronic lymphocytic leukaemia cells. Br J Haematol. 2010;151:252–264. doi: 10.1111/j.1365-2141.2010.08343.x. [DOI] [PubMed] [Google Scholar]
- 23.Deaglio S, Aydin S, Grand MM, Vaisitti T, Bergui L, D’Arena G, et al. CD38/CD31 interactions activate genetic pathways leading to proliferation and migration in chronic lymphocytic leukemia cells. Mol Med. 2010;16:87–91. doi: 10.2119/molmed.2009.00146. [DOI] [PMC free article] [PubMed] [Google Scholar]
- 24.Smolej L. The role of high-dose corticosteroids in the treatment of chronic lymphocytic leukemia. Expert Opin Invest Drugs. 2013;21:1009–1017. doi: 10.1517/13543784.2012.690393. [DOI] [PubMed] [Google Scholar]
- 25.Burger JA, Montserrat E. Coming full circle: 70 years of chronic lymphocytic leukemia cell redistribution, from glucocorticoids to inhibitors of B-cell receptor signaling. Blood. 2013;121:1501–1509. doi: 10.1182/blood-2012-08-452607. [DOI] [PMC free article] [PubMed] [Google Scholar]
- 26.Baptista MJ, Muntañola A, Calpe E, Abrisqueta P, Salamero O, Fernández E, Codony C, Giné E, Kalko SG, Crespo M, Bosch F. Differential gene expression profile associated to apoptosis induced by dexamethasone in CLL cells according to IGHV/ZAP-70 status. Clin Cancer Res. 2012;18:5924–5933. doi: 10.1158/1078-0432.CCR-11-2771. [DOI] [PubMed] [Google Scholar]
- 27.Shaw RK, Boggs DR, Silberman HR, Frei E. A study of prednisone therapy in chronic lymphocytic leukemia. Blood. 1961;17:182–195. [Google Scholar]
- 28.Hallek M. Chronic lymphocytic leukemia: 2013 update on diagnosis, risk stratification and treatment. Am J Hematol. 2013;88:803–816. doi: 10.1002/ajh.23491. [DOI] [PubMed] [Google Scholar]
- 29.Tsujimoto Y, Croce CM. Analysis of the structure, transcripts, and protein products of bcl-2, the gene involved in human follicular lymphoma. Proc Natl Acad Sci USA. 1986;83:5214–5218. doi: 10.1073/pnas.83.14.5214. [DOI] [PMC free article] [PubMed] [Google Scholar]
- 30.Aqeilan RI, Calin GA, Croce CM. miR-15a and miR-16-1 in cancer: discovery, function and future perspectives. Cell Death Differ. 2012;17:215–220. doi: 10.1038/cdd.2009.69. [DOI] [PubMed] [Google Scholar]
- 31.Roberts AW, Seymour JF, Brown JR, Wierda WG, Kipps TJ, Khaw SL, Carney DA, He SZ, Huang DC, Xiong H, Cui Y, Busman TA, McKeegan EM, Krivoshik AP, Enschede SH, Humerickhouse R. Substantial susceptibility of chronic lymphocytic leukemia to BCL2 inhibition: results of a phase I study of navitoclax in patients with relapsed or refractory disease. J Clin Oncol. 2012;30:488–496. doi: 10.1200/JCO.2011.34.7898. [DOI] [PMC free article] [PubMed] [Google Scholar]
- 32.Davids MS, Letai A, Brown JR. Overcoming stroma-mediated treatment resistance in chronic lymphocytic leukemia through BCL-2 inhibition. Leuk Lymphoma. 2013;54:1823–1825. doi: 10.3109/10428194.2013.796051. [DOI] [PMC free article] [PubMed] [Google Scholar]
- 33.Fukuda S, Pelus LM. Survivin, a cancer target with an emerging role in normal adult tissues. Mol Cancer Ther. 2006;5:1087–1098. doi: 10.1158/1535-7163.MCT-05-0375. [DOI] [PubMed] [Google Scholar]
- 34.Pasanen AK, Kuitunen H, Haapasaari KM, Karihtala P, Kyllönen H, Soini Y, Turpeenniemi-Hujanen T, Kuittinen O. Expression and prognostic evaluation of oxidative stress markers in an immunohistochemical study of B-cell derived lymphomas. Leuk Lymphoma. 2012;53:624–631. doi: 10.3109/10428194.2011.624226. [DOI] [PubMed] [Google Scholar]
- 35.Hirota K, Murata M, Sachi Y, Nakamura H, Takeuchi J, Mori K, Yodoi J. Distinct roles of thioredoxin in the cytoplasm and in the nucleus. A two-step mechanism of redox regulation of transcription factor NF-kappaB. J Biol Chem. 1999;274:27891–27897. doi: 10.1074/jbc.274.39.27891. [DOI] [PubMed] [Google Scholar]
Associated Data
This section collects any data citations, data availability statements, or supplementary materials included in this article.