Abstract
Motivation: The transition/transversion (Ti/Tv) ratio and heterozygous/nonreference-homozygous (het/nonref-hom) ratio have been commonly computed in genetic studies as a quality control (QC) measurement. Additionally, these two ratios are helpful in our understanding of the patterns of DNA sequence evolution.
Results: To thoroughly understand these two genomic measures, we performed a study using 1000 Genomes Project (1000G) released genotype data (N = 1092). An additional two datasets (N = 581 and N = 6) were used to validate our findings from the 1000G dataset. We compared the two ratios among continental ancestry, genome regions and gene functionality. We found that the Ti/Tv ratio can be used as a quality indicator for single nucleotide polymorphisms inferred from high-throughput sequencing data. The Ti/Tv ratio varies greatly by genome region and functionality, but not by ancestry. The het/nonref-hom ratio varies greatly by ancestry, but not by genome regions and functionality. Furthermore, extreme guanine + cytosine content (either high or low) is negatively associated with the Ti/Tv ratio magnitude. Thus, when performing QC assessment using these two measures, care must be taken to apply the correct thresholds based on ancestry and genome region. Failure to take these considerations into account at the QC stage will bias any following analysis.
Contact: yan.guo@vanderbilt.edu
Supplementary information: Supplementary data are available at Bioinformatics online.
1 INTRODUCTION
The maturity of high-throughput sequencing technology has greatly enhanced our ability to study the human genome. The rise of high-throughput sequencing technology also raises various bioinformatics challenges. One such challenge lies with the quality control (QC) of the sequencing data. As high-throughput sequencing becomes more commonly used, QC measures become more automatic and less obvious to the researcher. This is particularly dangerous if these QC measures introduce biases into the sequencing data that are not clear to the researcher using the data.
Adenine (A) and guanine (G) are two-ring purine-based nucleotides and cytosine (C) and thymine (T) are one-ring pyrimidine-derived nucleotides. In substitution mutations, transitions are defined as the interchange of the purine-based A↔G or pryimidine-based C↔T. Transversions are defined as the interchange between two-ring purine nucleobases and one-ring pyrimidine bases. The possible transversions are A↔C, A↔T, C↔G, G↔T. If substitution mutations occur randomly, then the Ti/Tv ratio [the number of transition single nucleotide polymorphisms (SNPs) divided by the number of transversion SNPs] averaged over a large enough number of substations should be 0.5, because there are two possible transitions and four possible transversions. However, a transversion is considered to be a more drastic change than a transition, because substitution of one-ring to two-ring chemical structure or vice versa (transversions) requires more energy than substitution without change in the ring structure (transitions). Thus, in real sequencing data, the transition and transversion ratio is often greater than 0.5. The Ti/Tv ratio has been used as an important parameter in many studies such as phylogenetic tree reconstruction and estimation of divergence. Recently, the transition/tranversion ratio has also been used as a QC parameter in high-throughput sequencing studies (Durbin et al., 2010; Emond et al., 2012; Guo et al., 2012a, b, 2013; Wang et al., 2014).
For human-exome sequencing data, the Ti/Tv ratio is generally around 3.0, and about 2.0 outside of exome regions (Bainbridge et al., 2011). The Ti/Tv ratio is also different between synonymous and non-synonymous SNPs (Yang and Nielsen, 1998). The Ti/Tv ratio for the haploid chromosomes (X in males, Y, mitochondria) is different compared to the diploid chromosomes (chromosomes 1–22). Much stronger bias toward transitions over transversions (Ti/Tv is between 21 and 38) in mitochondria has been observed in multiple studies (Lanave et al., 1986; Guo et al., 2012a). It has been suggested to consider haploid and diploid chromosomes separately when computing Ti/Tv ratios (Guo et al., 2013).
Another useful ratio to compute for genetic studies is the heterozygosity to non-reference homozygosity ratio (het/nonref-hom). There are three possible genotypes for a given diploid genomic position: AA, AB and BB. If A represents the reference, then the het/nonref-hom ratio of a person is computed as the number of SNPs with AB genotype dived by the number of SNP with BB genotype. Mathematically, the assumptions of Hardy–Weinberg equilibrium applied over a large set of multiple SNPs in one individual (instead of one SNP in a large number of multiple individuals, as is the standard case for Hardy–Weinberg equilibrium QC tests) results in a het/nonref-hom ratio of 2.0 (Guo et al., 2013). Thus for whole-genome sequencing, the het/nonref-hom ratio can be used also as a QC parameter.
In this study, we have performed in-depth analyses of the Ti/Tv and het/nonref-hom ratios to determine the range of variability in these measures. We focused our analyses on three major aspects of these measures: (i) Genomic region: defined as exon, intron, intergenic, micro RNA (miRNA) and non-coding RNA (lncRNA) (ii) SNP type: synonymous or non-synonymous, (iii) Subject continental ancestry: European, Asian, African and American. Furthermore, we also explored the reasons for the measured variations we observed among these three aspects.
2 METHODS
Three different datasets were selected to conduct our study. The major dataset is the 1000 Genomes Project (Abecasis et al., 2012) (1000G) released genotype data, which contain 1092 subjects from a diverse ethnicity background. The genotypes of the 1092 subjects were inferred by the 1000G research team from various sequencing data types, including targeted partial-exome sequencing, whole-exome sequencing, and low-pass whole-genome sequencing. Imputation techniques were used to impute the SNPs in strong linkage equilibrium (LD). The 1000G dataset is the most complete description of human genomes existing today in terms of number of subjects, geographic distribution and coverage of the genome. Thus, our analyses were focused on the 1000G dataset. The second dataset is part of the Shanghai Breast Cancer Study (SBCS) (Zheng et al., 2009) which contains 581 subjects. Illumina’s TrueSeq capture reagent was used to capture the exome sequence data in this dataset. Paired-end 100 base pair long reads were generated on the Illumina HiSeq 2000 platform. The third dataset derives from a study of hereditary colorectal cancer and includes six sequenced germline whole genomes from Caucasian subjects. Paired-end 100 base pair long reads were generated from the Illumina HiSeq 2000 for these six genomes.
For 1000G released data, no additional QC was performed by us. For dataset 2 and 3, thorough QCs were performed at the raw data, alignment, and variant calling level. Alignment was done using the Burrows–Wheeler Aligner (BWA) (Li and Durbin, 2009) against the HG19 human reference genome. We then marked duplicate reads with Picard and carried out regional realignment and quality score recalibration using the Genome Analysis Toolkit (GATK) (McKenna et al., 2010). For variant calling, we only used reads with a mapping quality score (MAPQ) ≥20 (i.e. ≤1% probability of being wrong) and bases with base quality score (BQ) ≥20. We used GATK's Unified Genotyper to call SNPs. GATK’s best practice SNP filtering recommendation was followed to produce the final list of SNPs used in our analyses.
We divided genomic regions into different subgroups by three criteria: genomic region, subject ancestry and functional categories. We considered five major regional categories: exonic, intronic, intergenic, miRNA and lncRNA regions. LncRNA was chosen as a region because there has been great research interest in lncRNA in the recent years led by the Encyclopedia of DNA Elements ENCODE project (Consortium et al., 2012). In 2012, the ENCODE project claimed that about 80% of the human genome is functional. This is a direct contradiction of previous understanding that only 3% of the human genome is functional. Even though this statement has been criticized by other scientists (Graur et al., 2013), it is undeniable that the hidden functionality in lncRNA might hold great potential research interest. ANNOVAR (Wang et al., 2010) was used to determine whether a SNP is in an exon, intron or intergenic region. If an SNP can be classified into multiple regions due to overlapping annotations of regions, it will be only considered once in the first region defined. Such SNPs consist of less than 0.1% of all SNPs and do not contribute to the result significantly. To determine whether a SNP resides in a non-coding RNA region, we used the release of Gencode .v19 file as reference. The ancestry subgroups were defined based on the 1000G definition. For the 1000G dataset, there are total of 14 subethnicity groups. Following the 1000G protocol, we grouped these into four major categories: African (ASW, LWK, YRI), American (CLM, MXL, PUR), Asian (CHB, CHS, JPT) and European (CEU, FIN, GBR, IBS, TSI). The full names of each subrace can be viewed in Supplementary Table S1. The 1000G American group is a complex admixed population with ancestry from all three other continental groups. All analyses on 1000G dataset were performed for each major ancestry group separately. The other two datasets only contain subjects from a single ancestry group and thus were not divided further by ancestry groups. Finally, the coding region SNPs were categorized by their functionality: synonymous or non-synonymous. Variations among ancestry groups and genomic regions were tested using the Kruskal–Wallis test (Kruskal and Wallis, 1987).
We also studied the effect of guanine–cytosine content (GC-content) on the two ratios. The concentration of GC-content has been directly linked to coding-sequence length (Oliver and Marin, 1996) and the proficiency of Illumina sequencing technology (Dohm et al., 2008). Because GC-content is regionally related, we examined the GC-content within the four genomic regions described previously. To extract each individual exon and intron location, we used RefSeq’s transcript transfer format (GTF) file. The exact exon start and end locations are given, and the intron start and end were computed based on the end and start of the corresponding exons. The nucleotide sequences were extracted for all exons and introns based on the HG19 human genome reference. GC-content was computed for each exon and intron. For intergenic regions, we divided the intergenic regions into 1 million base pair windows and computed their GC-content and ratios. For lncRNA, we computed the GC-content and ratio for each individual lncRNA based on the Gencode .v19 lncRNA release.
3 RESULTS
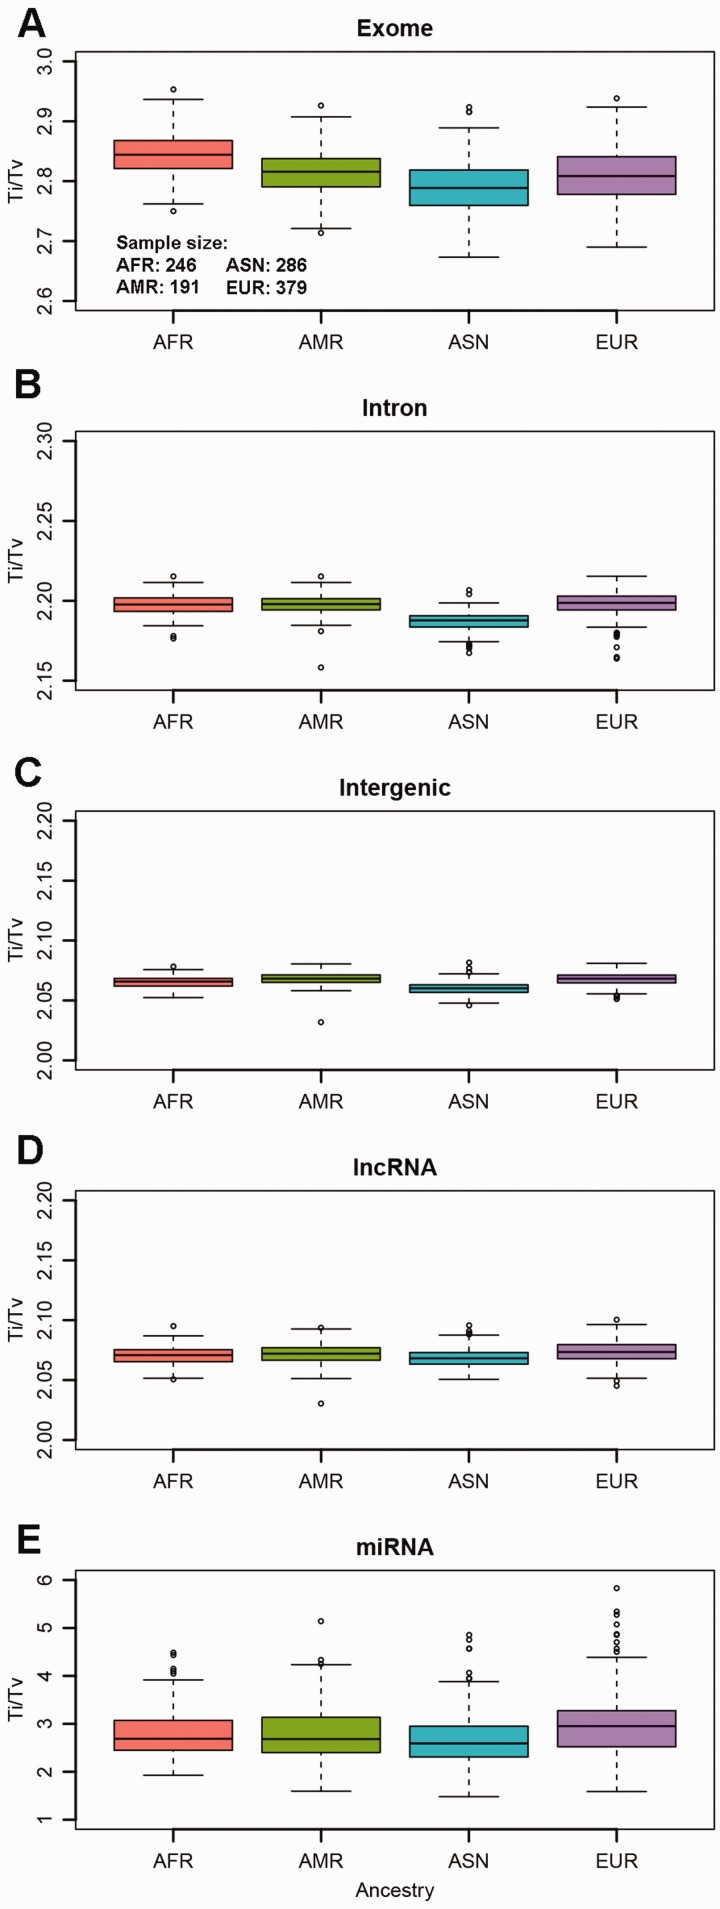
We first compared the Ti/Tv ratios of the five major regional categories. Even though the variations of Ti/Tv ratios were statistically significantly different due to high sample size (P < 0.0001) (Supplementary Table S2), there was not a visible substantial variation of the Ti/Tv ratios among the four ancestry groups (Fig. 1). For exonic regions, the African group had the highest Ti/Tv ratio median of 2.84, and the Asian group had the lowest median Ti/Tv ratio of 2.79. For intronic regions, all ancestry groups had similar median Ti/Tv ratios of around 2.2. The median Ti/Tv ratio continued to drop to around 2.06 for intergenic and lncRNA regions for all four ancestry groups. The median Ti/Tv ratios for miRNA regions are between 2.59 and 2.95 among the four ancestry groups. Higher variations were observed for Ti/Tv ratios in miRNA regions due to fewer SNPs reside in the short miRNA regions. Based on these results, the Ti/Tv ratio can be used to distinguish between exonic and non-exonic regions, and the Ti/Tv ratio of lncRNA behaves similarly to intergenic regions.
Fig. 1.
A Ti/Tv ratio for exome regions. B Ti/Tv ratio for intron regions. C Ti/Tv ratio for intergenic regions. D Ti/Tv ratio for non-coding RNA regions. E Ti/Tv ratio for miRNA regions. The variation for Ti/Tv is higher than other regions because much fewer SNPs are in miRNA regions
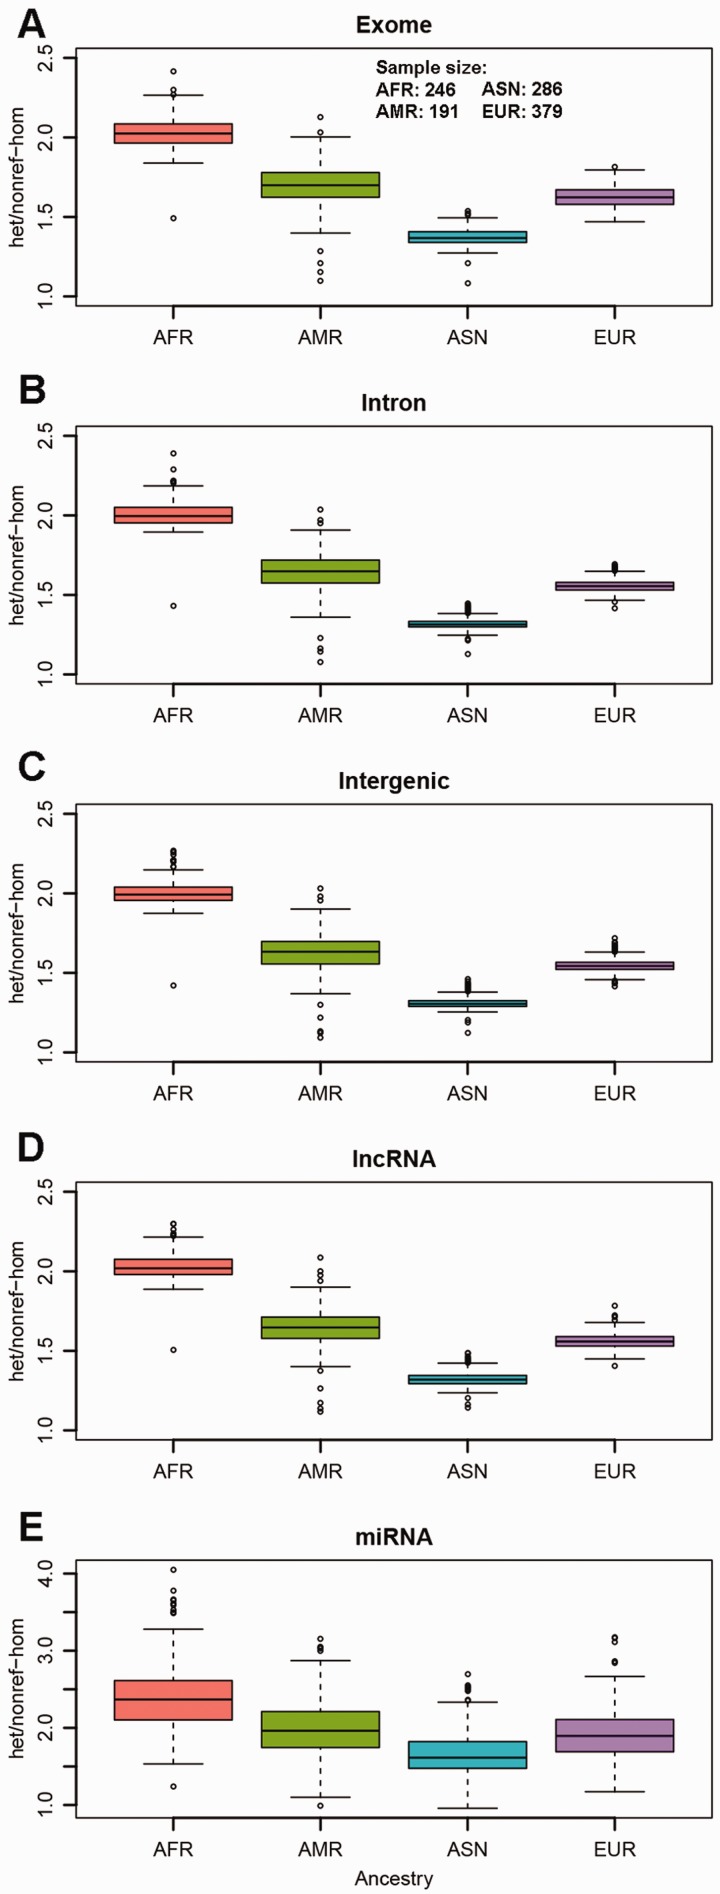
Next, we examined the het/nonref-hom ratios of the five major regional categories (Fig. 2) and found there were no major differences (Supplementary Table S2) between the het/nonref-hom ratios among the five regions. However, the het/nonref-hom ratio is strongly associated with continental ancestry. Among the four ancestry groups, Africans had the highest median het/nonref-hom ratio of around 2.0, and Asians had the lowest median het/nonref-hom ratio at 1.4. The median het/nonref-hom ratios for Americans and Europeans were around 1.7 and 1.6. From these results, clearly, the het/nonref-hom ratio is ancestry dependent, and the Ti/Tv ratio is genome region dependent.
Fig. 2.
A het/nonref-hom ratio for exome regions. B het/nonref-hom ratio for intron regions. C het/nonref-hom ratio for intergenic regions. D het/nonref-hom ratio for non-coding RNA regions. E het/nonref-hom ratio for miRNA regions
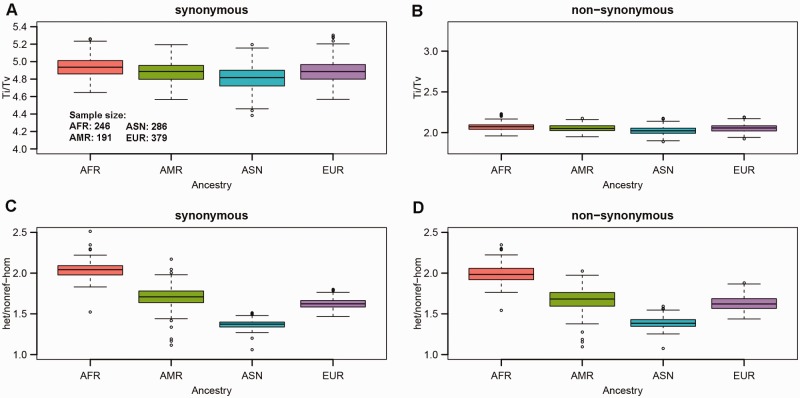
The next step after identifying SNPs from exome sequencing data involves annotation of the SNPs to assess their potential functionality. For the Ti/Tv ratio, there is a visible difference between synonymous and non-synonymous SNPs and little variation among ancestry groups (Fig. 3). Synonymous SNPs had a higher Ti/Tv ratio (median ratio around 3.1) compared with non-synonymous SNPs (median ratio around 2.1) for all four ancestry groups. For the het/nonref-hom ratio, there was no difference between synonymous and non-synonymous SNPs (Supplementary Table S2) observed. However, the strong variation between ancestry groups was present. Regardless of how we divided the SNPs (by regions or by functionality) the het/nonref-hom ratio patterns across the ancestry groups remained the same.
Fig. 3.
A Ti/Tv ratio for synonymous SNPs. B Ti/Tv ratio for non-synonymous SNPs. C het/nonref-hom ratio for synonymous SNPs. D het/nonref-hom ratio for non-synonymous SNPs
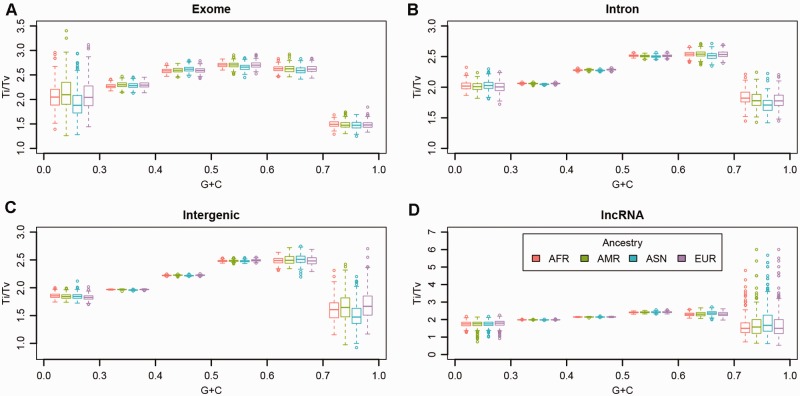
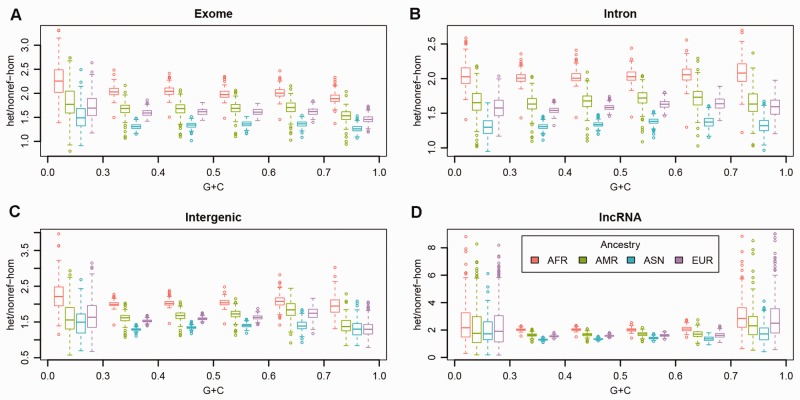
Because regions with extreme GC-content are rare in the human genome (Supplementary Figure S1), to balance the denominator when computing ratios we defined six unequal GC-content bins: 0.0–0.3, 0.3–0.4, 0.4–0.5, 0.5–0.6, 0.6–0.7 and 0.7–1.0 to give more GC-content range to regions with extreme high or low GC-content values. The GC-content had a clear non-linear effect on the Ti/Tv ratio (Fig. 4), with high and low GC-content resulting in lower Ti/Tv ratios. A similar pattern has been used to describe the effect of GC-content on Illumina sequencing depth (Benjamini and Speed, 2012; Guo et al., 2014). The regions with low GC-content (0–0.3) and high GC-content (0.7–1) had relatively higher variation for het/nonref-hom ratios than exons with moderate GC-content (03–0.6) due to fewer SNPs observed in extreme GC-content regions (Fig. 5). Again, the same ancestry variation described previously for the het/nonref-hom ratio was observed. The difference of Ti/Tv ratios observed among regions can be potentially explained by the differences of GC-content among these regions. We computed GC-content of the five regions we defined and the results are as follow: miRNA: 0.51, exome: 0.49, intronic: 0.42, lncRNA 0.40, intergenic: 0.38. The GC-content is directly correlated with Ti/Tv ratio (Spearman’s correlation coefficient r = 0.9).
Fig. 4.
A GC content and Ti/Tv ratio relationship for exome regions. B GC content and Ti/Tv ratio relationship for intron regions. C GC content and Ti/Tv ratio relationship for intergenic regions. D GC content and Ti/Tv ratio relationship for non-coding RNA regions
Fig. 5.
A GC content and het/nonref-hom ratio relationship for exome regions. B GC content and het/nonref-hom ratio relationship for intron regions. C GC content and het/nonref-hom ratio relationship for intergenic regions. D GC content and het/nonref-hom ratio relationship for non-coding RNA regions
Using the exome sequencing data from the SBCS study and whole-genome sequencing data from the colorectal cancer study, we further validated our results. Because each of the two additional studies only contained a single ancestry group, we could not divide the SNPs further by ancestry groups. Overall, we observed similar results for the two datasets compared to the 1000G dataset (Supplementary Figures S2 and S3). For the Ti/Tv ratio, separated by region, the exome regions had the highest value followed by intron regions. Intergenic regions and lncRNA regions had similar values, lower than intron or exon regions. Divided by functionality, synonymous SNPs had much higher Ti/Tv ratios compared to non-synonymous SNPs (t-test: SBCS P < 0.0001. Colorectal Cancer P < 0.0001). Stronger variations of het/nonref-hom ratios among the regions and functionalities were observed in the SBCS dataset. Due to the limitation of sample size (N = 6) in the colorectal dataset, it is difficult to draw conclusions on the variation of the colorectal dataset for het/nonref-hom ratio compared to the 1000G dataset. The sameconclusion can be reached regarding the GC-content evaluation (Fig. 3). Extreme GC-content tends to produce lower Ti/Tv ratios and relatively stable het/nonref-hom ratios were observed for regions with GC-content between 0.3 and 0.7. Extreme GC-content produced a wider range in het/nonref-hom ratio values.
Finally, we repeated our analyses of 1000G dataset by categrizing the SNP data by subancestry group (Supplementary Figures S4–S8). And the results were consistent with combined ancestry group.
4 DISCUSSION
High-throughput sequencing technology allows researchers to examine the human genome at the single nucleotide resolution instead of just the subset of previously known SNPs available on any genotyping array. One of the consequences of applying high-throughput sequencing technology is the ability to detect a much higher number of potential novel SNPs, which are generally undetectable by array technology. This advantage of high-throughput sequencing technology also brings the need for highly efficient and accurate QC for the SNPs detected. The QC of high-throughput sequencing data has been an important topic in the field of bioinformatics for the last few years. Within the scope of QC for SNPs inferred from sequencing data, unlike other QC parameters such as depth, genotype quality etc., the Ti/Tv and het/nonref-hom ratios cannot be used directly to filter individual SNPs but rather to measure the overall SNP quality for a sequence. For example, from previous studies, we know that SNPs in exome regions should have a Ti/Tv ratio of around 3. The general rule is that a higher Ti/Tv ratio usually indicates better quality SNPs, as long as the ratio is not too high (>4). If we observe a Ti/Tv ratio substantially lower than the expected value (<3.0) for exome SNPs, we know that usually increasing other QC filters such as depth and genotype quality score will cause the Ti/Tv ratio to also increase.
From our study, we conclude that the Ti/Tv ratio is highly dependent on the genome region and functionality. The exome regions tend to have the highest Ti/Tv ratio for SNPs, followed by intron regions. Intergenic regions and lncRNA regions have lower and similar Ti/Tv ratios. Thus, when using Ti/Tv ratios as a QC measurement, it is best to compute the Ti/Tv ratio by region rather than as a whole. The majority of DNA high-throughput sequencing studies focus on non-synonymous rather than synonymous SNPs. We found that synonymous SNPs have substantially higher Ti/Tv ratio than non-synonymous SNPs. The Ti/Tv ratio of non-synonymous SNPs is rather similar to the intergenic regions. The high Ti/Tv ratio of synonymous SNPs compared to non-synonymous SNPs can be explained through the probability of amino acid changes using the amino acid table. Out of all possible changes within the amino acid table, there are 33 synonymous transition and 36 synonymous transversions (random Ti/Tv ratio = 0.92) compared with 63 non-synonymous transition and 156 non-synonymous transversions (random Ti/Tv ratio = 0.40). Thus, it is also useful to categorize exome SNPs by their functionality before computing the Ti/Tv ratio. Futhermore, we found no association between the Ti/Tv ratio and ancestry, thus high-throughput sequencing studies on subjects of any ancestry groups can use the reported Ti/Tv ratio thresholds in this study as a QC guideline.
The het/nonref-hom ratio is not used as often as the Ti/Tv ratio for QC because it has been suggested that the het/nonref-hom ratio works best with whole-genome sequencing data, and the price of whole-genome sequencing remains high (>$4000 per sample) (Guo et al., 2013). Through our analyses, we found that the het/nonref-hom ratio is not dependent on genomic regions, thus it can be applied to exome regions alone and is also a reasonable QC measure for exome sequencing data. The expected value for the het/nonref-hom ratio in a whole-genome sequencing SNP data has been mathematically proposed to be 2.0 (Guo et al., 2013). However, our results show the het/nonref-hom ratio is highly dependent on ancestry. Out of the four major continental ancestries we tested, only the African group showed a het/nonref-hom ratio consistent with the expected value of 2.0. The other three continental ancestry groups, American, Asian and European, all had different het/nonref-hom ratios lower than 2.0. Since the Hardy–Weinberg equilibrium assumptions are used to calculate the expected value of 2.0, perhaps the African samples match the expected value because these assumptions are more accurately achieved in that older population, while they may be violated even subtly in the other three continental populations that have undergone several major bottlenecks through global migrations. Whatever the cause, our data show that it is important to evaluate the het/nonref-hom ratios separately by ancestry group.
Last, we studied the effect of the GC-content on both ratios and found that the het/nonref-hom ratio is not affected by GC-content, and the Ti/Tv ratio is negatively associated with both high and low extreme GC-content (0–30 and 70–100%). Thus, when performing QC on a smaller region, it is beneficial to compute the GC-content of that region and adjust your Ti/Tv ratio expectation based on the region’s GC-content.
Two additional datasets were used to validate the results we found from the 1000G dataset. The majority of the results are in agreement among the three datasets with some minor variation among datasets. These variations could be caused by the different sequencing technology used. The 1000G dataset was generated using a combination of low-pass whole-genome sequencing, exome sequencing, target region sequencing and imputation. Of the other two datasets, the SBCS study used exome sequencing, and the colorectal cancer study used whole-genome sequencing, and no imputation was performed. Also the variation could result from sample size and phenotype differences. The 1000G dataset contained significantly more subjects and is a population cohort, while the other two datasets contained breast cancer and colorectal cancer patients at much smaller sample sizes. Nonetheless, the two additional datasets provided supporting evidence for the conclusions we have drawn based on the 1000G dataset analyses.
In conclusion, the Ti/Tv and het/nonref-hom ratios can both be used as QC assessment of SNPs inferred from high-throughput sequencing data, but care must be taken that the subject ancestry and the function of the DNA sequenced (if not whole genome) are taken into consideration when setting limits for the reasonable values of these ratios. The ratio values provided in this study can serve as general guidelines for future studies.
Supplementary Material
ACKNOWLEDGEMENTS
We like to thank Margot Bjoring for editorial support.
Funding: This study was supported by P30 CA68485. The Shanghai Breast Cancer Genetic study is supported by NIH grants R01CA64266, R01CA158473, R01CA125558, R01CA148667 and R01CA118229 and the colorectal cancer study was supported by 5R00CA158141.
Conflict of interest: none declared.
REFERENCES
- Abecasis GR, et al. An integrated map of genetic variation from 1,092 human genomes. Nature. 2012;491:56–65. doi: 10.1038/nature11632. [DOI] [PMC free article] [PubMed] [Google Scholar]
- Bainbridge MN, et al. Targeted enrichment beyond the consensus coding DNA sequence exome reveals exons with higher variant densities. Genome Biol. 2011;12:R68. doi: 10.1186/gb-2011-12-7-r68. [DOI] [PMC free article] [PubMed] [Google Scholar]
- Benjamini Y, Speed TP. Summarizing and correcting the GC content bias in high-throughput sequencing. Nucleic Acids Res. 2012;40:e72. doi: 10.1093/nar/gks001. [DOI] [PMC free article] [PubMed] [Google Scholar]
- Consortium EP, et al. An integrated encyclopedia of DNA elements in the human genome. Nature. 2012;489:57–74. doi: 10.1038/nature11247. [DOI] [PMC free article] [PubMed] [Google Scholar]
- Dohm JC, et al. Substantial biases in ultra-short read data sets from high-throughput DNA sequencing. Nucleic Acids Res. 2008;36:e105. doi: 10.1093/nar/gkn425. [DOI] [PMC free article] [PubMed] [Google Scholar]
- Durbin RM, et al. A map of human genome variation from population-scale sequencing. Nature. 2010;467:1061–1073. doi: 10.1038/nature09534. [DOI] [PMC free article] [PubMed] [Google Scholar]
- Emond MJ, et al. Exome sequencing of extreme phenotypes identifies DCTN4 as a modifier of chronic Pseudomonas aeruginosa infection in cystic fibrosis. Nat. Genet. 2012;44:886–889. doi: 10.1038/ng.2344. [DOI] [PMC free article] [PubMed] [Google Scholar]
- Graur D, et al. On the immortality of television sets: “function” in the human genome according to the evolution-free gospel of ENCODE. Genome Biol. Evol. 2013;5:578–590. doi: 10.1093/gbe/evt028. [DOI] [PMC free article] [PubMed] [Google Scholar]
- Guo Y, et al. The effect of strand bias in Illumina short-read sequencing data. BMC Genomics. 2012a;13:666. doi: 10.1186/1471-2164-13-666. [DOI] [PMC free article] [PubMed] [Google Scholar]
- Guo Y, et al. Exome sequencing generates high quality data in non-target regions. BMC Genomics. 2012b;13:194. doi: 10.1186/1471-2164-13-194. [DOI] [PMC free article] [PubMed] [Google Scholar]
- Guo Y, et al. The use of next generation sequencing technology to study the effect of radiation therapy on mitochondrial DNA mutation. Mutat. Res. 2012c;744:154–160. doi: 10.1016/j.mrgentox.2012.02.006. [DOI] [PMC free article] [PubMed] [Google Scholar]
- Guo Y, et al. Three-stage quality control strategies for DNA re-sequencing data. Brief Bioinform. 2013 doi: 10.1093/bib/bbt069. [DOI] [PMC free article] [PubMed] [Google Scholar]
- Guo Y, et al. Multi-perspective quality control of Illumina exome sequencing data using QC3. Genomics. 2014;103:323–328. doi: 10.1016/j.ygeno.2014.03.006. [DOI] [PMC free article] [PubMed] [Google Scholar]
- Kruskal WH, Wallis WA. Citation classic - use of ranks in one-criterion variance analysis. Cc/Art Human. 1987:20–20. [Google Scholar]
- Lanave C, et al. Transition and transversion rate in the evolution of animal mitochondrial DNA. Biosystems. 1986;19:273–283. doi: 10.1016/0303-2647(86)90004-3. [DOI] [PubMed] [Google Scholar]
- Li H, Durbin R. Fast and accurate short read alignment with Burrows-Wheeler transform. Bioinformatics. 2009;25:1754–1760. doi: 10.1093/bioinformatics/btp324. [DOI] [PMC free article] [PubMed] [Google Scholar]
- McKenna A, et al. The Genome Analysis Toolkit: a MapReduce framework for analyzing next-generation DNA sequencing data. Genome Res. 2010;20:1297–1303. doi: 10.1101/gr.107524.110. [DOI] [PMC free article] [PubMed] [Google Scholar]
- Oliver JL, Marin A. A relationship between GC content and coding-sequence length. J. Mol. Evol. 1996;43:216–223. doi: 10.1007/BF02338829. [DOI] [PubMed] [Google Scholar]
- Wang GT, et al. Variant association tools for quality control and analysis of large-scale sequence and genotyping array data. Am. J. Hum. Genet. 2014;94:770–783. doi: 10.1016/j.ajhg.2014.04.004. [DOI] [PMC free article] [PubMed] [Google Scholar]
- Wang K, et al. ANNOVAR: functional annotation of genetic variants from high-throughput sequencing data. Nucleic Acids Res. 2010;38:e164. doi: 10.1093/nar/gkq603. [DOI] [PMC free article] [PubMed] [Google Scholar]
- Yang Z, Nielsen R. Synonymous and nonsynonymous rate variation in nuclear genes of mammals. J. Mol. Evol. 1998;46:409–418. doi: 10.1007/pl00006320. [DOI] [PubMed] [Google Scholar]
- Zheng W, et al. Genome-wide association study identifies a new breast cancer susceptibility locus at 6q25.1. Nat Genet. 2009;41:324–328. doi: 10.1038/ng.318. [DOI] [PMC free article] [PubMed] [Google Scholar]
Associated Data
This section collects any data citations, data availability statements, or supplementary materials included in this article.


