Abstract
Objectives
Recent data from mainly homogeneous European and African populations implicate a 140 bp region 5′ to the transcriptional start site of LCT (the lactase gene) as a regulatory site for lactase persistence and non-persistence. As there are no studies of United States non-homogeneous populations, we performed genotype/phenotype analysis of the -13910 and -22018 LCT SNPs in New England children, mostly of European ancestry.
Methods
Duodenal biopsies were processed for disaccharidase activities, RNA quantification by RT-PCR, allelic expression ratios by PCR, and genotyping and SNP analysis. Results were compared to clinical information.
Results
Lactase activity and mRNA levels, as well as sucrase-to-lactase ratios of enzyme activity and mRNA, showed robust correlations with genotype. None of the other LCT SNPs showed as strong a correlation with enzyme or mRNA activities as did -13910. Data were consistent with the -13910 being the causal sequence variant rather than -22018. Four individuals heterozygous for -13910T/C had allelic expression patterns similar to individuals with -13910C/C genotypes; of these, 2 showed equal LCT expression from the 2 alleles and a novel variant (-13909C>A) associated with lactase persistence.
Conclusion
The identification of -13910C/C genotype is very likely to predict lactase non-persistence, consistent with prior published studies. A -13910T/T genotype will frequently, but not perfectly, predict lactase persistence in this mixed European-ancestry population; a -13910T/C genotype will not predict the phenotype. A long, rare haplotype in 2 individuals with -13910T/C genotype but equal allele-specific expression contains a novel lactase persistence allele present at -13909.
Introduction
Lactase-phlorizin hydrolase (LPH, EC 3.2.1.108-EC3.2.1.62), the enzyme responsible for the digestion of milk lactose into the absorbable monosaccharides, glucose and galactose, is expressed only in the small intestine. LPH demonstrates positional regulation as exhibited by a tightly controlled pattern of expression along the proximal to distal axis of the intestine in both humans and other mammals, with high levels in the mid-intestine and reduced levels in the duodenum and distal ileum (1-4).
Lactase enzyme activity exhibits distinct patterns of expression, in both humans and non-human mammals, which are regulated mainly at the level of LPH transcription (1-4). In animals, LPH mRNA, protein and activity are low until just prior to birth when they rise dramatically. Levels then remain elevated until weaning, when they decline to less than 10% of the neonatal values; reduced activity is maintained throughout adult life.
In most human populations, lactase activity decreases during mid-childhood (at an average age of about 5 years, but with a broad range), resulting in low levels from that age onwards (termed lactase non-persistence) (5-7). This pattern is similar to that seen in all other mammals examined, but the time course is markedly extended in humans (8). Distinctively, a minority of the human population - especially people of Northern European ancestry, or of certain South Asian or African ancestries - retain high levels of activity throughout adult life (termed lactase persistence) (5-7). Persistence of elevated lactase activity has been clearly shown to be a relatively recent human evolutionary event, arising within the last 8-10,000 years, coincident with the development of dairying (9, 10), and has occurred on multiple independent occasions (11, 12).
In 2002, Enattah and colleagues (13) identified a C>T SNP at −13910 kb (rs4988235) upstream of the lactase transcriptional start site that correlated strongly with lactase persistence, and its converse with lactase non-persistence. All 99 individuals with low lactase activity were homozygous for a C at this SNP whereas all 137 individuals with lactase persistence carried either a C/T or T/T. A similar but not quite perfect association was found with a G>A SNP at −22018 bp (rs182549). No other variants were as tightly associated with lactase persistence as were these two SNPs. Interestingly, extended haplotypes had previously been associated with lactase persistence and non-persistence (14). In a second publication by the same group (15), these data were confirmed, and extended by demonstrating a statistically significant association between the T allele at −13910 and lactase persistence. Different variants explain lactase persistence in African populations (11, 12) and in other genetically diverse groups (16-19).
No studies to date have included a heterogeneous and genetically diverse population such as that found in the US. The goal of this research was to describe the association of genotypes at the -13910 and -22018 SNPs with clinical characteristics, RNA quantification and enzymatic phenotypes among a range of European ethnicities within the U.S. population, and to identify any other novel SNPs within the regions surrounding -13910. In addition to studying a genetically diverse population, this study used intestinal biopsies to obtain genotype and phenotype (enzyme activity, mRNA and allele-specific expression).
Methods
Patients and intestinal biopsy samples
Patients aged 8 to 23 years undergoing diagnostic esophago-gastroduodenoscopy were asked to participate in the study. Signed, informed consent/assent was obtained from each patient and his/her parent or legal guardian who agreed to participate. Indications for endoscopy included dysphagia, esophagitis, gastroesophageal reflux and chronic abdominal pain. Patients with diarrhea or a history of diarrhea were excluded from the study. Patients with inflammatory bowel disease, celiac disease, other known inflammatory conditions, gastrointestinal bleeding, or compromised immune systems were also excluded from the study. This protocol was approved by the institutional review board at Boston Children's Hospital.
Six mucosal pinch-biopsy specimens were obtained from each patient, taken from the distal end of the third portion of the duodenum during endoscopy. Two biopsies were processed immediately for histological examination, which showed normal villous mucosa in all patients. The four remaining specimens were snap frozen on dry ice immediately upon removal from the patient, and stored at -80°C. The first biopsy sample was used in disaccharidase activity assays. The second sample was used for RNA isolation (RNeasy, Qiagen, Valencia, CA), followed by quantitative RT-PCR for lactase and sucrase mRNAs, and PCR for allelic expression ratios (20). The third sample was used to isolate DNA for genotyping and SNP analysis, while the fourth was kept in reserve in case of inconsistent data or for future studies.
DNA extraction
DNA was isolated according to the manufacturer's instructions using the DNeasy mini blood and tissue kit (Qiagen, Valencia, CA). DNA was quantified by optical density at 260 nm using the NanoDrop 1000 Spectrophotometer (Thermo Scientific, Wilmington, DE).
Genotyping
All genotyping was performed using the Sequenom MassARRAY platform (21) with both hME and iPLEX protocols, as described elsewhere (22, 23). All SNPs were obtained from the 5′ region of the LCT (lactase) gene, spanning one megabase of extended haplotype (10, 24). In order to choose SNPs to determine the haplotype around LCT -13910 in the patient sample, allele frequencies for all HapMap SNPs were compared between persistent and non-persistent haplotypes using delta and Shannon information content. The SNP with the highest delta in each 50-100 kb bin was chosen. Forty-four SNPs in 12 megabases were genotyped. Another 38 SNPs were chosen to determine the continental ancestry of individuals in the panel (25). Three African-derived lactase SNPs (-14010G/C, -13915T/G, and -13907C/G) were genotyped as well (11, 26). In order to be included for analysis, SNPs were required to pass quality control measures, including genotyping greater than 90 percent in the sample, and being in Hardy-Weinberg equilibrium.
Analysis of Genotype Data
We used PHASE 2.1 (27, 28) to reconstruct the haplotypes around the LCT -13910 locus, using 44 SNPs previously described (10). The phased haplotypes were compared to data from Bersaglieri et al. (10) to determine persistent and non-persistent haplotypes of all individuals in the study. We compared the genotype of each individual at the -13910 to the haplotypes in order to correlate the presence of the T allele at -13910 to the persistence haplotype, as previously described.
To estimate continental ancestry, we used as references the HapMap phase II data (A second generation human haplotype map of over 3.1 million SNPs, The International HapMap Consortium (29), with the CEU, YRI, and HCB/JPT reference panels taken as representative of the ancestral populations corresponding to different continents. We retrieved genotype data in the panels from 38 ancestry informative SNPs (30). Weighted reference panels based on empirical estimates of ancestry were used for capturing untyped variation in the genotyped patient samples (30). Using the program Structure 2.2 (31) we estimated the probability of source population in each individual in the patient sample and confirmed that empirically estimated genetic ancestry at the continental level correlated closely with self-described ethnicity.
Disaccharidase activity
Lactase and sucrase specific activities were determined in the Gastrointestinal Laboratory of the Buffalo Children's Hospital (Kaleida Health; Buffalo, NY.) by the method of Dahlqvist (32, 33). Tissue was homogenized at 4°C in maleate buffer, incubated with the appropriate substrate at 37°C for 60 minutes, and immersed in a boiling water bath for 5 minutes. The glucose concentration of the sample was quantified using Sigma Infinity glucose reagent (Sigma-Aldrich; St. Louis, MO). Disaccharidase activity was calculated per gram of protein, and enzyme activity reported as units/g protein, where 1 unit equals 1 micromole of substrate hydrolyzed per minute at 37°C per gram of protein. Lactase persistence was defined as specific activity >15 u/g protein, and non-persistence as <15 u/g. Sucrase activity was considered normal if it was >25 u/g protein. Patients included in the final analysis of data all had sucrase levels higher than 25 u/g. Sucrase to lactase ratios of 2 or less were considered lactase persistence, and ratios >2 were considered non-persistence, as previously published (34).
RNA isolation, real time RT-PCR and quantification of RNA levels
RNA isolation, real time RT-PCR and quantification of RNA levels were conducted as previously described (35). Briefly, duodenal biopsy samples were homogenized using a Polytron PT 1200 (Kinematica, Switzerland). RNA was purified by the guanidium thiocyanate method (RNeasy mini kit, Qiagen) followed by DNase treatment (DNA free kit, Ambion; Austin, TX). RNA was quantified by optical density at 260 nm, using the NanoDrop 1000 Spectrophotometer (Thermo Scientific; Wilmington, DE). RNA quality was verified using the Experion Bioanalyzer system (Bio-Rad Laboratories, Inc; Hercules, CA). Only non-degraded RNA samples were used in downstream analysis. cDNA (reverse-transcribed RNA) was synthesized using iScript (Bio-Rad Laboratories, Inc; Hercules, CA) according to the manufacturer's instructions. Primer pairs were designed using Beacon Design software (PREMIER Biosoft International; Palo Alto, CA) and optimized as described previously (36). Quantitative RT-PCR was carried out using the iCycler program and iQ SYBR Green Supermix (Bio-Rad) in triplicate. Reactions were conducted with 10 pmol of both forward and reverse primers at an annealing temperature of 53°C and an extension temperature of 72°C. Controls were used for all samples to confirm the absence of DNA contamination. Expression levels were corrected for the glyceraldehyde-3-phosphate dehydrogenase gene (Gapdh), and expressed relative to the calibrator, which was a large pool of RNA extracted from a surgical jejunal specimen from an adolescent male. Sucrase to lactase mRNA ratios were calculated and analyzed according to genotype.
Allele-specific Expression
Seven SNPs were chosen for allelic expression analysis, based on location within the transcribed regions of LCT (22). Genotyping was performed using the Sequenom MassARRAY platform with the hME protocol, as described elsewhere (22). Peaks obtained were the signal for the primer extension product corresponding to each allele. The ratios of the peaks give the ratio of the alleles present in the DNA or cDNA sample. Genomic (gDNA) and reverse-transcribed RNA (cDNA) for individuals who were homozygous for the C allele at -13910 or heterozygous at -13910 were genotyped at the 7 SNPs. Each gDNA was genotyped in quintuplicate, while cDNA samples were genotyped in triplicate. Replicate gDNA or replicate cDNA discordant at a marker were removed from the analysis. For the -13910C/T samples with evidence of equal allelic expression, the analysis was repeated with a second cDNA sample. The ratio of signal to noise for each allele of the transcribed SNP determined the allelic expression, as previously described (22).
PCR and Sequencing
A roughly 600 bp region flanking -13910C>T (rs4988235) was amplified by PCR in samples (11, 64, 71, and 82). Primer pairs 1F 5′-ATCTCCGCCAGAGAGATGG-3′, 1R 5′-ATCTCCGCCAGAGAGATGG-3′ (11) and 2F 5′-CATGCCATACATTTCCCTTTTT-3′, 2R 5′-AATGCTCATACGACCATGGAAT-3′ were used. PCR conditions were a 30 ul reaction containing 50 ng of DNA, 167 uM of each primer, 100 uM dNTP, 3 mM MgCl2, 1× PCR Buffer (HotStarTaq DNA Polymerase, Qiagen, Valencia, CA), and 1.5 U of Taq polymerase. A thermal cycler program was used in the following order: 1 cycle at 94°C for 2 minutes, 35 cycles at 94°C for 30 seconds, 59°C for 30 seconds, then 72°C for 1 minute, and 1 cycle at 72°C for 10 minutes. PCR products were purified and sequenced using the Sanger method.
Haplotype Phasing by Cloning
PCR products from samples 71 and 64, amplified using the primer set 2F and 2R, were cloned using the TOPO TA Cloning Kit (Life Technologies, Inc, Grand Island, NY) according to the manufacturer's instructions. Plasmid DNA was extracted and sequenced using the Sanger method.
Statistical Analysis
The frequency of the lactase non-persistence phenotype was compared among three age groups by the Pearson Chi-square statistic. Lactase and sucrase levels were positively skewed, and unadjusted results are reported as median and inter-quartile range (IQR). Four outcome variables (lactase, sucrase-to-lactase ratio, mRNA fold change, and sucrase-to-lactase mRNA ratio) were right-skewed as well. The Kruskal-Wallis test and Wilcoxon rank-sum test were used to examine the association between each outcome and the -13910 genotypes. Tests of significance were conducted among the three genotypes at -13910, and by the principle of closed testing, adjustment for multiplicity was unnecessary (37, 38). All tests of significance were two-sided, and all analyses were performed with SAS/STAT® software (Version 9.1) of the SAS® System for Windows (SAS Institute Inc, Cary, NC).
Results
In all, 103 patients consented to participate in this study. Of the patients, 69% were of self-described northern European descent and 25% were of non-European, non-Asian descent (Table 1 and Supplemental Table S1). Nine subjects were excluded because of incomplete data. Thus, intestinal biopsy samples from a total of 94 patients, aged 8-23 years (53 female and 41 male) were subjected to disaccharidase analysis. All pathology reports verified that the biopsied duodenum was normal, with normal crypt-villus ratios and no intraepithelial lymphocytes. An additional 14 subjects were then eliminated from further analysis because of sucrase values <25 u/g protein (indicating either subtle focal intestinal injury, injury to the sample during shipping, or technical error, Supplemental Table S3). Thus, the final number of subjects with complete data was 80.
Table 1.
Ethnic background (n=103). Patients (or their guardians) were asked to indicate the ethnic origin of their parents in a questionnaire. Details of the ethnic background of all subjects enrolled in the study are in Supplemental table 1.
| Predominant region of origin | ||
|---|---|---|
|
|
||
| Ethnicity | Mother | Father |
| Europe | ||
| North | 47 | 45 |
| South | 13 | 9 |
| East | 7 | 7 |
| West | 8 | 7 |
| Asia1 | 2 | 5 |
| Other2 | 17 | 15 |
| Unknown | 9 | 15 |
Includes countries in the Middle East, Northern, Southern and Eastern Asia.
Represents patients from countries in Sub-Saharan Africa, North and South America, and the Caribbean.
Distribution of lactase enzyme activities
The distribution of lactase enzyme activities of all 80 subjects is shown in Figure 1; lactase specific activities did not show an age-dependent pattern (Supplemental Fig 1a) in contrast to data of Wang et al.(8), Sucrase activity did not vary with age (Supplemental Fig 1b). In regard to clinical symptoms, 6 individuals reported themselves to be lactose intolerant, 10 other subjects were unsure of their clinical responses to lactose and the remainder reported that they were lactose tolerant. However, using the accepted standard of lactase activity <15 u/g protein indicating non-persistence, 34 individuals were non-persistent, including 4 of the 6 self-reported lactose intolerant patients. The frequency of the lactase non-persistence phenotype was compared among patients in three age groups and found not to be statistically different (P=0.98): 8-10 years (44% with lactase non-persistence), 11-15 years (41% with lactase non-persistence), and 16-23 years (43% with lactase non-persistence,). As the youngest group studied demonstrated a similar prevalence of non-persistence as the oldest group, it was clear that lactase non-persistence was already established in this population prior to age 8 years.
Figure 1.
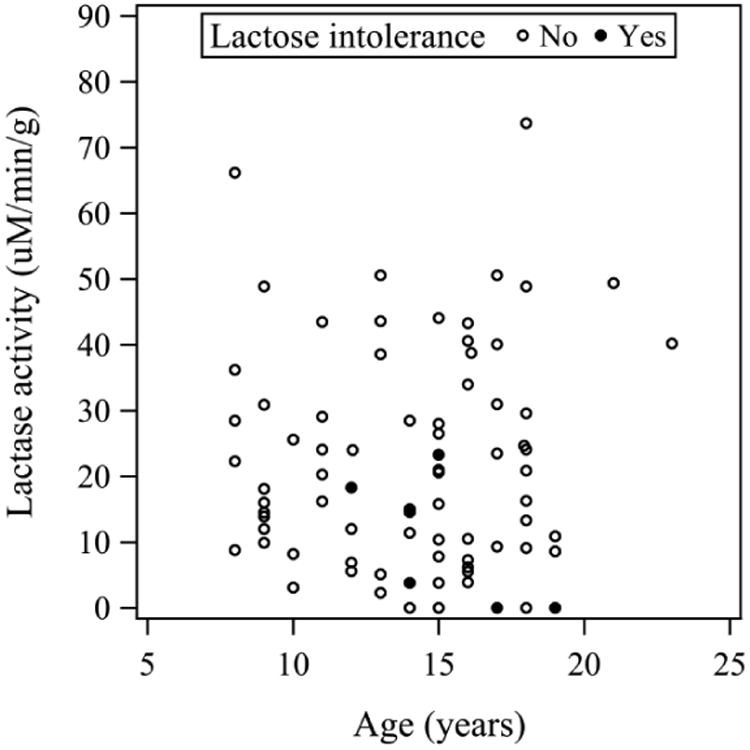
Lactase activity and subject age. Disaccharidase activities were assayed in biopsy specimens from 80 patients and compared to age obtained from the study questionnaire at the time of endoscopy. No age-dependent differences in lactase activity were detected (P=0.76, see Supplemental Figure 1a). Similar data were obtained for sucrase activity (P=0.73, see Supplemental Figure 1b) Self-reported lactose intolerance is indicated by a filled circle (●).
Genotype/phenotype correlations at -13910T/C
Among 80 subjects with lactase activity level available, 15 subjects with the genotype -13910C/C were non-persistent by enzyme assay, including three of the six subjects who reported being lactose intolerant (Figure 2a). The median lactase activity in this group of 15 patients was 3.9 u/g protein, with an interquartile range from 2.3 to 7.8. There were 34 patients with the genotype -13910T/C. Of these, 14 subjects (41%) were non-persistent by lactase activity while 20 (59%) were persistent (Figure 2a). The median lactase activity was 17.3 u/g protein, with an interquartile range from 9.9 to 24.1. This group included the other three self-reported lactose intolerant subjects. Of the 23 subjects genotyped as -13910T/T, the majority (87%) had enzyme activity above 15 u/g protein (Figure 2a). The median value for this group was 30.9 with an interquartile range from18.1 and 40.2. Eight subjects were not genotyped due to poor quality of the DNA.
Figure 2.
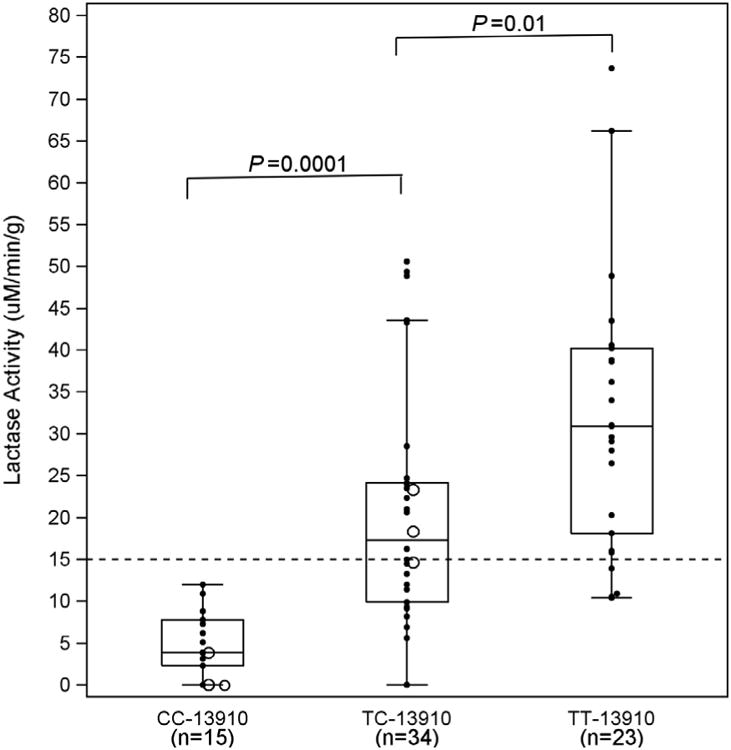
a Box plot of lactase enzyme activity expressed by genotypes. The CC -13910 is the homozygous non-persistent genotype; TC -13910 is the heterozygous genotype; and TT -13910 is the homozygous persistent genotype. Genotype was also determined at the -22018 SNP (GG, GA, and AA). Most subjects expressed the genotypes CC/GG, TC/GA, and TT/AA, except 1 individual with CC/GA (lowest value in box at CC-13910), and two with TC/AA (lowest and highest in box at TC-13910). Lactase activity progressively increased from CC to TT (P<0.0001). Open circles indicate individuals who self-reported being lactose intolerant. The dashed horizontal line denotes the established 15 μM/min/g cut-point for lactose intolerance, and reveals that half of our study patients were lactase enzyme deficient. Analysis for this Figure and Figures 2b, 3a and 3b is based on individuals with complete data.
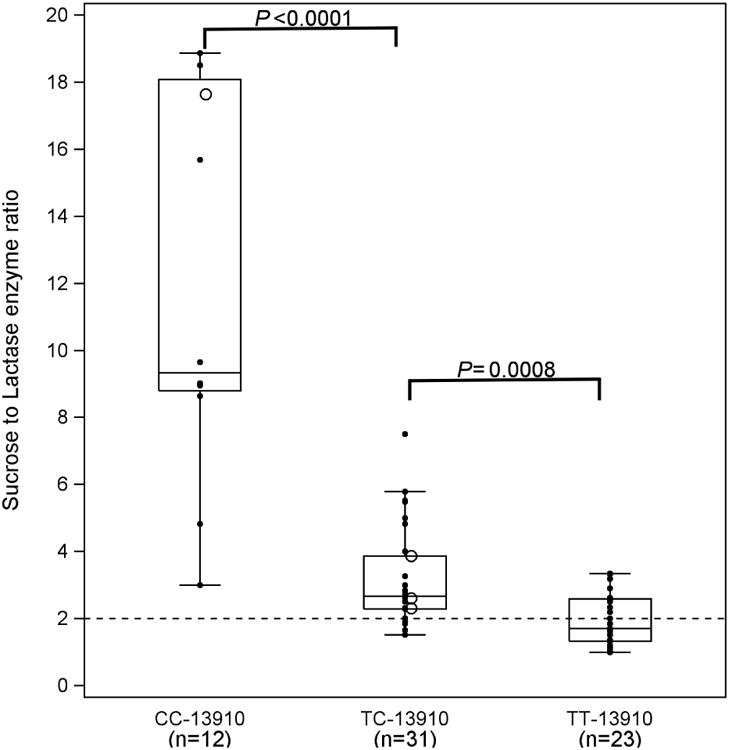
b Sucrase to lactase enzyme activity ratio (S:L) expressed by genotype. S:L decreased from CC-13910 to TT-13910, P<0.0001. Ratios > 2 are considered lactase non-persistent, while ratios 2 or less indicate lactase persistence (31) shown by the dashed horizontal line.
Group comparisons of lactase activity and -13910 genotypes showed a progressive increase in lactase activity from -13910C/C to -13910T/T (P<0.0001, Fig.2a). Lactase activity was lowest for -13910C/C, followed by -13910T/C and -13910T/T. All were statistically different from one another (P<0.01 for each comparison). None of the subjects with an enzyme activity greater than 15 u/g protein had the non-persistent genotype -13910C/C; however, 44% of patients with activity less than 15 had a genotype -13910T/C, while 3 had the persistent genotype -13910T/T (Figure 2a). Careful review of these individuals failed to identify any clinical or phenotypic features that could explain this difference. Furthermore, their sucrase specific activities were in the normal range, confirming the adequacy of the biopsy specimens. No age-related variation in sucrase activity was detected (Supplemental Figure 1b).
Figure 2b compares genotypes to enzyme activity expressed as sucrase to lactase ratios calculated to be certain that all tissue samples were indeed adequate. Ratios greater than 2.0 were considered lactase non-persistent (34). While the data are reciprocal to the lactase activity shown in Figure 2a, the results demonstrate similar relationships of activity ratios to genotype. Six subjects had lactase activity of zero and ratios could not be calculated. Thus, among 66 subjects with sucrase:lactase ratio available, genotype -13910C/C expressed the non-persistent ratio: median 9.3 (8.8, 18.1); those with genotype -13910T/C showed both persistent and non-persistent ratios: 2.7 (2.3, 3.9); and most with genotype -13910T/T demonstrated persistent ratios: 1.7 (1.3, 2.6). As shown in Figure 2b, the pattern of sucrase to lactase ratio for the 3 genotypes decreased progressively (P<0.0001), with all three statistically different from one another (P<0.0.001 for each comparison).
We also analyzed the levels of lactase mRNA and sucrase to lactase mRNA ratios expressed in relation to genotype (Figures 3a and 3b). Although previous studies have demonstrated a strong correlation between lactase enzyme levels and lactase mRNA expression (34, 39, 40), no threshold has been established for distinguishing lactase persistence from non-persistence using mRNA quantification. As shown for lactase enzyme activity, lactase mRNA levels increased from -13910C/C to -13910T/T (P<0.001) (Figure 3a), with all three groups statistically different from one another (P<0.05 for each). Also, as with sucrase to lactase enzyme ratio (Figure 2b), the sucrase to lactase mRNA ratio decreased from genotype -13910C/C to -13910T/T (Figure 3b, P<0.0001). Once again, all levels were statistically different from one another (P<0.05 for each).
Figure 3.
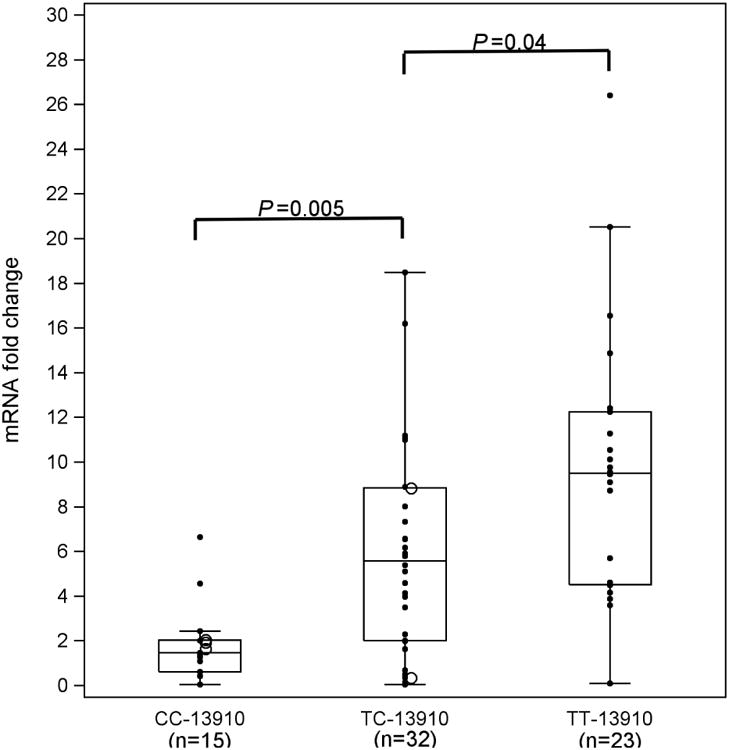
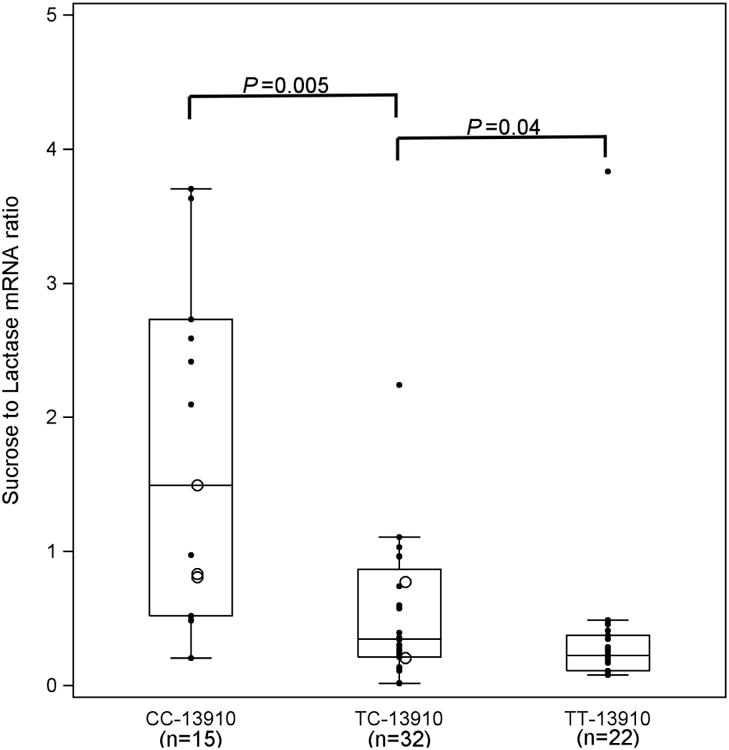
a Lactase mRNA fold change by genotype at -13910. We analyzed lactase mRNA by real time RT-PCR and expressed it relative to a standard sample. The mRNA expression increased from CC -13910 to TT -13910 (P=0.0001).
b Sucrase to lactase mRNA ratios by genotype at -13910. The mRNA expression of sucrase was also analyzed by real time RT-PCR and expressed relative to a standard sample. The relative fold change in sucrase mRNA was compared to relative lactase mRNA levels to generate a ratio, parallel to the methodology used for enzyme ratios (Figure 2b). The sucrase mRNA expression decreased from CC-13910 to TT-13910 (P=0.0001)
Genotype/phenotype correlations at other SNPs
In addition to the genotypes at -13910 (C/C, T/C, and T/T), we also examined the association between lactase enzyme activity and lactase mRNA levels with genotypes at the remaining LCT SNPs flanking the -13910 locus. As expected, none of the other SNPs showed as strong a correlation with enzyme or mRNA activities as did -13910T/C. The -22018G/A variant was nearly perfectly correlated with -13910T/C (data not shown), as seen in other studies (13, 41); most subjects expressed the genotypes C/C-G/G, T/C-G/A, and T/T-A/A. Examination of the few discordant individuals was consistent with -13910T/C being the causal sequence variant rather than -22018G/A. One subject with a genotype C/C-G/A had low lactase activity (3.1 u/g protein), consistent with the -13910 genotype. One individual with genotype T/C-A/A had a lactase level of 5.5 u/g protein, lower than the other -22018A/A individuals but consistent with levels seen for -13910T/C individuals.
Allele-specific expression
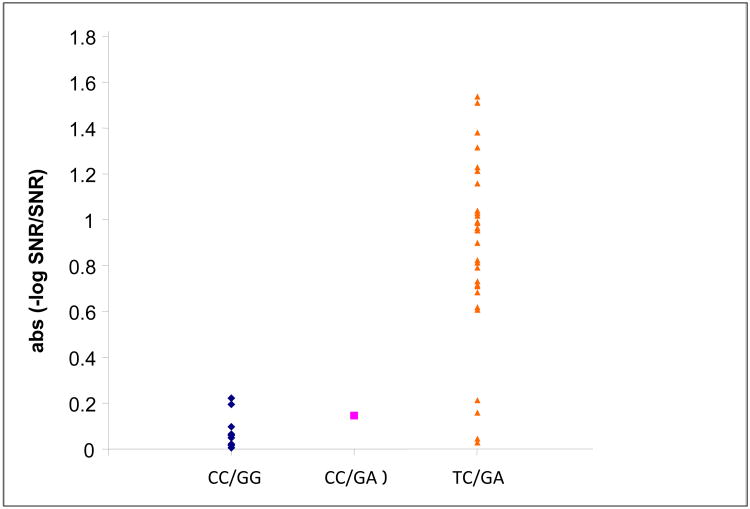
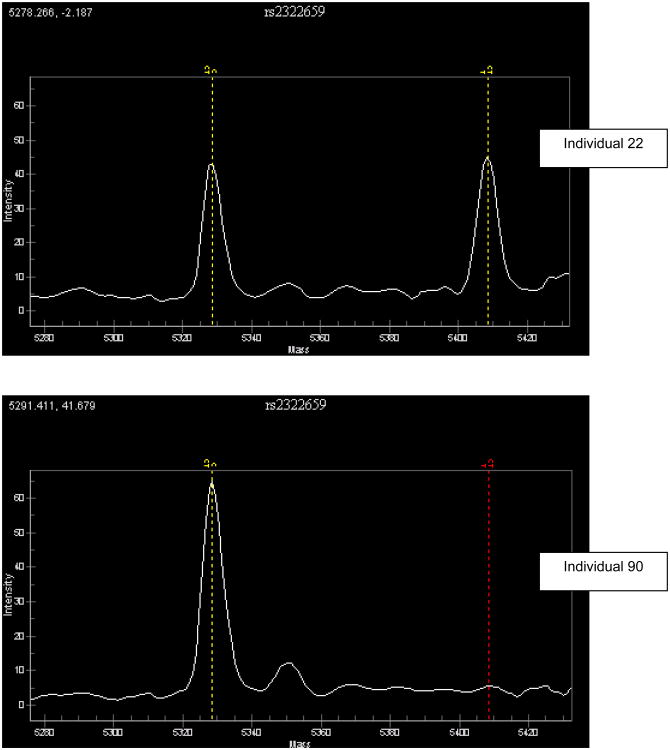
We also performed allele-specific expression analysis (22) on all samples where the analysis was possible (samples that passed quality control and were heterozygous for SNPs within the transcribed portion of the LCT gene). The individuals who were homozygous for the non-persistence allele at -13910 showed equal levels of expression, although signals were generally reduced, consistent with a low level of expression in these individuals (Figure 4a). As expected, most individuals heterozygous for -13910T/C showed strong T-allele-specific expression with an average ratio of 10.35 and standard deviation of 8.58, while individuals homozygous for the C allele at -13910 displayed equal expression from both alleles with an average ratio of 0.9169 and standard deviation of 0.1718 (Figure 4b). We did not see a pattern of dampened allelic-specific expression in individuals with -13910T/C genotypes who had low lactase enzymatic activity or mRNA levels (data not shown). This finding is consistent with prior data where two heterozygous individuals with low lactase/sucrase ratios showed clear evidence for allelic imbalance (42), and suggests that allele-specific expression is more tightly correlated with -13910T/C genotype than are enzyme levels or mRNA levels.
Figure 4.
a Allelic specific expression for individuals with the genotypes shown. The data are the absolute values of the −log10 ratio of signal-to-noise (SNR) for alleles at transcribed SNPs across individuals with genotypes of CC/GG, CC/GA, and TC/GA at -13910 and -22018.
b Example of allelic expression at transcribed SNP rs2322659 for two individuals with different genotypes at -13910. Individual 22 has a genotype of C/C at -13910 and as expected shows equal expression of the two alleles. Individual 90 has a genotype of T/C at -13910 and as expected shows unequal expression at the transcribed SNP rs2322659. The vertical dashed lines indicate the expected location of the signal for each of the two alleles at the transcribed SNP.
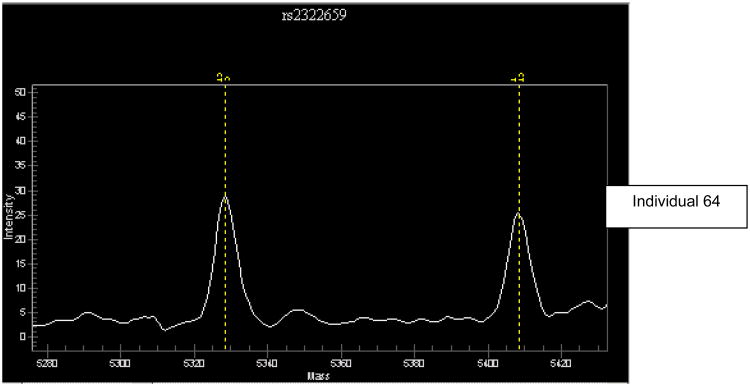
c Unanticipated equal expression of the two alleles at SNP rs2322659 for -13910T/C genotyped individual 64. Vertical dashed lines are as in Fig. 4b.
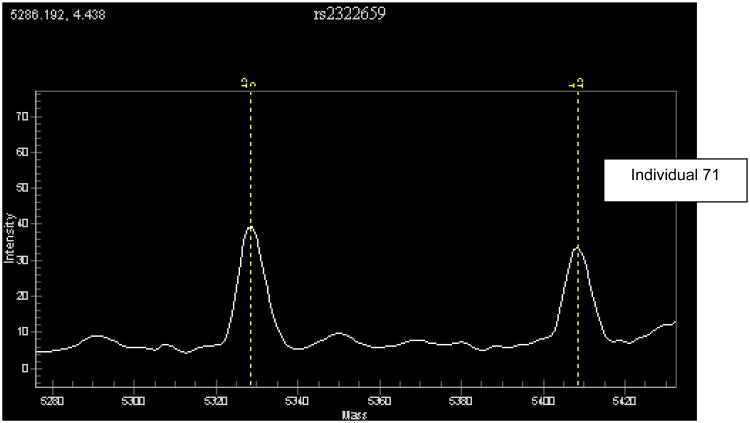
d Unanticipated equal expression of transcribed SNP rs2322659 for -13910T/C genotyped individual 71. Vertical dashed lines are as in Fig 4b.
Surprisingly, four individuals heterozygous for -13910T/C (individuals 11, 64, 71, and 82) had allelic expression patterns similar to those seen in individuals with -13910C/C genotypes (Supplemental Table S2). A similar observation in one patient was previously described by Poulter et al (24). Two were particularly striking (individuals 64 and 71); despite being heterozygous at -13910T/C, they showed equal LCT expression from the two alleles (Figures 4c, 4d). This result was unexpected because the -13910T allele has been strongly correlated in European populations with lactase persistence, as measured by allele-specific expression (15, 42, 43). The finding of equal expression strongly suggests the presence of a second lactase persistence allele on chromosomes carrying -13910C, which to our knowledge has not been described in European-derived populations.
We first considered whether the equal expression could be due to a second persistence allele of non-European origin. The individuals were both of self-described European ancestry: one (individual 64) reported grandparental countries of origin as Northern Europe and Unknown, and the other (individual 71) reported grandparental countries of origin as Ireland, England, and Scotland. We also directly estimated the continental ancestry of these individuals using ancestry informative markers, and the data were consistent with a recent European ancestry for both individuals (and also showed that they were unlikely to be identical twins or first degree relatives). Finally, we typed the known African-derived lactase persistence variants, G/C-14010, T/G-13915, and C/G-13907 (11, 26) and both individuals were homozygous for the non-persistence alleles. Thus, these results strongly suggest that the equal allelic expression in these two individuals is not explained by a lactase persistence allele originating outside of Europe.
We also noticed that the two individuals with the presumed second persistence allele shared a long haplotype that was not present in other individuals in our study and was quite distinct from the haplotype on which the -13910T allele is typically found. Indeed, these individuals were genotypically identical over a stretch of 2.2 Mb from SNP rs655472 to rs1427602, and analysis of their phased genotype data indicated that they share both the usual -13910T-containing haplotype associated with lactase persistence in Europeans (10, 24), as well as a different long haplotype that presumably carries the second persistence allele. These data suggest that the second persistence allele was inherited from a recent common ancestor of these two individuals. These data are consistent with the presence of the same low frequency haplotype in both individuals, and could be consistent with recent positive selection or cryptic relatedness of these two individuals. The presence of the same rare haplotype in the two individuals with equal allele-specific expression also strongly suggests that they share a lactase persistence allele that is present at low frequency in the European population.
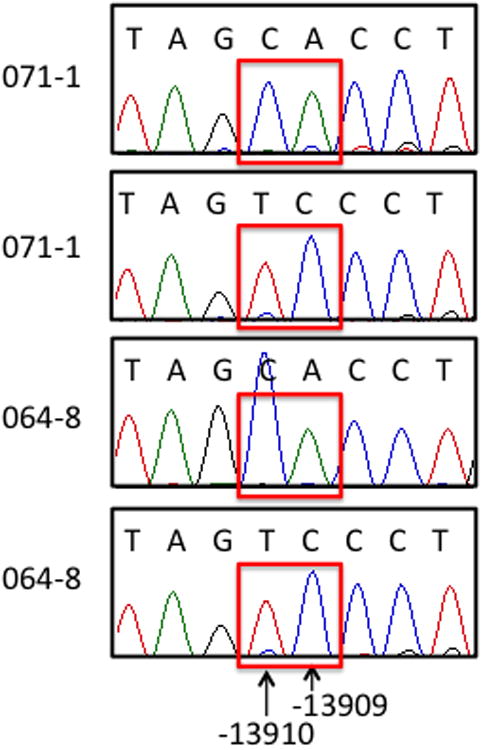
To try to identify the low frequency lactase persistence allele, we sequenced ~600 bp surrounding -13910C>T in these two individuals, as well as the other two individuals with an allele specific expression similar to that seen in the -13910C/C individuals (11 and 82). We did not identify any of the potential lactase persistence alleles reported to be present in European-ancestry individuals in recent publications (11-13). SNPs associated with lactase persistence in other heterogeneous populations were also absent (16-19). However, we discovered a novel C>A variant at -13909, present in both of the individuals who share a long, novel haplotype in this region (64 and 71). Both individuals were heterozygous at this location (Figure 5a) while 11 and 82 were homozygous C/C. If -13909C>A were a novel lactase persistence allele, the equal expression from both alleles in individuals 64 and 71 would predict that -13910C>T and -13909C>A would be on the same haplotype. We determined haplotypic phase by cloning and sequencing this region, and found that in both individuals the -13910C segregated with the -13909A and the -13910T segregated with the -13909C allele, confirming the presence of a second persistence allele on a different haplotype from the -13910T haplotype found in Europeans (Figure 5b).
Figure 5.
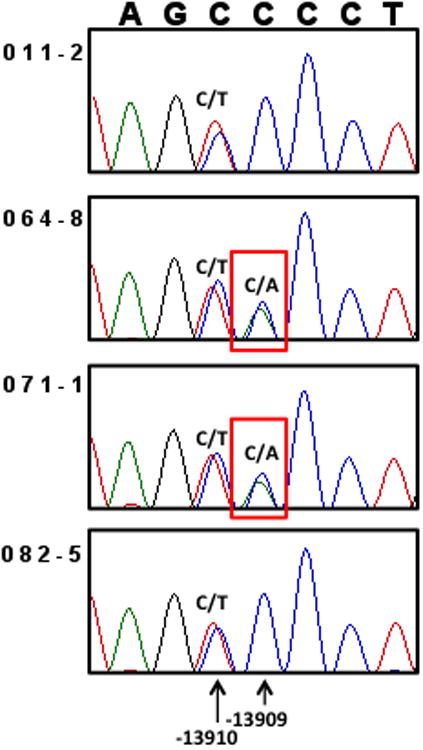
a. Sanger sequencing reveals heterozygosity for a novel variant -13909C>A in individuals 64 and 71. Individuals 11 and 82 are homozygous C/C for -13909, so the -13909C>A variant only explains the equal allelic expression in individuals 64 and 71.
b. -13910C>T and -13909C>A are on different haplotypes. DNA from individuals 64 and 71 was cloned and sequenced, showing that the -13909A allele is on the -13910C haplotype.
Discussion
This study describes phenotype/genotype associations for lactase expression in a strikingly heterogeneous and genetically diverse United States pediatric and young adult population using intestinal biopsy samples for lactase enzyme activity, lactase mRNA quantification, allele specific expression and DNA (42). As seen in Table 1 (and Supplemental Table 1), the subjects were of mixed but largely European ancestry, and many individuals had multiple grandparental countries of origin within Europe.
Our data show that in patients over the age of 8 years, there were no age-dependent differences in the prevalence of lactase non-persistence (Supplemental Fig.S1a). Subjects who were homozygous -13910C/C were all non-persistent when classified based on levels of enzyme activity from intestinal biopsies. Nevertheless, all but three of these subjects were asymptomatic milk drinkers, an observation indicating that they likely had acquired colonic lactose-fermenting bacteria (44). Among those with the heterozygous -13910T/C genotype, approximately half were non-persistent and the others were persistent. This is a larger proportion than found in previous studies (13, 15, 42). The majority of subjects who were homozygous -13910T/T were persistent; 3 were non-persistent. These data indicate that in this diverse U.S. population genetic testing alone would mis-classify a large number of screened subjects when using intestinal lactase enzyme levels as a gold standard (5, 6). A similar observation was recently made in a Brazilian population (16).
Median lactase enzyme activity formed a continuum across the three genotypes at -13910, C/C, T/C, and T/T, being lowest in C/C homozygotes, intermediate in T/C heterozygotes, and highest in T/T homozygotes. There was a clear difference in the median lactase activities between the three genotype groups (see Figure 2a), an observation similar to that of a study by another group (41). Genotype -13910C/C showed the least variability, as opposed to T/C and T/T, alluding to the large range of values that were represented in both our enzyme and mRNA data. In contrast, another previously published study observed that there was no difference in phenotype between -13910T/C and -13910T/T as measured by maximal glucose increase after lactose challenge (45).
As shown by our data, among the mixed population of predominantly northern European ethnicity in the U.S., 21% were homozygous -13910C/C and non-persistent by enzyme activity. Similar results have been published for a Hungarian population over the age of 12 years; most subjects who were homozygous -13910C/C (37% of the sample) were lactase non-persistent by hydrogen breath testing. The combined group of -13910T/C and T/T genotypes showed a slightly higher percentage of abnormal hydrogen breath tests in the subjects who had lactase non-persistence related symptoms compared to the control group (46). Their data also reveal that self-reported lactose tolerance was not a reliable indicator of actual lactase enzyme levels.
In our study, all but 3 subjects who were homozygous -13910 TT had lactase enzyme levels above 15 u/g protein. These three discordant individuals could have had unidentified clinical complications that could explain these findings (47). However, histological examination of their intestinal biopsies did not reveal any alterations, and sucrase levels were normal.
By contrast, allelic expression was much more tightly correlated than was enzyme activity with the -13910 genotype in our patient samples. There were some interesting and notable exceptions to this correlation, with four individuals having little or no allelic imbalance. Data from two of these individuals (64 and 71 were particularly striking because they not only showed equal expression and were heterozygous at -13910, but they also shared a long (12 Mb) haplotype that differed from the common haplotype on which the -13910T allele is found. Our results strongly suggest that the long haplotype contains a second persistence allele that arose in a common European ancestor of these two individuals. We observed a long haplotype either because these two individuals are cryptically related or because the second persistence allele, like other lactase persistence alleles, has been under recent positive selection. Guided by these genetic data, we performed targeted sequencing and identified a novel variant (-13909C>A), one base away from the canonical European lactase persistence allele, in these two individuals (Figure 5). This allele was present on the haplotype that carried the non-persistence allele at -13910. In light of the equal expression from the two haplotypes, we conclude that -13909C>A also causes persistent expression of LCT.
Notably, these two individuals are also among the youngest patients in the study (ages 8 and 9 yrs). Typically, allelic imbalance is observed after age 6 (42), so these individuals have an unusual phenotype, but the absence of allelic imbalance in these relatively young patients could imply that the novel second persistence allele at -13909 could delay the age of onset of lactase non-persistence but might not lead to lactase persistence in adulthood. Genotyping in other children and adults carrying this allele, along with allele-specific expression data, would be required to test whether its effect on persistence continues into adulthood. Additional studies of larger numbers of individuals with this allele would also be required to test whether it has been under recent selection and would therefore be an additional example of convergent evolution at the LCT locus.
In conclusion, our data indicate that identification of a -13910C/C genotype is very likely to predict the presence of lactase non-persistence, in keeping with prior published studies. Similarly, a -13910T/T genotype will frequently, but not perfectly predict lactase persistence in this mixed predominantly European-derived population. However, in this same population, a -13910T/C genotype will not predict the phenotype, an observation also noted by Ingram (12). Furthermore, two individuals with -13910T/C had equal expression from both LCT alleles, and demonstrated the likelihood of an additional LCT persistence allele (at -13909) in European populations. In practice, in people with lactose-related symptoms, the measurement of breath hydrogen after ingestion of lactose best establishes the clinical phenotype (5, 6).
Supplementary Material
Acknowledgments
The authors wish to thank their many colleagues who helped recruit subjects for this study, the nurses and technicians in the Clinical and Translational Study Unit and the Gastrointestinal Procedure Unit at Boston Children's Hospital who facilitated the protocols, and the patients who agreed to donate biopsy specimens. We also thank Chao-Yu Guo, PhD for initial data analysis, Alison Clapp for assistance with editing the manuscript, and the technicians at Kaleida Health, Buffalo, New York who performed the disaccharidase assays.
Supported in part by NIH MERIT Award DK R37 32658, NIH Research Grant R01 DK 061382, the Harvard Digestive Disease Center NIH grant P30 DK 34854, and the Harvard Clinical and Translational Science Center Award (Harvard Catalyst) NIH grant UL-1 RR 025758.
Bibliography
- 1.Grand RJ, Watkins JB, Torti FM. Development of the human gastrointestinal tract. A review. Gastroenterology. 1976;70:790–810. [PubMed] [Google Scholar]
- 2.Montgomery RK, Mulberg AE, Grand RJ. Development of the human gastrointestinal tract: twenty years of progress. Gastroenterology. 1999;116:702–31. doi: 10.1016/s0016-5085(99)70193-9. [DOI] [PubMed] [Google Scholar]
- 3.Troelsen JT. Adult-type hypolactasia and regulation of lactase expression. Biochim Biophys Acta. 2005;1723:19–32. doi: 10.1016/j.bbagen.2005.02.003. [DOI] [PubMed] [Google Scholar]
- 4.Van Beers EH, Buller HA, Grand RJ, et al. Intestinal brush border glycohydrolases: structure, function, and development. Crit Rev Biochem Mol Biol. 1995;30:197–262. doi: 10.3109/10409239509085143. [DOI] [PubMed] [Google Scholar]
- 5.Newcomer AD, McGill DB. Disaccharidase activity in the small intestine: prevalence of lactase deficiency in 100 healthy subjects. Gastroenterology. 1967;53:881–9. [PubMed] [Google Scholar]
- 6.Newcomer AD, McGill DB. Distribution of disaccharidase activity in the small bowel of normal and lactase-deficient subjects. Gastroenterology. 1966;51:481–8. [PubMed] [Google Scholar]
- 7.Scrimshaw NS, Murray EB. The acceptability of milk and milk products in populations with a high prevalence of lactose intolerance. Am J Clin Nutr. 1988;48:1079–159. doi: 10.1093/ajcn/48.4.1142. [DOI] [PubMed] [Google Scholar]
- 8.Wang Y, Harvey CB, Hollox EJ, et al. The genetically programmed down-regulation of lactase in children. Gastroenterology. 1998;114:1230–6. doi: 10.1016/s0016-5085(98)70429-9. [DOI] [PubMed] [Google Scholar]
- 9.Simoons FJ. Primary adult lactose intolerance and the milking habit: a problem in biological and cultural interrelations. I. Review of the medical research. Am J Dig Dis. 1969;14:819–36. doi: 10.1007/BF02233204. [DOI] [PubMed] [Google Scholar]
- 10.Bersaglieri T, Sabeti PC, Patterson N, et al. Genetic signatures of strong recent positive selection at the lactase gene. Am J Hum Genet. 2004;74:1111–20. doi: 10.1086/421051. [DOI] [PMC free article] [PubMed] [Google Scholar]
- 11.Tishkoff SA, Reed FA, Ranciaro A, et al. Convergent adaptation of human lactase persistence in Africa and Europe. Nat Genet. 2007;39:31–40. doi: 10.1038/ng1946. [DOI] [PMC free article] [PubMed] [Google Scholar]
- 12.Ingram CE, Mulcare C, Itan Y, et al. Lactose digestion and the evolutionary genetics of lactase persistence. Hum Genet. 2009;124:579–91. doi: 10.1007/s00439-008-0593-6. [DOI] [PubMed] [Google Scholar]
- 13.Enattah NS, Sahi T, Savilahti E, et al. Identification of a variant associated with adult-type hypolactasia. Nat Genet. 2002;30:233–7. doi: 10.1038/ng826. [DOI] [PubMed] [Google Scholar]
- 14.Hollox EJ, Poulter M, Wang Y, et al. Common polymorphism in a highly variable region upstream of the human lactase gene affects DNA-protein interactions. Eur J Hum Genet. 1999;7:791–800. doi: 10.1038/sj.ejhg.5200369. [DOI] [PubMed] [Google Scholar]
- 15.Kuokkanen M, Enattah NS, Oksanen A, et al. Transcriptional regulation of the lactase-phlorizin hydrolase gene by polymorphisms associated with adult-type hypolactasia. Gut. 2003;52:647–52. doi: 10.1136/gut.52.5.647. [DOI] [PMC free article] [PubMed] [Google Scholar]
- 16.Friedrich DC, Santos SE, Ribeiro-dos-Santos AK, et al. Several different lactase persistence associated alleles and high diversity of the lactase gene in the admixed Brazilian population. PloS one. 2012;7:e46520. doi: 10.1371/journal.pone.0046520. [DOI] [PMC free article] [PubMed] [Google Scholar]
- 17.Ranciaro A, Campbell MC, Hirbo JB, et al. Genetic origins of lactase persistence and the spread of pastoralism in Africa. Am J Hum Genet. 2014;94:496–510. doi: 10.1016/j.ajhg.2014.02.009. [DOI] [PMC free article] [PubMed] [Google Scholar]
- 18.Jones BL, Raga TO, Liebert A, et al. Diversity of lactase persistence alleles in Ethiopia: signature of a soft selective sweep. Am J Hum Genet. 2013;93:538–44. doi: 10.1016/j.ajhg.2013.07.008. [DOI] [PMC free article] [PubMed] [Google Scholar]
- 19.Raz M, Sharon Y, Yerushalmi B, et al. Frequency of LCT-13910C/T and LCT-22018G/A single nucleotide polymorphisms associated with adult-type hypolactasia/lactase persistence among Israelis of different ethnic groups. Gene. 2013;519:67–70. doi: 10.1016/j.gene.2013.01.049. [DOI] [PubMed] [Google Scholar]
- 20.Cowles CR, Hirschhorn JN, Altshuler D, et al. Detection of regulatory variation in mouse genes. Nat Genet. 2002;32:432–7. doi: 10.1038/ng992. [DOI] [PubMed] [Google Scholar]
- 21.Tang K, Fu DJ, Julien D, et al. Chip-based genotyping by mass spectrometry. Proc Natl Acad Sci U S A. 1999;96:10016–20. doi: 10.1073/pnas.96.18.10016. [DOI] [PMC free article] [PubMed] [Google Scholar]
- 22.Campbell CD, Kirby A, Nemesh J, et al. A survey of allelic imbalance in F1 mice. Genome Res. 2008;18:555–63. doi: 10.1101/gr.068692.107. [DOI] [PMC free article] [PubMed] [Google Scholar]
- 23.Gabriel SB, Schaffner SF, Nguyen H, et al. The Structure of Haplotype Blocks in the Human Genome. Science. 2002;296:2225–9. doi: 10.1126/science.1069424. [DOI] [PubMed] [Google Scholar]
- 24.Poulter M, Hollox E, Harvey CB, et al. The causal element for the lactase persistence/non-persistence polymorphism is located in a 1 Mb region of linkage disequilibrium in Europeans. Ann Hum Genet. 2003;67:298–311. doi: 10.1046/j.1469-1809.2003.00048.x. [DOI] [PubMed] [Google Scholar]
- 25.Gajdos ZKZ, Butler JL, Henderson KD, et al. Association Studies of Common Variants in 10 Hypogonadotropic Hypogonadism Genes with Age at Menarche. J Clin Endocrinol Metab. 2008;93:4290–8. doi: 10.1210/jc.2008-0981. [DOI] [PMC free article] [PubMed] [Google Scholar]
- 26.Torniainen S, Parker MI, Holmberg V, et al. Screening of variants for lactase persistence/non-persistence in populations from South Africa and Ghana. BMC Genetics. 2009;10:31. doi: 10.1186/1471-2156-10-31. [DOI] [PMC free article] [PubMed] [Google Scholar]
- 27.Stephens M, Smith NJ, Donnelly P. A New Statistical Method for Haplotype Reconstruction from Population Data. Am J Human Genet. 2001;68:978–89. doi: 10.1086/319501. [DOI] [PMC free article] [PubMed] [Google Scholar]
- 28.Stephens M, Donnelly P. A Comparison of Bayesian Methods for Haplotype Reconstruction from Population Genotype Data. Am J Human Genet. 2003;73:1162–9. doi: 10.1086/379378. [DOI] [PMC free article] [PubMed] [Google Scholar]
- 29.Consortium TIH. A second generation human haplotype map of over 3.1 million SNPs. Nature. 2007;449:851–61. doi: 10.1038/nature06258. [DOI] [PMC free article] [PubMed] [Google Scholar]
- 30.Egyud MRL, Gajdos ZKZ, Butler JL, et al. Use of weighted reference panels based on empirical estimates of ancestry for capturing untyped variation. Hum Genet. 2009;125:295–303. doi: 10.1007/s00439-009-0627-8. [DOI] [PMC free article] [PubMed] [Google Scholar]
- 31.Pritchard JK, Stephens M, Donnelly P. Inference of Population Structure Using Multilocus Genotype Data. Genetics. 2000;155:945–59. doi: 10.1093/genetics/155.2.945. [DOI] [PMC free article] [PubMed] [Google Scholar]
- 32.Heitlinger LA, Rossi TM, Lee PC, et al. Human intestinal disaccharidase activities: correlations with age, biopsy technique, and degree of villus atrophy. J Pediatr Gastroenterol Nutr. 1991;12:204–8. [PubMed] [Google Scholar]
- 33.Dahlqvist A. Method for assay of intestinal disaccharidases. Anal Biochem. 1964;7:18–25. doi: 10.1016/0003-2697(64)90115-0. [DOI] [PubMed] [Google Scholar]
- 34.Escher JC, de Koning ND, van Engen CG, et al. Molecular basis of lactase levels in adult humans. J Clin Invest. 1992;89:480–3. doi: 10.1172/JCI115609. [DOI] [PMC free article] [PubMed] [Google Scholar]
- 35.Bosse T, van Wering HM, Gielen M, et al. Hepatocyte nuclear factor-1 {alpha} is required for expression but dispensable for histone acetylation of the lactase-phlorizin hydrolase gene in vivo. Am J Physiol Gastrointest Liver Physiol. 2006;290:G1016–24. doi: 10.1152/ajpgi.00359.2005. [DOI] [PubMed] [Google Scholar]
- 36.Bosse T, Fialkovich JJ, Piaseckyj CM, et al. Gata4 and Hnf1{alpha} are partially required for the expression of specific intestinal genes during development. Am J Physiol Gastrointest Liver Physiol. 2007;292:G1302–14. doi: 10.1152/ajpgi.00418.2006. [DOI] [PubMed] [Google Scholar]
- 37.Bauer P. Multiple testing in clinical trials. Stat Med. 1991;10:871–90. doi: 10.1002/sim.4780100609. [DOI] [PubMed] [Google Scholar]
- 38.Marcus R, Eric P, Gabriel KR. On closed testing procedures with special reference to ordered analysis of variance. Biometrika. 1976;63:655–60. [Google Scholar]
- 39.Fajardo O, Naim HY, Lacey SW. The polymorphic expression of lactase in adults is regulated at the messenger RNA level. Gastroenterology. 1994;106:1233–41. doi: 10.1016/0016-5085(94)90014-0. [DOI] [PubMed] [Google Scholar]
- 40.Lloyd M, Mevissen G, Fischer M, et al. Regulation of intestinal lactase in adult hypolactasia. J Clin Invest. 1992;89:524–9. doi: 10.1172/JCI115616. [DOI] [PMC free article] [PubMed] [Google Scholar]
- 41.Rasinpera H, Savilahti E, Enattah NS, et al. A genetic test which can be used to diagnose adult-type hypolactasia in children. Gut. 2004;53:1571–6. doi: 10.1136/gut.2004.040048. [DOI] [PMC free article] [PubMed] [Google Scholar]
- 42.Rasinpera H, Kuokkanen M, Kolho KL, et al. Transcriptional downregulation of the lactase (LCT) gene during childhood. Gut. 2005;54:1660–1. doi: 10.1136/gut.2005.077404. [DOI] [PMC free article] [PubMed] [Google Scholar]
- 43.Jarvela I, Sabri Enattah N, Kokkonen J, et al. Assignment of the locus for congenital lactase deficiency to 2q21, in the vicinity of but separate from the lactase-phlorizin hydrolase gene. Am J Hum Genet. 1998;63:1078–85. doi: 10.1086/302064. [DOI] [PMC free article] [PubMed] [Google Scholar]
- 44.de Vrese M, Stegelmann A, Richter B, et al. Probiotics--compensation for lactase insufficiency. Am J Clin Nutr. 2001;73:421S–9. doi: 10.1093/ajcn/73.2.421s. [DOI] [PubMed] [Google Scholar]
- 45.Ridefelt P, Hakansson LD. Lactose intolerance: Lactose tolerance test versus genotyping. Scand J Gastroenterol. 2005;40:822–6. doi: 10.1080/00365520510015764. [DOI] [PubMed] [Google Scholar]
- 46.Nagy D, Bogacsi-Szabo E, Varkonyi A, et al. Prevalence of adult-type hypolactasia as diagnosed with genetic and lactose hydrogen breath tests in Hungarians. Eur J Clin Nutr. 2009;63:909–12. doi: 10.1038/ejcn.2008.74. [DOI] [PubMed] [Google Scholar]
- 47.Kerber M, Oberkanins C, Kriegshäuser G, et al. Hydrogen breath testing versus LCT genotyping for the diagnosis of lactose intolerance: A matter of age? Clin Chim Acta. 2007;383:91–6. doi: 10.1016/j.cca.2007.04.028. [DOI] [PubMed] [Google Scholar]
Associated Data
This section collects any data citations, data availability statements, or supplementary materials included in this article.


