Abstract
Biomembrane interfaces create regions of slowed water dynamics in their vicinity. When two lipid bilayers come together, this effect is further accentuated, and the associated slowdown can affect the dynamics of larger-scale processes such as membrane fusion. We have used molecular dynamics simulations to examine how lipid and water dynamics are affected as two lipid bilayers approach each other. These two interacting fluid systems, lipid and water, both slow and become coupled when the lipid membranes are separated by a thin water layer. We show in particular that the water dynamics become glassy, and diffusion of lipids in the apposed leaflets becomes coupled across the water layer, while the “outer” leaflets remain unaffected. This dynamic coupling between bilayers appears mediated by lipid–water–lipid hydrogen bonding, as it occurs at bilayer separations where water–lipid hydrogen bonds become more common than water–water hydrogen bonds. We further show that such coupling occurs in simulations of vesicle–vesicle fusion prior to the fusion event itself. Such altered dynamics at membrane–membrane interfaces may both stabilize the interfacial contact and slow fusion stalk formation within the interface region.
Introduction
Lipid membranes provide a key organizing principle for life: they allow compartmentalization into cells and organelles, and two-dimensional organization of enzymatic and signaling components, and exert marked surface effects on biological fluids in their proximity. But what happens when two lipid membranes approach one another closely? Multilayer stacks have been extensively studied as a homogeneous model system for physical investigation of membrane properties. However, a single pair of bilayers coming close to one another, as can occur prior to membrane fusion or in tight junction formation, represents a subtly different physical scenario: the proximal leaflets are separated by a thin layer of water, but the distal leaflets remain well-hydrated.
This inhomogeneous prefusion system is difficult to study directly, but a large body of work, both simulation and experimental, has addressed the more general problem of altered lipid and water dynamics at interacting surfaces. Although biological membranes contain a complex mixture of different components, the fluid–fluid interfaces and fundamental confinement behaviors that concern us here can be reproduced by much simpler lipid bilayer systems. Interfacial effects in well-hydrated bilayers have been probed by a number of methods,1−5 while the slowing of lipid and water diffusion as multilayer stacks are progressively dehydrated has been characterized extensively by spectroscopic and scattering-based experimental measures6−11 as well as molecular dynamics simulations12−14 or combined methods.15−17
We have previously performed simulations of liposomal membrane fusion where we predict that the interacting membranes may stably approach each other prior to fusion.18 This prediction is consistent with analysis of PEG-induced fusion experiments by Lentz and co-workers.19 Furthermore, electron microscopy and fluorescence resonance energy transfer experiments have shown that docked vesicles can form extended and stable areas of tight contact, although the nanoscale architecture of these contact areas has yet to be established.20,21 Our simulations suggest that the dynamics of water and lipids at such membrane interfaces can have a marked effect on overall fusion dynamics. In addition, we have developed measures based on theories of glasses that allow us to quantify anomalous diffusion in simulations of fluids near interfaces in a straightforward manner: these methods helped demonstrate a general effect of dynamic heterogeneity that slows fluid diffusion near surfaces.22 An alternate approach was also developed by Netz and co-workers.23 Here, we apply these methods to the close approach of two lipid bilayers, showing that this confined “double interface” between two bilayers leads to an even more pronounced effect on dynamics. We primarily concern ourselves with this striking effect on dynamics rather than equilibrium static structures. Most surprisingly, we predict that the diffusion of lipids in the two proximal leaflets becomes coupled across the water gap between them, while the distal leaflets remain largely unperturbed. This coupled diffusion leads to a dramatic slowing down of dynamics between the inner leaflets as the lipid bilayers approach: water diffusion slows down by more than 1000-fold, while the inner lipid diffusion constant goes down by a factor of 10.
One subtle yet important detail of the inhomogeneous systems that we examine here is that they represent metastable yet nonequilibrium intermediates in the fusion process. The marked slowing and even glassy dynamics of water in this system further slows relaxation of the system, meaning that such nonequilibrium intermediates can persist at much longer time scales than would otherwise be anticipated.
Recent work has suggested that the transition state for membrane fusion stalk formation involves exposure24 and even contact25−27 of lipid acyl tails. In at least some model systems for fusion, another step precedes stalk formation: the close apposition of two interacting lipid bilayers and the dehydration of the contact area between them.18,24 The high free energy barrier associated with dehydration has long been recognized and approached theoretically.28 Together, the coupled and slowed lipid motion may help explain how lipid membranes can form a relatively long-lived metastable apposed intermediate prior to fusion stalk formation: fusion stalk nucleation and expansion each depend on the diffusional motion of lipid tails. With current computational resources, we can make a quantitative assessment of the altered dynamics of apposed bilayers that contribute to fusion.
Results
The dynamics of partially hydrated lipid bilayers are particularly interesting from a physical point of view because the system comprises two mobile and interacting components, the lipids and the water between them. We use both conventional mean squared-displacement measurements and event-based measures from from the physics of glassy systems to help quantitate motion within this heterogeneous coupled environment. Using such measures we find, as expected, a slowing of lipid and water diffusion as the two bilayers approach one another. Strikingly and unexpectedly, the motion of lipids in the apposed inner leaflets becomes coupled across the intervening water layer. This occurs at a level of hydration where the static structure of the bilayer is preserved.
Diffusion of Water and Lipids
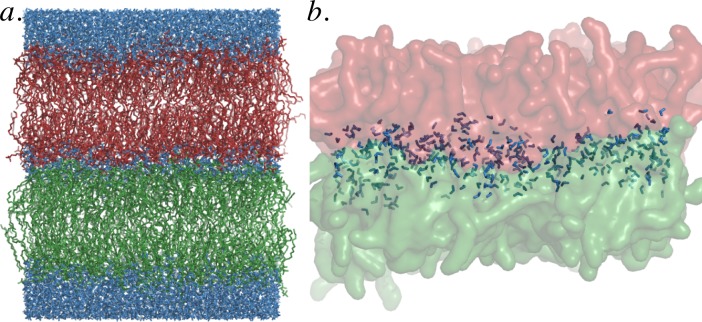
In order to examine the dynamics within and between two bilayers as they approach one another, we performed a series of atomic resolution molecular dynamics simulations of two lipid bilayers with a varying amount of water between them, as shown in Figure 1.
Figure 1.
Shown in panel a is the simulation geometry: two bilayers (red and green) with a varying amount of water between them (blue). In panel b the pair of opposed inner leaflets are rendered at a ratio of 3 waters per lipid. At this ratio, extensive headgroup–headgroup contact is present.
The simulated system consists of two bilayers with 256 or 128 palmitoyl-oleyl-phosphocholine (POPC) molecules per bilayer, making the number of lipid molecules in the inner two leaflets Nl = 128 or 256.
The amount of water between the two bilayers was varied from Nw = 16 to 0 waters per inner leaflet lipid, resulting in the headgroup–headgroup spacing shown in Figure 2. Additionally, 32 waters per outer leaflet lipid were maintained at the “outside” of the two bilayers to maintain a region of bulk water between the periodic images of the system and thus model a pair of bilayers rather than a multilayer. This amount of water was sufficient to maintain bulk water dynamics in the “outer” compartment and similarly to maintain bulk lipid dynamics in the outer leaflets of the bilayers. Bulk dynamics were assessed by comparison to the dynamics of a single lipid bilayer with 64 waters per lipid and to the results reported in prior simulation29 and experimental30 work.
Figure 2.
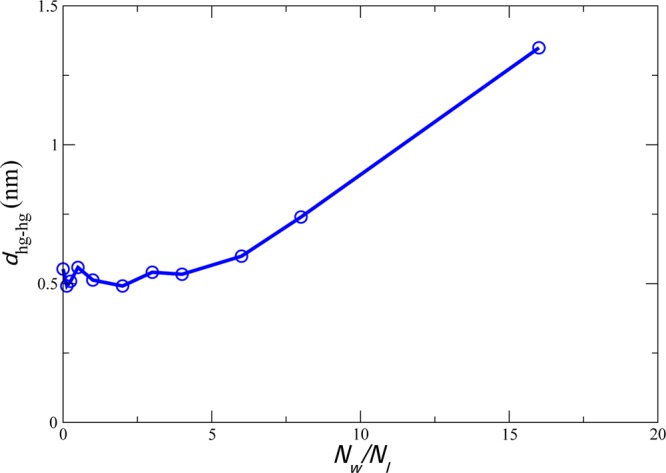
Headgroup center of mass distance between the inner leaflets in z-coordinates, as a function of number of waters per lipid between the inner leaflets. The distance plotted is the z-distance between the centers of mass for all headgroup atoms of each inner leaflet.
This system is not in strict thermodynamic equilibrium with regard to water, as water molecules will be more likely to cross from the “outer” to the “inner” compartment than the reverse. However, such crossings occur on very slow time scales: total water crossings (in either direction) were observed at a rate of roughly 0.07 ± 0.02 per water per microsecond. The distribution of water between compartments is thus metastable on the time scales considered here. Water molecules that crossed the bilayer were excluded from the diffusional analysis. Additional simulation details are provided in the Methods section.
Average diffusion constants were calculated in each simulation as a function of the ratio of water molecules in the inner compartment to lipid molecules in the inner bilayers of that simulation and are plotted in Figure 3. As the number of water molecules decreases, the diffusional dynamics of the outer leaflets remain constant. The inner leaflet diffusion slows substantially, and the diffusion of the water between the bilayers slows to approximately that of the outer leaflet lipids. Similar effects have been reported before, both in simulations14,31 and in experiments on lipid multilayers.9
Figure 3.
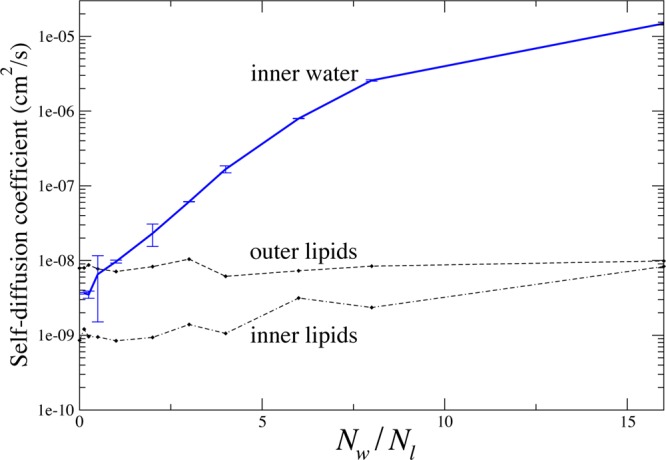
Lateral diffusion coefficients as as a function of bilayer separation. Diffusion coefficients were calculated from a linear fit to the mean squared displacement as a function of time. A two-dimensional model was used for fitting displacements; this is appropriate for lipid diffusion and water diffusion at low hydration. At full hydration, the water diffusion will be more appropriately fit by a 3D model, but the model error is bounded at 50% (⟨r2⟩ = 6Dt versus 4Dt), while the observed diffusional slowing effect is several orders of magnitude.
Diffusional Coupling between Leaflets
The slowing of lateral diffusion in both inner leaflets raises the question of whether individual lipid motion might be correlated in the two inner leaflets, as in a coupled system. To measure the extent to which this diffusion is coupled, we utilize event-based measures of diffusion: an exchange event is the time it takes for a particle to diffuse a characteristic distance d, such as the typical nearest neighbor distance.
The exchange time tx is the time between consecutive exchange events: its average is analogous to the time interval between steps in a random walk taken and is therefore inversely related to the diffusion constant D = c/⟨tx⟩, where D is the bulk diffusion constant, and c is a constant factor that depends on the exchange event distance d and the physical details of the system being studied.22,32,33
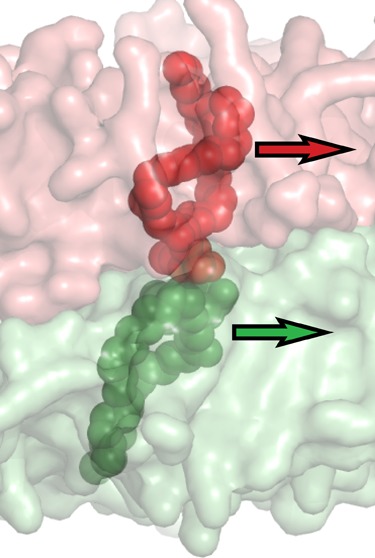
To assess diffusional coupling, we calculate the ratio Dref/D, where D is an standard diffusion constant and Dref is a diffusion constant calculated using a reference frame derived from lipids in the opposite leaflet. This reference frame is defined by the center of mass of the closest four lipids in the opposite leaflet, so the coupled diffusion constant reflects average motion lipid relative to nearby lipids in the opposite leaflet. As above, we calculate the exchange time txref and use it to define the coupled diffusion constant Dref = c/⟨tx⟩. Here, we have set the exchange event distance d = 0.28 nm, the first peak in the water–water radial distribution function.
For an uncoupled system, both the diffusing particle and the reference point for coupling diffuse independently, and therefore, the ratio Dref/D = 2, twice as fast as the single particle diffusion of D (as in a random walk with two steps per time step). If diffusion is strongly coupled, the ratio will be smaller: diffusion away from particles in the opposite leaflets is slower than overall diffusion, making the value of the ratio Dref/D < 1.
The inner leaflets of the double-bilayer system display this coupled behavior as they approach one another. As shown in Figure 4, both leaflets display uncoupled diffusion at 16 water molecules per lipid. (Dref/D ≈ 2). At closer approach, the coupling ratio progressively decreases, reaching the fully coupled regime at approximately Nw < 6.
Figure 4.

Diffusional coupling between the inner bilayer leaflets. Coupling is estimated as the ratio between an uncoupled estimate for the diffusion D and diffusion relative to the opposing leaflet Dref: diffusion relative to a reference frame defined by the center of mass of the closest 4 lipids on the opposing leaflet. The inset schematizes this by showing two neighboring lipids in apposed inner leaflets. The normal diffusion D for the top lipid is calculated purely on the basis of its motion relative to the leaflet center-of-mass, while the Dref is measured relative to the center of mass of the bottom lipid (and three other neighbors). When these motions are strongly correlated, the estimated coupled diffusion constant will be slower than the uncoupled diffusion constant.
Hydrogen Bonding
This diffusional coupling between lipid molecules on opposite sides of the water gap suggests a physical interaction between phospholipid headgroups, either direct or mediated by water. Phospholipid bilayer–water interfaces feature strong hydrogen bond interactions between water and the lipid headgroups,34,35 in addition to extremely favorable water–water hydrogen bonds. We therefore measured the frequency of water–water hydrogen bonds in the inner water region versus water–headgroup hydrogen bonds. Pure POPC bilayers are incapable of forming direct headgroup–headgroup hydrogen bonds, since POPC contains no appropriate donors. These data are plotted in Figure 5 and show a crossover at approximately 6 waters/lipid: below this level of hydration, water molecules are on average more likely to be hydrogen-bound to lipids than to other waters. This crossover coincides with the onset of coupling between opposite inner-leaflet lipids, suggesting that the lipid–water–lipid hydrogen bonding network may in part be responsible for the observed diffusional coupling.
Figure 5.
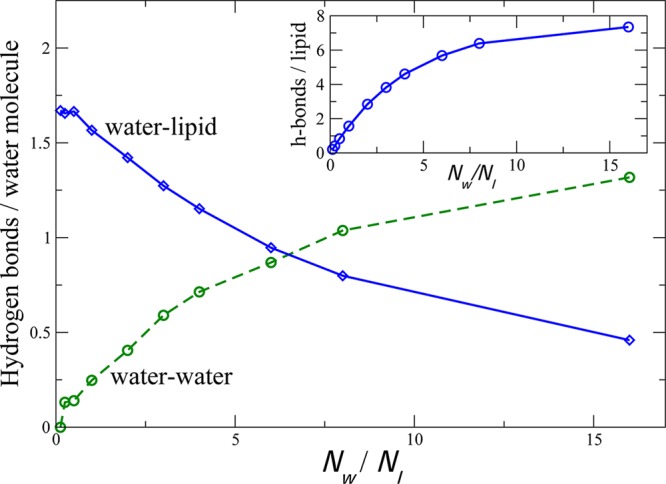
Hydrogen bonding partners for confined water. The average number of water–lipid and water–water hydrogen bonds is plotted per water molecule in the inner compartment between bilayers as a function of water-to-lipid ratio. The inset shows the number of water-to-lipid hydrogen-bonds per inner-leaflet lipid.
To examine how this behavior may affect membrane fusion dynamics, we calculated diffusional coupling between lipids in the apposed surface patch between two vesicles prior to fusion. Calculations were performed on the vesicle fusion system we have previously reported,18 using lipids starting in a 3.14 nm2 central contact region. Over a 10 ns interval prior to stalk formation, the ratio Dcoupled/Duncoupled was 0.83, indicative of substantial diffusional coupling across the water layer between vesicles.
Static Structure is Grossly Maintained
These marked changes in lipid and water diffusion between apposed bilayers appear to be primarily a dynamic effect, driven in part by the change in hydrogen bonding patterns, which we would classify as subtle rather than gross structural changes. To rule out gross structural changes, we calculated water radial distribution functions (Figure 6a) and lipid tail order parameters (Figure 6b). These indicate that fluid water structure and lamellar bilayer structure are both mostly preserved at 4 waters/lipid, a level of hydration at which coupled diffusion has clearly emerged. Lamellar structure and fluid water structure break down at approximately 1 water/lipid, a much lower level of hydration. Our simulations show a trend toward lower lipid tail order in the inner leaflets at lower levels of hydration; prior studies on equilibrated multilayer stacks have shown an increase in tail order.36 This difference is likely due to differences in area per lipid headgroup, since acyl tail order parameters shift in rougly proportional response to lipid lateral area.37−39
Figure 6.
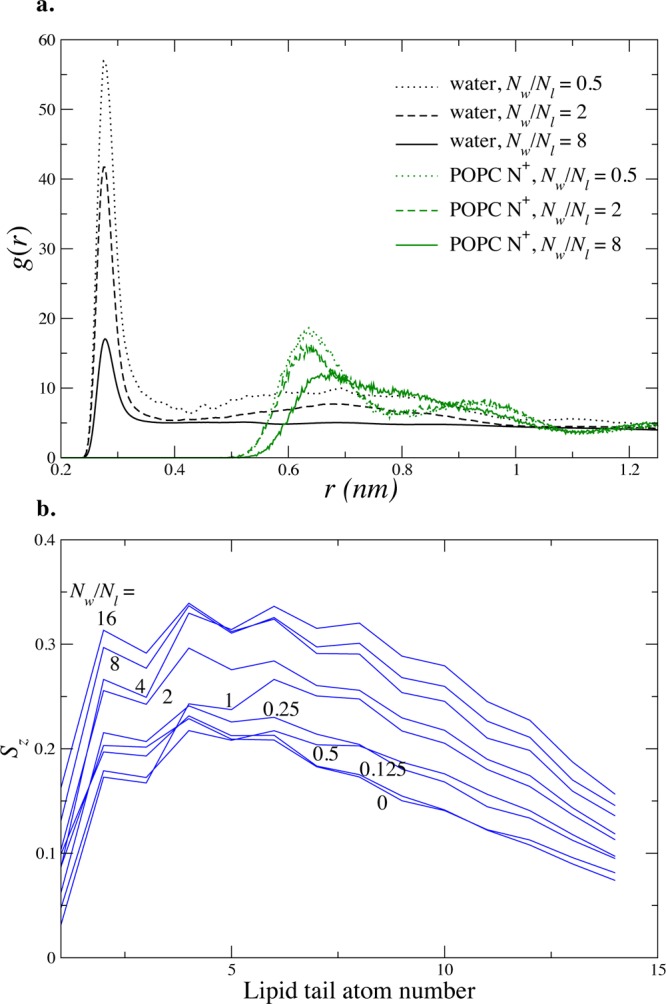
Statics of bilayers in close proximity. (a) The 3D radial distribution function (rdf) of water confined between two bilayers shows the appearance of structure dictated by the presence of the lipid bilayer headgroups, at very close approach (approximately Nw/Nl < 4). The rdfs of the POPC headgroup N atom are shown in green. (b) Lipid tail Sz order parameter calculated for the POPC sn1 chain at varying hydration levels shows decreased ordering for closer approach.
Double Interface Accentuates Diffusional Dynamic Heterogeneity
As average water diffusion slows from bulk values, it also becomes markedly heterogeneous in space and time;22 the spatial heterogeneity of the system leads to temporal heterogeneity in diffusion, leading to observations of dynamics analogous to those in glassy systems: the decoupling of diffusion from viscosity and anomalous diffusion. To test for these changes in a quantitative manner, we use the exchange time tx, the time between consecutive exchange events, and compare this to the persistence time tp, the time it takes to undergo an exchange event starting from any configuration at any time (i.e., not starting at a previous exchange event).
Observing a single water molecule over time starting from some initial configuration, the time until the first exchange event is a persistence time (because the starting time is essentially a random point between exchanges), and then the subsequent intervals between events are exchange times.
Under normal fluid conditions, the average persistence and exchange times should be the same: exchange events should be uniformly and randomly distributed over time.32,40 In dynamically heterogeneous systems, however, there will be times when there are rapid successions of exchange events followed by long waits; this will lead to the ratio ⟨tp⟩/⟨tx⟩ to be significantly different from 1.
Figure 7 shows the ratio ⟨tp⟩/⟨tx⟩ for water between the bilayers as a function of bilayer separation. As the spacing between the bilayers decreases, the ratio increases substantially. This difference becomes even more pronounced when the exchange event displacements are calculated relative to the closest set of lipid headgroups, in effect correcting for the lipid diffusion.
Figure 7.
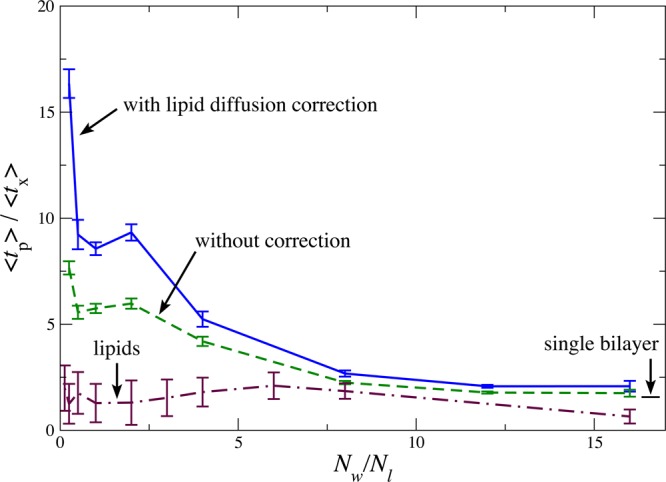
Ratio of average persistence time ⟨tp⟩ and exchange time ⟨tx⟩ as a function of bilayer separation. Dynamic heterogeneity is readily evident in this system. In the regime where slowed diffusion is observed, this heterogeneity and the associated nonuniformity of diffusion is of even greater magnitude when water diffusion is measured relative to the nearest lipids, suggesting a coupling between the water and lipid diffusion. For reference, the ratio ⟨tp⟩/⟨tx⟩ is also plotted for water close to a single lipid bilayer. While some dynamic heterogeneity is present in this single-interface regime, it is markedly lower.
This altered ratio ⟨tp⟩/⟨tx⟩ reflects an altered ratio between diffusion and viscosity, leading to a breakdown of the Stokes–Einstein relation that governs normal bulk diffusion and viscosity.32 Part of this process can be ascribed to the self-lubrication of water motion: the presence of water facilitates the breakup and reconfiguration of hydrogen bonds of other water molecules.34,35 However, there is already significant diffusion–viscosity decoupling at bilayer separations larger than the close approach where water–water contacts become rare. We have previously shown how this is a general feature of fluids at interfaces that is strengthened by favorable molecular interactions such as those between water molecules and lipid headgroups.22 Here, the double interface and strong hydrogen bonding interactions further accentuate this phenomenon.
Partially hydrated multilamellar stacks have been observed to undergo area condensation in a manner that depends on both acyl chain length and unsaturation.41,42 The inhomogeneous system considered here, two bilayers approaching each other, is thus composed of inner and outer leaflets at levels of hydration where the corresponding homogeneous multilayer stacks would have different lateral lipid densities. To control for bilayer stresses that might be introduced as a result of such asymmetry, we performed an additional set of simulations where the inner leaflets were initialized to a lipid lateral density 10 anticipated lipid density differences in fully hydrated bilayers versus partially hydrated multilayer stacks, using data for DOPC multilayers as a reference.41,42 These bilayers of asymmetric lipid density displayed a similar slowing of inner-leaflet lipid and water diffusion to symmetric lipid bilayers (Supporting Information Figure S1). They also displayed diffusion-velocity decoupling and coupled diffusion (Supporting Information Figure S2). Structural parameters for the asymmetric bilayers are plotted in Supporting Information Figure S3. A comparison of lateral tension profiles between symmetric and asymmetric bilayers is given in Supporting Information Figure S4, and the chemical potential difference of removing randomly selected water molecules from either the fully hydrated region or the partially dehydrated region, as calculated via free-energy perturbation simulations for both symmetric and asymmetric bilayers, is plotted in Supporting Information Figure S5.
Conclusions
Our study of water dynamics at bilayer interfaces has been motivated by the close approach prior to membrane fusion of two phospholipid bilayers with a thin water layer between. In initial simulations of membrane fusion, we noted that this water layer had unusual dynamics and that perturbing the fine structure of that water layer altered fusion dynamics in our simulations. We have developed concepts from the theory of glasses to measure these dynamics in greater detail; we found that altered fluid dynamics are a fundamental property of surface interfaces and that interactions between the surface and fluid (such as lipid–water hydrogen bonds) serve to strengthen this effect.
Here, we bring these tools back to the study of water layers between two phospholipid membranes. We find that the double interface thus produced further accentuates nonuniform diffusion in these thin water layers, resulting in glassy water dynamics in our simulations. Both water and lipid dynamics slow as the bilayers approach each other, but the slow-down is only glassy for the water, not for the lipids. This is likely due to the self-lubricating properties of water: a water molecule is more likely to undergo diffusional motion when the molecule has other water molecules as immediate neighbors: this creates a self-reinforcing effect on water dynamics.
We also find that water acts to couple the dynamics of lipids in opposing bilayers, such that lipids in the inner leaflets of these membranes on average codiffuse with their partners across the water gap. These properties begin at a ratio of approximately 5 water molecules per inner-leaflet lipid in POPC bilayers. Strikingly, we observe similar coupled diffusion in simulations of vesicle pairs prior to fusion.
We therefore believe that water-mediated coupling acts to slow lipid dynamics in lipid vesicles prior to membrane fusion (such as the PEG-mediated liposomal fusion measured by Lentz and co-workers where liposomes partially dehydrate prior to fusion24) and that this prolongs the aggregated and partially dehydrated but prefusion step. Such diffusional slowing mediated by coupling between inner-leaflet membranes may also be important in maintaining restricted diffusion in epithelial tight junctions, where free diffusion of membrane probes is correlated to the ability to exchange between proximal (coupled) and distal (uncoupled) leaflets.43 The extent to which diffusional slowing affects the rates of different physiological fusion reactions such as viral membrane fusion and synaptic membrane fusion remains to be determined. We speculate that some of the regulatory machinery for fast membrane fusion such as occurs at presynaptic termini may act to help avoid kinetic “traps” such as the slowed and coupled movement of lipids we observe here.
Methods
Simulations were performed with two POPC lipid bilayers of 128 or 256 molecules each separated by a variable number of waters: 0 to 16 waters/inner leaflet lipid in the inner water layer and 32 water/outer leaflet lipid in the outer water layer. The Berger force field parameters were used for the POPC molecules, and the TIP3P model was used for water. Simulation details are similar to those of ref (25) and are summarized briefly as follows. Lipids were modeled using the Berger force field,37 and the water model is TIP3P. A temperature of 303 K was maintained using the velocity-rescaling thermostat,44 and the pressure 1 bar, well clear of any 2D phase transition.45 The pressure was coupled semi-isotropically, allowing the box size to fluctuate46 by the same amount along the x and y axes or independently along the z axis.
Each system was equilibrated for 10 ns, after which point the equilibrium values of box size and pressure were well converged. Production runs were then performed for 400 ns each using a 4 fs time step. All bond lengths were constrained with LINCS. Short-range cutoffs of 1.2 nm were used, with long-range electrostatics treated via Particle Mesh Ewald.47 A 5 ps pressure-coupling constant was employed in conjunction with a 0.1 ps temperature-coupling constant.
Bilayers of asymmetric density were prepared by randomly deleting 10 outer leaflets of each bilayer at each hydration level. Each system was equilibrated as above and then subjected to a further 100 ns of equilibration prior to production runs of 350 ns each. Differential pressure and surface tension were assessed in these simulations using the Gromacs 4.5 local pressure code48 in a manner similar to that described in the reference publication. Local pressures were calculated on frames at 4 ns intervals and saved onto a grid at 0.15 nm resolution.
The free energy of removal of an internal or external water molecule from the system was calculated by running several systems where gradually an 8.85 kJ mol–1 nm–1 umbrella potential was applied to the water molecule relative to a set of water molecules in a cylinder of radius 2.8 nm centered around the water molecule to be removed.49 After the umbrella potential was removed, the charge–charge interactions between the water and the rest of the system were gradually removed, after which the van der Waals interactions were removed while applying a soft-core potential.50 All of the intermediate states were kept constant and simulated as equilibrium states with 3 ns equilibration time and 1 ns sampling time using stochastic dynamics with a 4 ps time step. The free energy was integrated using the Bennett acceptance ratio method.51
Simulations of vesicle–vesicle fusion used identical conditions (and indeed identical trajectories) to those previously reported,18 with the exception that coordinates were analyzed at a 40 ps interval to measure lipid diffusional coupling. Briefly, a pair of 15 nm vesicles was simulated connected by an amide cross-linker.25 Each vesicle was composed of 877 POPC or POPE phospholipids using the Berger simulation parameters and solvated in explicit TIP3P water. The vesicles were initially placed at 1 nm separation with no applied force. Measurements reported in this Article were performed on the vesicles after stable contact structures had formed but before fusion stalk formation.
Simulations were performed using Gromacs 4.552 on one to four cluster nodes with 24 AMD Opteron 8425HE cores per node and a QDR Infiniband interconnect, with speeds of approximately 77 ns/day for the 512-POPC systems on 4 nodes. Additional simulations were performed on 32 cluster nodes with 16 Intel E5-2670 codes per node and a Cray Aires interconnect.
Acknowledgments
This work was supported by a STINT instutional collaboration grant IG2011-2072, an ERC award 209825 to E.L., NIGMS award GM098304 to P.M.K., and the Swedish Vetenskapsrådet and Foundation for Strategic Research. Computational resources were provided by the Swedish National Infrastructure for Computing and by the Oak Ridge Leadership Computing Facility at ORNL, which is supported by U.S. DOE under contract DE-AC05-00OR22725.
Supporting Information Available
Five additional figures. This material is available free of charge via the Internet at http://pubs.acs.org.
The authors declare no competing financial interest.
Funding Statement
National Institutes of Health, United States
Supplementary Material
References
- Åman K.; Lindahl E.; Edholm O.; Håkansson P.; Westlund P.-O. Biophys. J. 2003, 84, 102–115. [DOI] [PMC free article] [PubMed] [Google Scholar]
- Lopez C. F.; Nielsen S. O.; Klein M. L.; Moore P. B. J. Phys. Chem. B 2004, 108, 6603–6610. [Google Scholar]
- Bhide S. Y.; Berkowitz M. L. J. Chem. Phys. 2005, 123, 224702. [DOI] [PubMed] [Google Scholar]
- Kausik R.; Han S. J. Am. Chem. Soc. 2009, 131, 18254–18256. [DOI] [PubMed] [Google Scholar]
- Hodges M. W.; Cafiso D. S.; Polnaszek C. F.; Lester C. C.; Bryant R. G. Biophys. J. 1997, 73, 2575–2579. [DOI] [PMC free article] [PubMed] [Google Scholar]
- Cheng J.-X.; Pautot S.; Weitz D. A.; Xie X. S. Proc. Natl. Acad. Sci. U.S.A. 2003, 100, 9826–9830. [DOI] [PMC free article] [PubMed] [Google Scholar]
- König S.; Sackmann E.; Richter D.; Zorn R.; Carlile C.; Bayerl T. J. Chem. Phys. 1994, 100, 3307–3316. [Google Scholar]
- Kuo A.-L.; Wade C. G. Chem. Phys. Lipids 1979, 25, 135–139. [Google Scholar]
- Gaede H.; Gawrisch K. Biophys. J. 2003, 85, 1734–1740. [DOI] [PMC free article] [PubMed] [Google Scholar]
- Zhou Z.; Sayer B. G.; Hughes D. W.; Stark R. E.; Epand R. M. Biophys. J. 1999, 76, 387–399. [DOI] [PMC free article] [PubMed] [Google Scholar]
- Volke F.; Eisenblätter S.; Galle J.; Klose G. Chem. Phys. Lipids 1994, 70, 121–131. [DOI] [PubMed] [Google Scholar]
- Högberg C.-J.; Lyubartsev A. P. J. Phys. Chem. B 2006, 110, 14326–14336. [DOI] [PubMed] [Google Scholar]
- Zhang Z.; Berkowitz M. L. J. Phys. Chem. B 2009, 113, 7676–7680. [DOI] [PubMed] [Google Scholar]
- Gentilcore A.; Michaud-Agrawal N.; Crozier P.; Stevens M.; Woolf T. J. Membr. Biol. 2010, 235, 1–15. [DOI] [PubMed] [Google Scholar]
- Skinner J. L.; Pieniazek P. a.; Gruenbaum S. M. Acc. Chem. Res. 2012, 45, 93–100. [DOI] [PMC free article] [PubMed] [Google Scholar]
- Gruenbaum S. M.; Pieniazek P. a.; Skinner J. L. J. Chem. Phys. 2011, 135, 164506. [DOI] [PMC free article] [PubMed] [Google Scholar]
- Gruenbaum S. M.; Skinner J. L. J. Chem. Phys. 2011, 135, 075101. [DOI] [PMC free article] [PubMed] [Google Scholar]
- Kasson P. M.; Lindahl E.; Pande V. S. J. Am. Chem. Soc. 2011, 133, 3812–3815. [DOI] [PubMed] [Google Scholar]
- Lee J.; Lentz B. R. Biochemistry 1997, 36, 6251–6259. [DOI] [PubMed] [Google Scholar]
- Bendix P. M.; Pedersen M. S.; Stamou D. Proc. Natl. Acad. Sci. U.S.A. 2009, 106, 12341–12346. [DOI] [PMC free article] [PubMed] [Google Scholar]
- Hernandez J. M.; Stein A.; Behrmann E.; Riedel D.; Cypionka A.; Farsi Z.; Walla P. J.; Raunser S.; Jahn R. Science 2012, 336, 1581–1584. [DOI] [PMC free article] [PubMed] [Google Scholar]
- Pronk S.; Lindahl E.; Kasson P. M. Nat. Commun. 2014, 5. [DOI] [PMC free article] [PubMed] [Google Scholar]
- von Hansen Y.; Gekle S.; Netz R. R. Phys. Rev. Lett. 2013, 111, 118103. [DOI] [PubMed] [Google Scholar]
- Chakraborty H.; Tarafdar P. K.; Bruno M. J.; Sengupta T.; Lentz B. R. Biophys. J. 2012, 102, 2751–2760. [DOI] [PMC free article] [PubMed] [Google Scholar]
- Kasson P.; Lindahl E.; Pande V. PLoS Comput. Biol. 2010, 6, e1000829. [DOI] [PMC free article] [PubMed] [Google Scholar]
- Stevens M. J.; Hoh J. H.; Woolf T. B. Phys. Rev. Lett. 2003, 91, 188102. [DOI] [PubMed] [Google Scholar]
- Smirnova Y. G.; Marrink S.-J.; Lipowsky R.; Knecht V. J. Am. Chem. Soc. 2010, 132, 6710–6718. [DOI] [PubMed] [Google Scholar]
- Leikin S. L.; Kozlov M. M.; Chernomordik L. V.; Markin V. S.; Chizmadzhev Y. a. J. Theor. Biol. 1987, 129, 411–25. [DOI] [PubMed] [Google Scholar]
- Lindahl E.; Edholm O. J. Chem. Phys. 2001, 115, 4938–4950. [Google Scholar]
- McIntosh T. Curr. Opin. Struct. Biol. 2000, 10, 481–485. [DOI] [PubMed] [Google Scholar]
- Sega M.; Vallauri R.; Melchionna S. Phys. Rev. E 2005, 72, 041201. [DOI] [PubMed] [Google Scholar]
- Chandler D.; Garrahan J. P. Annu. Rev. Phys. Chem. 2010, 61, 191–217. [DOI] [PubMed] [Google Scholar]
- Hedges L. O.; Maibaum L.; Chandler D.; Garrahan J. P. J. Chem. Phys. 2007, 127, 211101. [DOI] [PubMed] [Google Scholar]
- Ghosh A.; Smits M.; Bredenbeck J.; Bonn M. J. Am. Chem. Soc. 2007, 129, 9608–9609. [DOI] [PubMed] [Google Scholar]
- Volkov V.; Palmer D.; Righini R. Phys. Rev. Lett. 2007, 99, 078302. [DOI] [PubMed] [Google Scholar]
- Dvinskikh S. V.; Castro V.; Sandstrom D. Phys. Chem. Chem. Phys. 2005, 7, 3255–3257. [DOI] [PubMed] [Google Scholar]
- Berger O.; Edholm O.; Jähnig F. Biophys. J. 1997, 72, 2002–2013. [DOI] [PMC free article] [PubMed] [Google Scholar]
- Nagle J. Biophys. J. 1993, 64, 1476–1481. [DOI] [PMC free article] [PubMed] [Google Scholar]
- Feller S. E.; Venable R. M.; Pastor R. W. Langmuir 1997, 13, 6555–6561. [Google Scholar]
- Chaudhuri P.; Gao Y.; Berthier L.; Kilfoil M.; Kob W. J. Phys.: Condens. Matter 2008, 20, 244126. [Google Scholar]
- Mashl R. J.; Scott H. L.; Subramaniam S.; Jakobsson E. Biophys. J. 2001, 81, 3005–3015. [DOI] [PMC free article] [PubMed] [Google Scholar]
- Hristova K.; White S. H. Biophys. J. 1998, 74, 2419–2433. [DOI] [PMC free article] [PubMed] [Google Scholar]
- Dragsten P. R.; Blumenthal R.; Handler J. S. Nature 1981, 294, 718–722. [DOI] [PubMed] [Google Scholar]
- Bussi G.; Donadio D.; Parrinello M. J. Chem. Phys. 2007, 126, 014101. [DOI] [PubMed] [Google Scholar]
- Han S.; Choi M.; Kumar P.; Stanley H. Nat. Phys. 2010, 6, 685–689. [Google Scholar]
- Parrinello M.; Rahman A. J. Chem. Phys. 1982, 76, 2662. [Google Scholar]
- Essmann U.; Perera L.; Berkowitz M. L.; Darden T.; Lee H.; Pedersen L. G. J. Chem. Phys. 1995, 103, 8577. [Google Scholar]
- Kasson P. M.; Hess B.; Lindahl E. Chem. Phys. Lipids 2013, 169, 106–112. [DOI] [PMC free article] [PubMed] [Google Scholar]
- Engin O.; Villa A.; Sayar M.; Hess B. J. Phys. Chem. B 2010, 114, 11093–11101. [DOI] [PubMed] [Google Scholar]
- Beutler T. C.; Mark A. E.; van Schaik R. C.; Gerber P. R.; van Gunsteren W. F. Chem. Phys. Lett. 1994, 222, 529–539. [Google Scholar]
- Bennett C. J. Comput. Phys. 1976, 22, 245–268. [Google Scholar]
- Pronk S.; Páll S.; Schulz R.; Larsson P.; Bjelkmar P.; Apostolov R.; Shirts M. R.; Smith J. C.; Kasson P. M.; van der Spoel D.; Hess B.; Lindahl E. Bioinformatics 2013, 29, 845–854. [DOI] [PMC free article] [PubMed] [Google Scholar]
Associated Data
This section collects any data citations, data availability statements, or supplementary materials included in this article.


