

Abstract
Immunotherapy may be used for the treatment of glioblastoma multiforme; however, the induced immune response is inadequate when either T cells or dendritic cells are used alone. In this study, we established a novel vaccine procedure in rats, using dendritic cells pulsed with C6 tumor cell lysates in combination with adoptive transfer of T lymphocytes from syngenic donors. On day 21 after tumor inoculation, all the rats were sacrificed, the brains were harvested for calculation of glioma volume, cytolytic T lymphocyte responses were measured by cytotoxic assay, and the frequency of regulatory T lymphocytes (CD4+CD25+FOXP3+) in the peripheral blood was investigated by flow cytometric analysis. The survival rate of rats bearing C6 glioma was observed. Results showed that the co-immunization strategy had significant anti-tumor potential against the pre-established C6 glioma, and induced a strong cytolytic T lymphocyte response in rats. The frequency of peripheral blood CD4+CD25+FOXP3+ regulatory T lymphocytes was significantly decreased following the combination therapy, and the rats survived for a longer period. Experimental findings indicate that the combined immunotherapy of glioma cell lysate-pulsed dendritic cell vaccination following adoptive transfer of T cells can effectively inhibit the growth of gliomas in rats, boost anti-tumor immunity and produce a sustained immune response while avoiding the accumulation of CD4+CD25+FOXP3+ regulatory T lymphocytes.
Keywords: glioma, dendritic cell, adoptive T cell, combined immunotherapy, CD4+CD25+FOXP3+ regulatory T cell
Research Highlights
This study found that combined immunotherapy, consisting of glioma cell lysate-pulsed dendritic cell vaccination following T cell adoptive transfer can effectively inhibit the growth of gliomas in rats, boost anti-tumor immunity and produce a sustained immune response while avoiding the accumulation of CD4+CD25+FOXP3+ regulatory T lymphocytes, thus providing a strong immune treatment program and scientific basis for the clinical treatment of malignant gliomas.
Abbreviations
FOXP3, forkhead box P3; Tregs, regulatory T cells
INTRODUCTION
Glioblastoma multiforme (GBM) is a highly invasive primary brain tumor characterized by the infiltration of tumor cells into the surrounding healthy brain tissue[1]. Even with combination therapy, including surgery, chemotherapy and radiotherapy, the median survival of patients diagnosed with GBM is 1 year (4–6 months after recurrence), with less than 5% of the patients living 5 years after diagnosis[2,3]. Novel therapies are therefore urgently needed to treat pa patients diagnosed with GBM.
Dendritic cells (DCs), which have been proven as effective vaccines for the control or eradication of established tumors, are specialized antigen-presenting cells that initiate and regulate immune responses against foreign, as well as self-antigens. Autologous DCs loaded with autologous tumor lysates have been used to vaccinate glioma patients in phase I clinical trials[4,5]. Adoptive immunotherapy with antigen-specific cytotoxic T lymphocytes (CTLs) has also been developed as a valid approach for the prevention or treatment of gliomas. Malignant gliomas express tumor-associated and tumor-specific antigens, making them detectable to immune cells. However, immune-mediated tumor eradication is very poor in glioma patients and most attempts at tumor immunotherapy in the clinic have met with little success to date. It is thought that the tumor microenvironment can inhibit effector T cell functions and thus prevent destruction of the tumor.
Recent work has raised a major concern about the potentially deleterious effects of cancer vaccines in hosts bearing advanced tumors, due to their adverse impact on regulatory T cells (Tregs)[6,7,8,9]. Tregs are a subpopulation of CD4+ T lymphocytes that constitutively express the transcription factor forkhead box P3 (FOXP3)[10,11,12]. Expression of the FOXP3 gene is strictly required for Treg development and ectopic expression can confer conventional CD4 T cells with regulatory functions[10,11,12]. Mutations in FOXP3 can cause acute autoimmune disorders in humans[13]. CD25 augments interleukin-2 signaling in CD4+ T cells leading to the activation of FOXP3 expression and thus, commitment of the cells to the Treg lineage[14,15]. By tracking CD25 and FOXP3 expression, it has been shown that both pre-existing natural Tregs and induced regulatory T cells contribute to the total population of CD4+CD25+FOXP3+ Tregs[16,17].
CD4+CD25+FOXP3+ Tregs, which cause a reduction in the duration of contact between naive antigen-specific CD4+ T cells and antigen-loaded DCs, play a key role in the prevention of T-cell responses to self-antigens[18,19]. Thus, Tregs may dominate and have an overall negative effect on tumor immunity once a tumor has become firmly established in vivo[20,21]. CD4+CD25+FOXP3+ Tregs accumulate within human gliomas during tumor progression and the degree of accumulation has been found to correlate with the tumor grade[22,23]. It is now widely acknowledged that Tregs represent one critical parameter to be considered during the design of therapeutic treatments for cancers, in particular immunotherapies. To improve the success rate of current tumor vaccines and immunotherapeutic strategies, we have established a novel vaccine procedure using DCs pulsed with C6 tumor cell lysates in combination with adoptive transfer of splenic T lymphocytes from syngenic donors. We observed the survival rate of rats bearing C6 glioma and measured the CTL response by cytotoxic assay following the combination therapy. To elucidate the mechanism that mediates the anti-tumor effects, we examined the frequency of peripheral blood Tregs (CD4+CD25+FOXP3+) in the CD4+ T cell population by flow cytometric analysis.
RESULTS
Quantitative analysis of experimental animals
A total of 88 rats were initially included and entered the final study with no loss. The rats were randomly divided into four groups: (i) PBS group, (ii) DCs group, (iii) T cells group, and (iv) DCs + T cells group, with 22 rats in each group (six rats for calculation of the glioma volume and flow cytometric analysis; six rats for analysis of cytotoxicity; ten rats for observation of survival rates).
Identification of cultured DCs
On day 5, clusters of developing dendritic cells were evident by light microscopy (Figure 1A). On day 9, floating cells were observed and these cells were considered mature bone marrow-derived DCs (Figure 1B, supplementary Figure 1 online). On day 7, cultured DCs had typical long cytoplasmic dendrites as observed by scanning electron microscopy (Figures 1C, D). By day 9 of DC culture, double immunocytochemistry staining demonstrated the expression of OX6 and OX62 was positive, and flow cytometric analysis showed that 83.4% of DCs were positive for OX62, whereas 80.5% were positive for OX6 (Figure 2).
Figure 1.
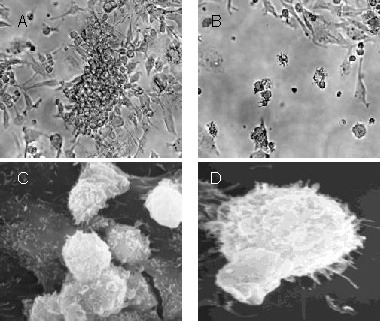
Morphology of cultured dendritic cells.
(A) On day 5, clusters of developing dendritic cells were observed (× 4, light microscopy).
(B) On day 9, floating cells were observed (× 10, light microscopy).
By scanning electrography at 7 days after culture, cultured dendritic cells had typical long cytoplasmic dendrites (C, ×5 000; D, × 7 000, electron microscopy).
Figure 2.
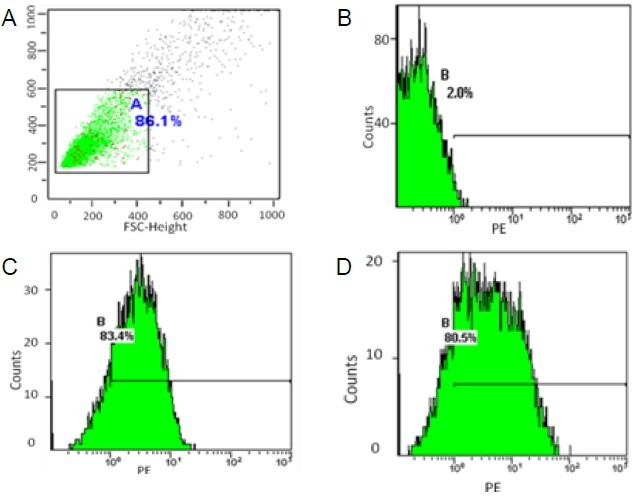
Phenotypes of dendritic cells detected by flow cytometric analyses.
(A) Negative control; (B) PE-Isotype control; (C) OX62; (D) OX6.
Vaccination of rats with C6 lysate-pulsed DCs and T cells significantly suppressed growth of glioma
As shown in Figure 3, immunization of rats with C6 lysate-pulsed DCs followed by adoptive transfer of T cells significantly suppressed the growth of the tumor compared with the PBS group (P < 0.01).
Figure 3.
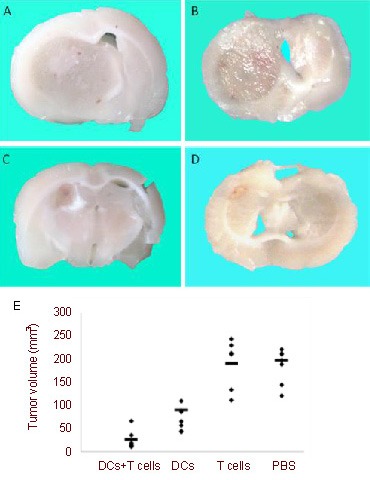
Vaccination with dendritic cells (DCs) and T cells significantly suppressed glioma growth.
(A–D) Representative photographs of coronal sections of the tumor's largest diameter from animals treated with (A) PBS, (B) T cells alone, (C) DCs alone, or (D) DCs +T cells (n = 6) were shown on day 21 after tumor inoculation.
(E) The volume of C6 gliomas was calculated. Immunization of rats with C6 lysate-pulsed DCs followed by adoptive transfer of T cells significantly suppressed the growth of the tumor compared with PBS group (P < 0.01, unpaired t-test). The horizontal lines represent the mean of each group.
Although immunization with C6 lysate-pulsed DCs alone also suppressed growth of the glioma, the combination therapy with C6 lysate-pulsed DCs and T cells was more effective (P < 0.01).
The inoculation with T cells alone was not effective in inhibiting the tumor volume compared with the PBS group. These results demonstrated that the C6 lysate-pulsed DC vaccine is effective in inhibiting growth of glioma in rats.
Survival rate was significantly enhanced by combined DC/T cell immunotherapy
The survival duration of tumor-bearing rats treated with C6 lysate-pulsed DCs and T cells was significantly prolonged compared with that of rats treated with DCs alone, T cells or PBS (P < 0.01; Figure 4).
Figure 4.

Co-immunotherapy increased the survival rate of rats with intracranial gliomas.
Kaplan-Meier graph showing the effect of immunotherapy of dendritic cells (DCs) vaccination following adoptive transfer of T cells on the survival rate of rats with intracranial gliomas (n = 10).
The survival rate of the rats was monitored for 70 days. Survival rate in the group treated with DCs + T cells is significantly higher than the group treated with DCs alone, T cells or PBS (overall log-rank P < 0.01).
Generation of tumor-specific CTLs in tumor-bearing rats by treatment with DCs and T cells
We demonstrated the induction of tumor-specific CTLs against C6 cells with a lactate dehydrogenase release assay using brain-infiltrating lymphocytes from experimental groups. The activated lymphocytes from DCs + T cells treated rats showed strong specific cytotoxicity against C6 cells. Vaccination with DCs alone induced weak cytotoxic responses against C6 cells. No significant cytotoxicity against C6 cells was detected in the cytotoxicity assay using cells from the T cells group or PBS group. The specific killing activity of the CTLs induced by DCs + T cells was statistically significant compared with the other experimental or control groups (P < 0.01; Figure 5).
Figure 5.
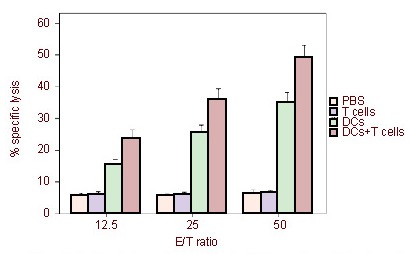
Cytotoxicity of cytotoxic T lymphocytes in rats treated with C6 lysate-pulsed dendritic cells (DCs) and T cells.
Brain-infiltrating lymphocytes from experimental groups (PBS, DCs, T cells and DCs + T cells) at 21 days after tumor cells inoculation were harvested and restimulated in vitro with C6 cells for 5 days.
Cytotoxic T lymphocyte activity against C6 cells was detected using a standard lactate dehydrogenase release assay using C6 cells as a target. The activated lymphocytes from DCs + T cells treated rats showed strong specific cytotoxicity against C6 cells.
Vaccination with DCs alone induced weak cytotoxic responses against C6 cells. No significant cytotoxicity against C6 cells was detected in the cytotoxicity assay of the T cells group and PBS group.
The specific killing activity of the cytotoxic T lymphocytes induced by DCs + T cells was significantly greater compared with other groups (P < 0.01).
The data are expressed as mean ± SD from three independent experiments, containing three rats each, carried out in triplicate. Differences between the means of each group were analyzed using an unpaired t-test. E/T ratios: Effector cells/target cells ratios in cytotoxic T lymphocytes.
Combined immunotherapy successfully inhibited the accumulation of CD4+CD25+FOXP3+ Tregs
We measured the frequency of blood CD4+CD25+FOXP3+ Treg cells by fluorescent-activated cell sorting Calibur flow cytometry. The frequency of CD4+CD25+FOXP3+ Treg cells among CD4+ T cells was significantly higher in the PBS group than in healthy non-glioma rats (P = 0.001). There was no significant difference in Treg cell numbers between the T cells group and the PBS group (P = 0.47). The frequency of CD4+CD25+FOXP3+ Tregs was significantly lower in both the DCs group and DCs + T cells groups compared with the PBS group (P = 0.002, P = 0.001, respectively). In addition, there was a significantly lower frequency of CD4+CD25+FOXP3+ Tregs in the group receiving combination therapy compared with the group receiving C6 lysate-pulsed DCs alone (P = 0.04; Figure 6).
Figure 6.
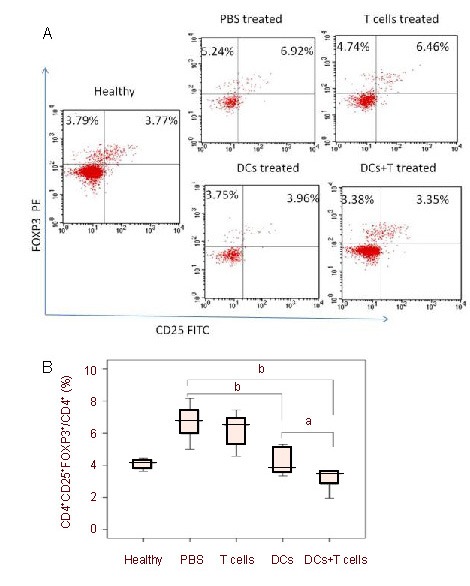
Peripheral changes in frequency of CD4+CD25+FOXP3+ regulatory T cells.
Peripheral blood samples of each group (six rats per group) were stained for extracellular CD4, CD25 and intracellular FOXP3 expression. The plots shown were gated on CD4+ T cells.
Percentages of double positive cells are indicated on the plots. Specific regions are marked, the gates and quadrants were set while analyzing the data based on isotype control antibody background staining.
Representative scatter plots (A) and mean ± SD values of CD4+CD25+FOXP3+ regulatory T cells from five independent experiments carried out using six rats per group (B) are shown. Differences between the means of each group were tested using an unpaired t-test. aP < 0.05, bP < 0.01.
DISCUSSION
The use of DCs as vaccines to activate endogenous tumor-specific T cells has been widely shown to be safe for clinical applications[24]. The problem of immune escape due to using a specific tumor-associated antigen to pulse DCs can be avoided by using total tumor cell lysate pulsed DCs[25], which are nontoxic and capable of inducing antigen-specific Th1 immunity in advanced cancer[26,27]. Fully mature and activated DCs can successfully activate endogenous tumor-specific T cells, inhibit the induction of CD25+FOXP3+ Tregs from non-Treg precursor cells, counter-regulate Tregs by upregulating inhibitory molecules to block their functions or by producing large quantities of cytokines that can hyperactivate the effector cells and render them resistant to suppression[28,29].
Tumor tissues express high levels of tumor growth factor-β, accumulate Tregs, and contain DCs that are unable to stimulate T cells, but instead promote the development of Tregs[30]. Furthermore, Tregs inhibit the cytotoxic function of T cells and NK cells, and the immune functions of B cells and other immune cells that results in the induction of poor immune responses[31,32,33,34]. A potent immune response requires the provision of signals that enable immune effectors to escape Treg control.
One major difference between tumor progression and rejection is the relative proportion of CD4+CD25+FOXP3+ cells to effector cells[35]. When DC vaccines were administered alone, antigen-specific CTLs were induced gradually, and thus although DC vaccines can induce early immune responses they are not maintained[36]. Although the induced CTLs initially target the tumor, the induced immune response fails as tumor-induced Tregs dominate. Furthermore, it is clear that Treg interactions can negatively affect DCs, as increased Tregs can induce apoptosis of DCs or inhibit their activation and function[37]. Thus, in the presence of established glioma, dysfunctional DCs may lead to exacerbated immune suppression due to the preferential induction and expansion of tumor specific Tregs.
Adoptive immunotherapy with antigen-specific CTLs has been also developed as an approach for the prevention or treatment of viral diseases and cancers. However, adoptive T cells used alone resulted in limited and transient antitumor responses. Potential reasons for this lack of clinical efficacy include undirected migration of T cells and a lack of persistence of adoptively transferred T cells in vivo. This may result from the inability of transferred cells to survive or proliferate because of insufficient antigen stimulation in vivo, activation-induced cell death, or susceptibility to immune regulatory cells[38]. Glioma might later recur or progress as these CTLs undergo programmed cell death and disappear, allowing eventual domination by the longer-lived Tregs.
The co-immunization strategy presented here demonstrated significant anti-tumor potential, effectively suppressed the growth of glioma, significantly enhanced the survival of rats bearing glioma, induced cytotoxic lymphocyte infiltration in the glioma microenvironment, and successfully inhibited the induction, expansion and accumulation of Tregs. These outcomes contributed to the potent induction of antigen specific CTLs, which were induced by fully mature DCs and adoptive T cells transfer. Although Tregs were also activated in glioma, a successful antitumor response was achieved when effector T cell activation outnumbered Treg activation[35]. Subsequently, because of dysfunctional antigen-presenting cells, aberrant co-signaling, prostaglandins, counter regulatory cytokines and hypoxia, reduced numbers of Tregs were induced due to the decreased tumor burden.
Perhaps a strategy where Tregs are depleted or inactivated as part of a vaccination regimen will prove useful, not only for increasing the immunogenicity of the vaccine but also by ensuring that Tregs, which favor tumor growth, are not induced[39,40,41]. A cell surface marker specific for Tregs that could be targeted with immunoglobulins to specifically deplete Tregs would be beneficial to overcome immunological tolerance/ignorance to brain tumor antigens. Unfortunately, the cell surface proteins on Tregs (for example, CD25 and CTLA4) are also expressed on other immune cells such as precursor and activated B and T lymphocytes, natural killer cells and a mature subpopulation of DCs[42,43,44]. Thus, depletion of Tregs using specific immunoglobulins may also deplete activated T cells, and in doing so can interfere with the clonal expansion of tumor antigen specific T cells during immunotherapy. Furthermore, the use of Treg depletion strategies will only be useful in the context of minimal residual disease[45]. A recent report has demonstrated that the total removal of Tregs from mice leads to different incidences of autoimmune disease, implying that distinct regulatory populations have unique effects on organ-specific diseases[46].
Taken together, the immune response declines too rapidly when T cells are used alone and is induced too gradually when DCs are used alone, greatly limiting the complete treatment of established tumors. The immune system of glioma-bearing hosts could be activated and the immunosuppressive state overcome after treatment with DC vaccination followed by adoptive transfer of T cells. Unlike the results obtained by the depletion of Tregs and chemical therapy, the co-immunization strategy neither inhibited cytotoxic function of T cells and other immune cells, nor induced autoimmune disease. All outcomes indicate that this therapeutic strategy is a safe, efficacious and promising approach.
The novelty of our study lies in the fact that we have investigated the mechanism of this co-immunotherapy, which may be due, in part, to inhibition of the accumulation of CD4+CD25+FOXP3+ Tregs. This is a unique method of using immunotherapy to treat glioma and has significant clinical potential. Several obstacles however need to be addressed before this therapy can be applied to humans with gliomas.
MATERIALS AND METHODS
Design
A randomized controlled experiment pertaining to in vitro culture of cells and immunology in animals.
Time and setting
Experiments were performed at the Beijing Neurosurgical Institute, Capital Medical University, Beijing, China between October 2009 and April 2011.
Materials
Animals
A total of 88 female, healthy, adult, Wister rats of clean grade, aged 10 weeks, weighing 230–240 g, were purchased from the Chinese Scientific Institute. During experimentation, the rats were maintained in pathogen-free animal facilities at a controlled humidity and temperature, under a 12-hour light/dark cycle. All animals were acclimated to the environment for at least 1 week before the experiments began. All animals were maintained and treated according to the Guidance Suggestions for the Care and Use of Laboratory Animals, published by the Ministry of Science and Technology of China[47].
Cell lines
Glioma cell line C6[48] was purchased from American Type Culture Collection (ATCC, Rockefeller, Maryland, USA).
Methods
Preparation of C6 tumor cell lysates
C6 glioma cells were cultured in DMEM complete medium (Gibco, Carlsbad, CA, USA) containing 10% fetal bovine serum (Gibco) at 37°C in 5% CO2. Cells were harvested, washed and resuspended in PBS at 1 × 10⁷ cells/mL. After 5 cycles of freezing and thawing, 100% of cells were seen to take up trypan blue by light microscopy (Nikon, Shanghai, China). Solid debris was then spun down at 1 700 × g for 5 minutes. The supernatant constituted the lysate, which was stored at -80°C for later use (supplementary Figure 2 online).
Culture and characterization of DCs
DCs were generated from rat bone marrow as previously described[18]. Rats were euthanized by cervical dislocation, and bone marrow cells were retrieved from the femur and tibiae of Wistar rats. Red blood cells were lysed with red blood cell lysis buffer. Cells were washed in PBS three times, added to Petri dishes and grown at a starting concentration of 1.5 × 10⁶ cells/mL in RPMI-1640 medium (Gibco) containing 10% fetal bovine serum (Gibco), 2 mM glutamine, 100 μg/mL penicillin (Gibco), 100 μg/mL streptomycin (Gibco), 500 U/mL of recombinant rat granulocyte-macrophage colony- stimulating factor (PeproTech, Rocky Hill, NJ, USA), and 500 U/mL of recombinant rat interleukin-4 (PeproTech). On days 2 and 4, half of the culture supernatant was removed and replaced with fresh medium containing recombinant rat granulocyte macrophage colony- stimulating factor and interleukin-4. On day 6, all the loosely adherent cells were harvested, centrifuged and counted. Then C6 glioma cell lysates and DCs (a ratio of 3 tumor cells to 1 DC) were incubated in fresh medium with recombinant rat granulocyte macrophage colony-stimulating factor and interleukin-4 together at 37°C in 5% CO2. To stimulate DC maturation in vitro, on day 8, the cultures were additionally supplemented with 20 ng/mL of lipopolysaccharide (Sigma, St Louis, MO, USA) and 1 μg/mL of recombinant rat tumor necrosis factor-α (PeproTech). On day 9, cells were collected for phenotypic analysis by flow cytometric analyses and vaccination.
To evaluate the phenotype of the mature DCs, the degree of expression of OX6 and OX62 on the cells surface was compared by flow cytometry as described previously[48]. For antibody staining, 5 × 10⁵ freshly cultured DCs were suspended in 100 μL of cold PBS. Phycoerythrin-conjugated OX6 and OX62 were added for 30 minutes at 4°C. Cells were analyzed by flow cytometry (FACScan, BD Biosciences, San Jose, CA, USA).
Preparation of T cells
C6 glioma cells were injected subcutaneously to activate T cells in Wistar rats (1 × 10⁶ C6 glioma cells per rat). Seven days after injection, splenocytes from Wistar rats were harvested and depleted of erythrocytes with red blood cell lysis buffer (Cambrex, Walkersville, MD, USA). Nonadherent splenocytes, from which most macrophages and monocytes were removed by adherence to plastic for 90 minutes, were collected. Cells at a concentration of 2 × 10⁶ were re-stimulated in 24-well culture plates with 4% paraformaldehyde pre-fixed 2 × 10⁵ C6 cells. Then, these cells were cultured in RPMI-1640 medium (Gibco) containing 10% fetal bovine serum, 500 U/mL of recombinant rat interleukin-2 (PeproTech) for 7 days at 37°C. Cells were collected and washed in PBS for adoptive transfer.
Establishment of tumor models and immunotherapy
Animals were anaesthetized intraperitoneally with 0.3 mL/100 g body weight of 10% chloral hydrate (Tasly, Tianjin, China). Intracranial tumor implantation was performed with the aid of stereotactic guidance, and 5 × 10⁵ cells in 10 μL PBS were injected intracranially into each rat on day 0. For the combined immunotherapy, 1 × 10⁷ T cells (in 100 μL PBS per rat) were injected into the tail vein, followed by 1 × 10⁶ C6 glioma lysate-pulsed DCs (in 100 μL PBS per rat) injected subcutaneously on day 3 after tumor inoculation. Subsequently, the DC vaccine was administered following the same protocol on days 7 and 14. For the DC treated group, 1 × 10⁶ C6 glioma lysate-pulsed DCs (in 100 μL PBS per rat) were injected subcutaneously on days 3, 7 and 14. For the T cell treated group, 1 × 10⁷ T cells (in 100 μL PBS per rat) were injected into the tail vein on day 3. For the control group, 100 μL of PBS per rat was injected subcutaneously on days 3, 7 and 14. The animals were monitored daily after treatment for manifestation of any pathologic signs associated with elevated intracranial pressure, such as hemiparesis, loss of appetite, or any altered grooming habits. Day 21 after tumor inoculation animals were sacrificed, the brains were harvested for calculation of tumor volume (n = 6 per group), and measurement of CTL responses by cytotoxic assay was performed (n = 6 per group), and the peripheral blood was investigated by flow cytometric analyses. The survival rate of the rats was monitored for 70 days (n = 10 per group; supplementary Videos 1–3 online).
Calculation of glioma volume
To assess the anti-tumor effect of the co-immunotherapy, we compared the volume of C6 gliomas between groups on day 21 after tumor inoculation (n = 6 per group). Immediately after death, the animals were perfused transcardially with 0.9% saline, followed by 4% formalin. The brains were harvested, postfixed in 4% formalin and coronal sections were cut to calculate the glioma volume using Vernier calipers (TAYASAF, Beijing, China) according to the formula: d1× (d2)2× 0.5 (d1 = largest diameter, d2 = perpendicular diameter).
Isolation of brain-infiltration lymphocytes
At 21 days after tumor cell inoculation, the entire brains were harvested and enzymatically digested[19]. Cells from each brain were re-suspended in 70% Percoll (Sigma), overlaid with 37% and 30% Percoll, then centrifuged for 20 minutes at 500 × g. Enriched brain-infiltrating lymphocytes were recovered at the 70–37% Percoll interface.
Cytotoxicity of CTLs
Brain-infiltrating lymphocytes were co-cultured with irradiated (5 000 rad) C6 cells. Five days later, the activated CTLs were harvested and tested for activity by lactate dehydrogenase release assay with Non-Radioactive Cytotoxicity Assay kit (Promega, Madison, WI, USA) according to the manufacturer's instructions. The assay was conducted in a volume of 100 μL using a 200 μL U-bottom 96-well plate at effector:target ratios of 50:1, 25:1, and 12.5:1 for 4 hours in a humidified 5% (v/v) CO2 atmosphere at 37°C. The percentage of specific cytolysis was determined using the following formula: 100 × lysis value A (experimental – culture medium background)/lysis value B (maximum LDH release – culture medium background).
Frequency of Tregs in peripheral blood
Whole blood from healthy, PBS treated, T cell treated, C6 lysate-pulsed DCs treated, and C6 lysate-pulsed DCs plus T cells groups (six rats per group) was collected into heparin-containing vacutainer tubes and processed within 2 hours. Peripheral blood mononuclear cells were isolated by Ficoll density gradient centrifugation for 20 minutes at 22°C and 800 × g. At least 1 × 10⁶ freshly isolated cells from each group were stained for phenotypic analysis in 1 × PBS and incubated with directly conjugated monoclonal antibodies for 30 minutes at room temperature in the dark. The following anti-rat mAbs (BD Biosciences) were used: PE-Cy5 conjugated mouse anti-rat CD4 (0.2 μg/μL), and FITC conjugated mouse anti-rat CD25 (0.5 μg/μL). For intracellular FOXP3 staining, cells were fixed and permeabilized with freshly prepared fixation/permeabilization working solution (eBioscience, San Diego, CA, USA). PE conjugated mouse anti-rat FOXP3 (0.2 μg/μL) intracellular staining was performed according to the manufacturer's instructions (eBioscience). Samples were acquired on a FACS Calibur flow cytometer (BD Biosciences). Matched isotype controls with corresponding fluorescence conjugation were used for each antibody in addition to surface stain controls to set appropriate quadrant boundaries for absolute-positive populations. Analysis was performed by fluorescence-activated cell sorter (FACS Calibur, BD Biosciences) and Cell Quest software (BD Biosciences).
Statistical analysis
The data analysis was performed using SPSS 13.0 software (SPSS, Chicago, IL, USA). Data were expressed as mean ± SD. Two group comparisons were performed using an unpaired t-test to determine the significance of the correlation between two variables. Survival data were analyzed by log rank test. A P value of < 0.05 was considered statistically significant.
Acknowledgments:
We acknowledge the expert technical assistance and the kind advice of Dr. Fusheng Liu from Beijing Neurosurgical Institute, Capital University of Medical Sciences, China.
Footnotes
Funding: This work was supported by the grant from the National Natural Science Foundation of China, No. 30872647.
Conflicts of interest: None declared.
Ethical approval: The experimental protocols were approved by the Animal Care and Use Committee of the Capital University of Medical Sciences in China.
Supplementary information: Supplementary data associated with this article can be found, in the online version, by visiting www.nrronline.org.
(Edited by Feng J, Gong QH/Yang Y/Song LP)
REFERENCES
- [1].Ohgaki H, Kleihues P. Epidemiology and etiology of gliomas. Acta Neuropathol. 2005;109(1):93–108. doi: 10.1007/s00401-005-0991-y. [DOI] [PubMed] [Google Scholar]
- [2].Behin A, Hoang-Xuan K, Carpentier AF, et al. Primary brain tumours in adults. Lancet. 2003;361(9354):323–331. doi: 10.1016/S0140-6736(03)12328-8. [DOI] [PubMed] [Google Scholar]
- [3].Stupp R, Hegi ME, Mason WP, et al. Effects of radiotherapy with concomitant and adjuvant temozolomide versus radiotherapy alone on survival in glioblastoma in a randomised phase III study: 5-year analysis of the EORTC-NCIC trial. Lancet Oncol. 2009;10(5):459–466. doi: 10.1016/S1470-2045(09)70025-7. [DOI] [PubMed] [Google Scholar]
- [4].De Vleeschouwer S, Fieuws S, Rutkowski S, et al. Postoperative adjuvant dendritic cell-based immunotherapy in patients with relapsed glioblastoma multiforme. Clin Cancer Res. 2008;14(10):3098–3104. doi: 10.1158/1078-0432.CCR-07-4875. [DOI] [PubMed] [Google Scholar]
- [5].Van Gool S, Maes W, Ardon H, et al. Dendritic cell therapy of high-grade gliomas. Brain Pathol. 2009;19(4):694–712. doi: 10.1111/j.1750-3639.2009.00316.x. [DOI] [PMC free article] [PubMed] [Google Scholar]
- [6].Zhou G, Drake CG, Levitsky HI. Amplification of tumor-specific regulatory T cells following therapeutic cancer vaccines. Blood. 2006;107(2):628–636. doi: 10.1182/blood-2005-07-2737. [DOI] [PMC free article] [PubMed] [Google Scholar]
- [7].Melief CJ. Cancer immunotherapy by dendritic cells. Immunity. 2008;29(3):372–383. doi: 10.1016/j.immuni.2008.08.004. [DOI] [PubMed] [Google Scholar]
- [8].Zitvogel L, Apetoh L, Ghiringhelli F, et al. Immunological aspects of cancer chemotherapy. Nat Rev Immunol. 2008;8(1):59–73. doi: 10.1038/nri2216. [DOI] [PubMed] [Google Scholar]
- [9].Jiang XB, Lu XL, Hu P, et al. Improved therapeutic efficacy using vaccination with glioma lysate-pulsed dendritic cells combined with IP-10 in murine glioma. Vaccine. 2009;27(44):6210–6216. doi: 10.1016/j.vaccine.2009.08.002. [DOI] [PubMed] [Google Scholar]
- [10].Fontenot JD, Gavin MA, Rudensky AY. Foxp3 programs the development and function of CD4+CD25+ regulatory T cells. Nat Immunol. 2003;4(4):330–336. doi: 10.1038/ni904. [DOI] [PubMed] [Google Scholar]
- [11].Hori S, Nomura T, Sakaguchi S. Control of regulatory T cell development by the transcription factor Foxp3. Science. 2003;299(5609):1057–1061. doi: 10.1126/science.1079490. [DOI] [PubMed] [Google Scholar]
- [12].Khattri R, Cox T, Yasayko SA, et al. An essential role for Scurfin in CD4+CD25+ T regulatory cells. Nat Immunol. 2003;4(4):337–342. doi: 10.1038/ni909. [DOI] [PubMed] [Google Scholar]
- [13].Wildin RS, Ramsdell F, Peake J, et al. X-linked neonatal diabetes mellitus, enteropathy and endocrinopathy syndrome is the human equivalent of mouse scurfy. Nat Genet. 2001;27(1):18–20. doi: 10.1038/83707. [DOI] [PubMed] [Google Scholar]
- [14].Burchill MA, Yang J, Vang KB, et al. Linked T cell receptor and cytokine signaling govern the development of the regulatory T cell repertoire. Immunity. 2008;28(1):112–121. doi: 10.1016/j.immuni.2007.11.022. [DOI] [PMC free article] [PubMed] [Google Scholar]
- [15].Lio CW, Hsieh CS. A two-step process for thymic regulatory T cell development. Immunity. 2008;28(1):100–111. doi: 10.1016/j.immuni.2007.11.021. [DOI] [PMC free article] [PubMed] [Google Scholar]
- [16].Fecci PE, Mitchell DA, Whitesides JF, et al. Increased regulatory T-cell fraction amidst a diminished CD4 compartment explains cellular immune defects in patients with malignant glioma. Cancer Res. 2006;66(6):3294–3302. doi: 10.1158/0008-5472.CAN-05-3773. [DOI] [PubMed] [Google Scholar]
- [17].Sonabend AM, Rolle CE, Lesniak MS. The role of regulatory T cells in malignant glioma. Anticancer Res. 2008;28(2B):1143–1150. [PubMed] [Google Scholar]
- [18].Zhu X, Lu C, Xiao B, et al. An experimental study of dendritic cells-mediated immunotherapy against intracranial gliomas in rats. J Neurooncol. 2005;74(1):9–17. doi: 10.1007/s11060-004-3339-x. [DOI] [PubMed] [Google Scholar]
- [19].Calzascia T, Masson F, Di Berardino-Besson W, et al. Homing phenotypes of tumor-specific CD8 T cells are predetermined at the tumor site by crosspresenting APCs. Immunity. 2005;22(2):175–184. doi: 10.1016/j.immuni.2004.12.008. [DOI] [PubMed] [Google Scholar]
- [20].Tadokoro CE, Shakhar G, Shen S, et al. Regulatory T cells inhibit stable contacts between CD4+ T cells and dendritic cells in vivo. J Exp Med. 2006;203(3):505–511. doi: 10.1084/jem.20050783. [DOI] [PMC free article] [PubMed] [Google Scholar]
- [21].Tang Q, Adams JY, Tooley AJ, et al. Visualizing regulatory T cell control of autoimmune responses in nonobese diabetic mice. Nat Immunol. 2006;7(1):83–92. doi: 10.1038/ni1289. [DOI] [PMC free article] [PubMed] [Google Scholar]
- [22].Yu P, Lee Y, Liu W, et al. Intratumor depletion of CD4+ cells unmasks tumor immunogenicity leading to the rejection of late-stage tumors. J Exp Med. 2005;201(5):779–791. doi: 10.1084/jem.20041684. [DOI] [PMC free article] [PubMed] [Google Scholar]
- [23].Piersma SJ, Welters MJ, van der Burg SH. Tumor-specific regulatory T cells in cancer patients. Hum Immunol. 2008;69(4-5):241–249. doi: 10.1016/j.humimm.2008.02.005. [DOI] [PubMed] [Google Scholar]
- [24].Gallimore A, Godkin A. Regulatory T cells and tumour immunity - observations in mice and men. Immunology. 2008;123(2):157–163. doi: 10.1111/j.1365-2567.2007.02748.x. [DOI] [PMC free article] [PubMed] [Google Scholar]
- [25].Okada H, Kohanbash G, Zhu X, et al. Immunotherapeutic approaches for glioma. Crit Rev Immunol. 2009;29(1):1–42. doi: 10.1615/critrevimmunol.v29.i1.10. [DOI] [PMC free article] [PubMed] [Google Scholar]
- [26].Chang AE, Redman BG, Whitfield JR, et al. A phase I trial of tumor lysate-pulsed dendritic cells in the treatment of advanced cancer. Clin Cancer Res. 2002;8(4):1021–1032. [PubMed] [Google Scholar]
- [27].Papewalis C, Fassnacht M, Willenberg HS, et al. Dendritic cells as potential adjuvant for immunotherapy in adrenocortical carcinoma. Clin Endocrinol (Oxf) 2006;65(2):215–222. doi: 10.1111/j.1365-2265.2006.02576.x. [DOI] [PubMed] [Google Scholar]
- [28].George TC, Bilsborough J, Viney JL, et al. High antigen dose and activated dendritic cells enable Th cells to escape regulatory T cell-mediated suppression in vitro. Eur J Immunol. 2003;33(2):502–511. doi: 10.1002/immu.200310026. [DOI] [PubMed] [Google Scholar]
- [29].Wong SB, Bos R, Sherman LA. Tumor-specific CD4+ T cells render the tumor environment permissive for infiltration by low-avidity CD8+ T cells. J Immunol. 2008;180(5):3122–3131. doi: 10.4049/jimmunol.180.5.3122. [DOI] [PubMed] [Google Scholar]
- [30].Biollaz G, Bernasconi L, Cretton C, et al. Site-specific anti-tumor immunity: differences in DC function, TGF-beta production and numbers of intratumoral Foxp3+ Treg. Eur J Immunol. 2009;39(5):1323–1333. doi: 10.1002/eji.200838921. [DOI] [PubMed] [Google Scholar]
- [31].Hussain SF, Yang D, Suki D, et al. The role of human glioma-infiltrating microglia/macrophages in mediating antitumor immune responses. Neuro Oncol. 2006;8(3):261–279. doi: 10.1215/15228517-2006-008. [DOI] [PMC free article] [PubMed] [Google Scholar]
- [32].El Andaloussi A, Lesniak MS. CD4+CD25+FOXP3+ T-cell infiltration and heme oxygenase-1 expression correlate with tumor grade in human gliomas. J Neurooncol. 2007;83(2):145–152. doi: 10.1007/s11060-006-9314-y. [DOI] [PubMed] [Google Scholar]
- [33].Ghiringhelli F, Ménard C, Martin F, et al. The role of regulatory T cells in the control of natural killer cells: relevance during tumor progression. Immunol Rev. 2006;214:229–238. doi: 10.1111/j.1600-065X.2006.00445.x. [DOI] [PubMed] [Google Scholar]
- [34].Lim HW, Hillsamer P, Banham AH, et al. Cutting edge: direct suppression of B cells by CD4+ CD25+ regulatory T cells. J Immunol. 2005;175(7):4180–4183. doi: 10.4049/jimmunol.175.7.4180. [DOI] [PubMed] [Google Scholar]
- [35].Bui JD, Uppaluri R, Hsieh CS, et al. Comparative analysis of regulatory and effector T cells in progressively growing versus rejecting tumors of similar origins. Cancer Res. 2006;66(14):7301–7309. doi: 10.1158/0008-5472.CAN-06-0556. [DOI] [PubMed] [Google Scholar]
- [36].Nestle FO, Banchereau J, Hart D. Dendritic cells: On the move from bench to bedside. Nat Med. 2001;7(7):761–765. doi: 10.1038/89863. [DOI] [PubMed] [Google Scholar]
- [37].Tran DQ, Shevach EM. Therapeutic potential of FOXP3(+) regulatory T cells and their interactions with dendritic cells. Hum Immunol. 2009;70(5):294–299. doi: 10.1016/j.humimm.2009.02.007. [DOI] [PMC free article] [PubMed] [Google Scholar]
- [38].Dudley ME, Rosenberg SA. Adoptive-cell-transfer therapy for the treatment of patients with cancer. Nat Rev Cancer. 2003;3(9):666–675. doi: 10.1038/nrc1167. [DOI] [PMC free article] [PubMed] [Google Scholar]
- [39].Rozková D, Tiserová H, Fucíková J, et al. FOCUS on FOCIS: combined chemo-immunotherapy for the treatment of hormone-refractory metastatic prostate cancer. Clin Immunol. 2009;131(1):1–10. doi: 10.1016/j.clim.2009.01.001. [DOI] [PubMed] [Google Scholar]
- [40].Ruter J, Barnett BG, Kryczek I, et al. Altering regulatory T cell function in cancer immunotherapy: a novel means to boost the efficacy of cancer vaccines. Front Biosci. 2009;14:1761–1770. doi: 10.2741/3338. [DOI] [PubMed] [Google Scholar]
- [41].Jordan JT, Sun W, Hussain SF, et al. Preferential migration of regulatory T cells mediated by glioma-secreted chemokines can be blocked with chemotherapy. Cancer Immunol Immunother. 2008;57(1):123–131. doi: 10.1007/s00262-007-0336-x. [DOI] [PMC free article] [PubMed] [Google Scholar]
- [42].Curiel TJ. Regulatory T cells and treatment of cancer. Curr Opin Immunol. 2008;20(2):241–246. doi: 10.1016/j.coi.2008.04.008. [DOI] [PMC free article] [PubMed] [Google Scholar]
- [43].Taniguchi T, Minami Y. The IL-2/IL-2 receptor system: a current overview. Cell. 1993;73(1):5–8. doi: 10.1016/0092-8674(93)90152-g. [DOI] [PubMed] [Google Scholar]
- [44].Yi H, Zhen Y, Jiang L, et al. The phenotypic characterization of naturally occurring regulatory CD4+CD25+ T cells. Cell Mol Immunol. 2006;3(3):189–195. [PubMed] [Google Scholar]
- [45].Curtin JF, Candolfi M, Fakhouri TM, et al. Treg depletion inhibits efficacy of cancer immunotherapy: implications for clinical trials. PLoS One. 2008;3(4):e1983. doi: 10.1371/journal.pone.0001983. [DOI] [PMC free article] [PubMed] [Google Scholar]
- [46].Alyanakian MA, You S, Damotte D, et al. Diversity of regulatory CD4+ T cells controlling distinct organ-specific autoimmune diseases. Proc Natl Acad Sci U S A. 2003;100(26):15806–15811. doi: 10.1073/pnas.2636971100. [DOI] [PMC free article] [PubMed] [Google Scholar]
- [47].The Ministry of Science and Technology of the People's Republic of China. Guidance Suggestions for the Care and Use of Laboratory Animals. 2006-09-30 [Google Scholar]
- [48].Chen-Woan M, Delaney CP, Fournier V, et al. In vitro characterization of rat bone marrow-derived dendritic cells and their precursors. J Leukoc Biol. 1996;59(2):196–207. doi: 10.1002/jlb.59.2.196. [DOI] [PMC free article] [PubMed] [Google Scholar]