

Abstract
Fentanyl is a highly selective μ-opioid receptor agonist with high analgesic activity. Three-dimensional pharmacophore models were built from a set of 50 fentanyl derivatives. These were employed to elucidate ligand-receptor interactions using information derived only from the ligand structure to identify new potential lead compounds. The present studies demonstrated that three hydrophobic regions, one positive ionizable region and two hydrogen bond acceptor region sites located on the molecule seem to be essential for analgesic activity. The results of the comparative molecular field analysis model suggested that both steric and electrostatic interactions play important roles. The contributions from steric and electrostatic fields for the model were 0.621 and 0.379, respectively. The pharmacophore model provides crucial information about how well the common features of a subject molecule overlap with the hypothesis model, which is very valuable for designing and optimizing new active structures.
Keywords: fentanyl, genetic algorithm with linear assignment of hypermolecular alignment of datasets, pharmacophore, analgesic, comparative molecular field analysis
Abbreviations
GALAHAD, genetic algorithm with linear assignment of hypermolecular alignment of datasets; CoMFA, comparative molecular field analysis; 3D-QSAR, three dimensional quantitative structure-activity relationship
INTRODUCTION
Fentanyl is a highly selective μ-opioid agonist with specific pharmacological properties. Due to its high analgesic potency and generally favorable pharmacological profile, it is used widely as a narcotic analgesic[1]. However, because of the side effects of respiratory depression and their habit-forming characteristics, only three fentanyl-like compounds are commercially available: alfentanil, remifentanil and sufentanil (Figure 1). Due to their high potency and short duration of action, they are used mainly for the induction of general anesthesia.
Figure 1.
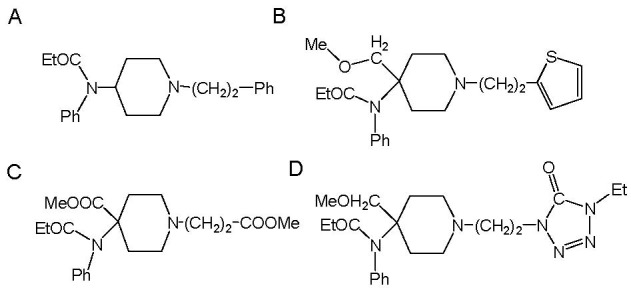
The structures of commercially available fentanyl-like compounds.
(A) Fentanyl; (B) Suentanli; (C) Remifentanil; (D) Alfentanil.
The derivatives sufentanil and alfentanil have been used as anesthetics. They have only slight effects on the cardiovascular system, so could be used in heart surgery. With the increasing use of transdermal formulations for the treatment of chronic and cancer-related pain, the search of new analogs with increased potency and longer duration of action could represent an interesting approach for novel analgesics[2,3].
In rational drug design, the biological activity of a set of compounds acting upon a particular protein is usually known, but information on the three-dimensional (3D) structure of the active site of the protein is not. A 3D pharmacophore hypothesis which is consistent with known data should be useful and predictive for evaluating new compounds and directing further design and synthesis[4,5]. A pharmacophore model postulates that there is an essential 3D arrangement of functional groups that a molecule must possess to be recognized by the active site of a macromolecule. It collects common features distributed in 3D space which are intended to represent groups in a molecule that participate in important interactions between drugs and the active sites of macromolecules[6]. Hence, a pharmacophore model provides crucial information about how well the common features of a subject molecule overlap with the hypothesis model. It also informs the ability of molecules to adjust their conformations to fit an active site with energetically reasonable conformations[7,8]. Such characterized 3D models convey important information in an intuitive manner. Genetic algorithm with linear assignment of hypermolecular alignment of datasets (GALAHAD) is a new program developed for carrying out molecular alignments based on pharmacophoric and steric features shared among a set of ligands[9]. The pharmacophore models produced comprise overlaid ligand structures and a pharmacophore query suitable for 3D flexible searching. The features are typically distributed across two sets, with all or most features in one set required to match and the remainder falling into a relatively “loose” partial match constraint. Partial mapping allows the identification of larger, more diverse, more significant hypotheses and alignment models without the risk of missing compounds that do not map to all of the pharmacophore features.
GALAHAD finds common-feature pharmacophore models among a set of highly active compounds. It therefore carries out a “qualitative model” without the use of activity data. This represents the essential 3D arrangement of functional groups common to a set of molecules for interacting with a specific biological target[10]. GALAHAD does not require the selection of a template because each molecule in the dataset is treated as a template. Nevertheless, such models can also serve as templates for subsequent GALAHAD runs, allowing other ligands to be fitted to them. This 3D array of chemical features provides a relative alignment for each input molecule consistent with its binding to a proposed common receptor site[11]. The chemical features considered can be: donors and acceptors of hydrogen bonds; aliphatic and aromatic hydrophobes; positive and negative charges; and positive and negative ionizable groups[12].
In the present study, identification of a hypothetical 3D ligand-based pharmacophore model was based on a novel pharmacophore screening method. GALAHAD implemented in the SYBYL program was conducted to search for pharmacophores. It modeled ligand-receptor interactions using information derived only from the ligand structure to identify new potential lead compounds. The most crucial step in undertaking comparative molecular field analysis (CoMFA) is to determine the bioactive conformations of the compounds so that all compounds can be aligned together. In the present study, a fairly rigid structure was selected as the template for structural alignment to establish three-dimensional quantitative structure-activity relationship (3D-QSAR) models[13].
RESULTS
Generation of a 3D pharmacophore
To set up a more general pharmacophore, a larger structural diversity was taken into account (Figure 2).
Figure 2.
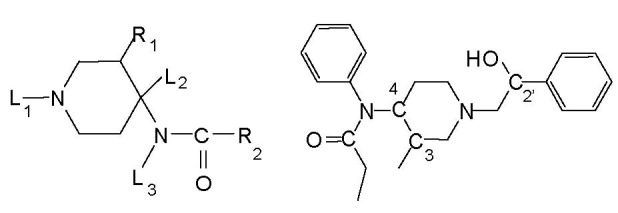
Compound 1 (left) and compound 2 (right) structures used for pharmacophore screening.
Moreover, pharmacophore generation required compounds with potentially the same binding orientation in the active site and high relative potency[14,15]. Consequently, a set of 50 molecules was used to generate the 3D pharmacophore in the present study. The 50 molecules were divided into a training set (45 molecules with prefixes A_, B_, C_, D_, E_, F_ and G_ are from the references[16] and which all had high relative analgesic potency; Table 1) and a test set (five molecules with prefixes H_; Table 2) by means of chemical and biological diversity. The parameter settings of align molecules used in searching for a pharmacophore are shown in Table 3.
Table 1.
The substituents of structure of compound 1 used for pharmacophore screening

Table 2.
The substituents of the structure of compound 2 used for pharmacophore validation

Table 3.
Parameter setting of align molecules

To generate potential conformations that the ligands may adopt, we used the automated feature alignment available in GALAHAD. Some molecules used in the present study had chiral centers (Figures 3 and 4), some of which have been reported[9,11]. However, regarding the asymmetric atoms of compounds G_7, E_44, E_38, because no experimental data on the biologically relevant conformations of these molecules were available, it was arbitrarily decided to assign “undefined” chirality. This allowed the pharmacophore model procedure to choose which configuration of the asymmetric carbon atoms was the most appropriate[17,18,19].
Figure 3.
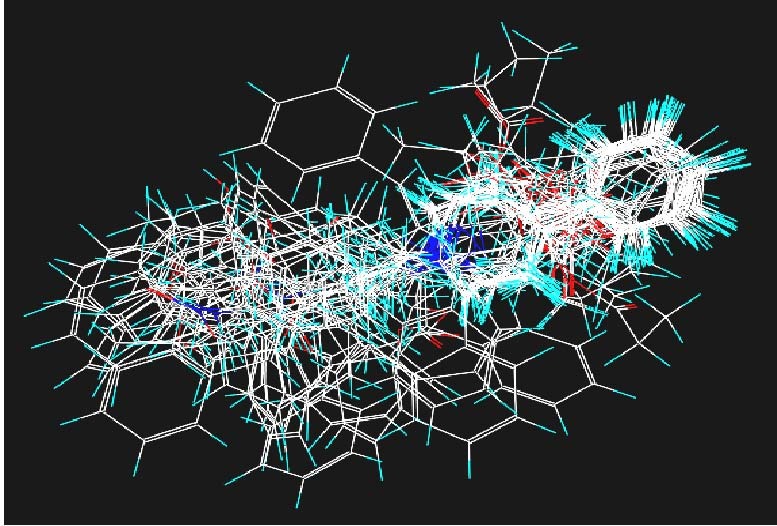
Stereoview of the aligned congruent molecules.
Different colors represent different substituents and groups.
Figure 4.
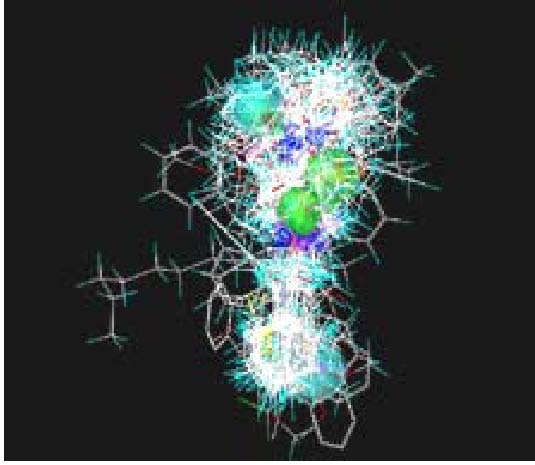
Congruent molecules for quantitative structure-activity relationship calculation.
Different colors represent different substituents and groups.
The control parameters used for pharmacophore generation are summarized in Table 4. The overlay alignment of the training compounds which generated model 19 is shown in Figure 5.
Table 4.
Some parameters used for running pharmacophore hypothesis generation

Figure 5.
The best hypothesis of compound G_2 mapping to model 19.
We used the function of “align molecules to template individually”, and the statistical results are displayed in Table 5. When values of the relative potency increased, the similarity of the pharmacophore query and the similarity of the pharmacophore also increased[20,21,22]. Model 19 had two ACCEPTOR_SITEs whereas model 13 had three ACCEPTOR_SITEs (Figure 6). The relative locations of the phores between the two models were slightly different. Then, using the function of align molecules to template individually[23], the test set (Table 2) was applied to validate the two hypotheses (Table 6).
Table 5.
Summary of the statistical results, when aligning the molecules individually to models 19 and 13

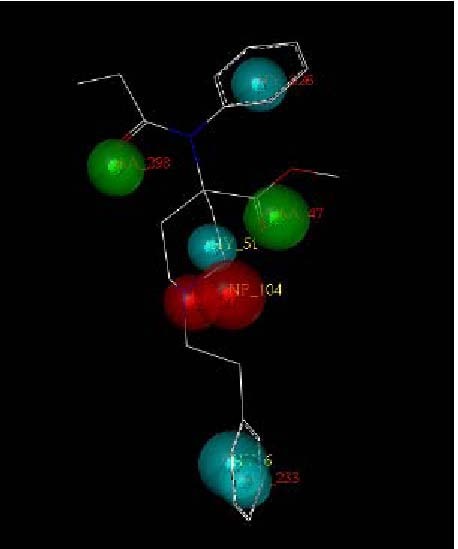
Figure 6.
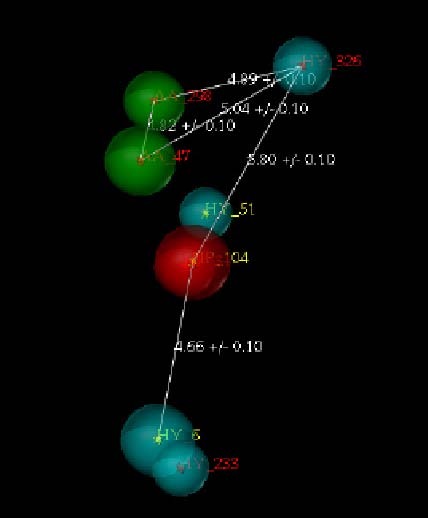
Essential features of model 19 pharmacophore.
Table 6.
The result of the pharmacophore validation of align molecules to template

Lead compound model built using information derived from the ligand structure
The results of the CoMFA model suggested that steric and electrostatic interactions had important roles. The contributions from steric and electrostatic fields for the model were 0.621 and 0.379, respectively. The CoMFA contour maps provided a visual representation of the prospective binding modes of the fentanyl analogs, and could be used to predict the analgesic activities of novel ligands. This feature may be useful for pain control, and could provide clues for structural modifications to improve activity.
DISCUSSION
Twenty hypotheses were generated, and the two models shown in Table 5 were chosen based on the criteria shown below. Low-energy conformers of the highly active compounds mapped to the model ideally. The resultant models were further validated through the test set (Table 2) and the results were reasonable. Among the 20 hypotheses, model 19 and model 13 complied with low-energy conformers of the highly active compounds mapping to the model ideally (Figure 6). Seven representative molecules chosen from the molecules used for pharmacophore screening were aligned individually onto model 19 and model 13 separately.
Differences in the molecule conformations resulted in differences in relative potencies (Table 6). When the values of the relative potency increased, the similarity of the pharmacophore query and the similarity of the pharmacophore increased, whereas the energy of the conformations decreased. For some inactive compounds, their lack of affinity was primarily due to their inability to achieve an energetically favorable conformation shared by the active compounds[24,25,26,27]. Among the five molecules, H_1 was the most active, but its MOL_QRY value (which reflects how similar the pharmacophore query is to the ligands) based on model 13, was too low. This suggested that the similarity of the pharmacophore query was not satisfactory whereas the MOL_QRY value based on model 19 was acceptable. We choose model 19 as the most appropriate model. It was found that the hypothesis had a good correlation with MOL_QRY and relative potency. Figure 5 shows the mapping of a statistically optimal hypothesis with compound G_2. G_2 mapped well to all the features of the hypotheses. Pharmacophore screening using GALAHAD was undertaken as shown in Figure 6.
The analysis of CoMFA contour maps provided insights into possible modification of the molecules for higher activity. Favored and disfavored levels, fixed at 80% and 20%, respectively, were used to display steric and electrostatic fields (Figure 7). The contours for steric fields are shown in green (more bulk favored) and yellow (less bulk favored), whereas the electrostatic field contours are shown in red (electronegative substituents favored) and blue (electropositive substituents favored). The green polyhedron located at the N substituent of the pyridine ring indicated that bulky substituents would be favorable. This explains why compounds 1, 2, 3 and 4 had relatively lower activity than other compounds with a bulky replacement at the N position. At the benzene-ring position, there was a relatively large yellow region. This suggested that substituents on this position could not be too bulky otherwise lower activity would result, so no substituents or small groups on the benzene ring were permitted[15,28]. The red polyhedron located at the R2 substituent position suggested that a negatively charged atom or group may increase activity, so electron-rich atoms and groups at this position showed strong activity. This was why compounds 10, 13, 16 and 19 were more potent than compounds 8, 11, 14 and 17, respectively. The large blue polyhedral circling the pyridine ring suggested that substitution by electropositive elements on the pyridine ring were favorable (i.e., that positively charged groups such as NO2, CN and F would show more potent activity). The respective relative contributions of steric and electrostatic fields were 0.481 and 0.519, respectively, indicating that the electrostatic field was predominant.
Figure 7.
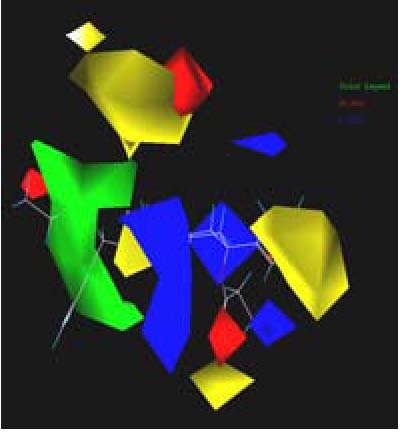
Comparative molecular field analysis (CoMFA) steric and electrostatic contour with μ opioid receptor plot from partial least squares analysis.
The green polyhedron located at the N substitute of pyridine ring indicates bulky substituents. At the benzene ring position, there is a relatively large yellow region suggesting substituent on this position. The red polyhedron located at R2 substituent position suggests negative atom or group
In the present study, 50 compounds which were potent competitive μ opioid agonists were successfully aligned. The model had been created to explain the observed structure-activity relationships for a series of derivatives. Among the 20 commonly featured models generated by program SYBYL/GALAHAD, compound G_2 with high relative potency mapped well onto all the HY, NP and AA features of the hypothesis, which was further validated by using an external set of five compounds. Conversely, less active compounds were shown to have difficulty achieving the energetically favorable conformations seen in active molecules that fitted the 3D common-feature pharmacophore models. The present study demonstrated that three HY, one NP and two AA sites located on the molecule seemed to be essential for analgesic activity.
The 3D-QSAR analysis using CoMFA based on the resultant pharmacophore was successfully applied to a set of fentanyl derivatives.
Virtual screening of commercial databases was undertaken using a 3D pharmacophore developed using GALAHAD. Based on the structure of the virtual hits, small-molecule libraries with novel scaffolds were designed. According to the predictions provided by the model, the synthesis and biological evaluation of analogs are currently in progress.
MATERIALS AND METHODS
Design
A computer-aided drug design study.
Time and setting
The present study was undertaken at the Life Science College and Chemistry Department of Capital Normal University (Beijing, China) from 2004 to 2011.
Methods
GALAHAD used in pharmacophore screening
The overall process comprised two major steps: (1) a pharmacophore model was built using GALAHAD; (2) a GALAHAD module in SYBYL was employed to align the dataset with the resultant pharmacophores as templates[25,29,30].
Pharmacophore screening and CoMFA studies were done on a Redhat Linux WS 3.0 system using the SYBYL 7.0 software package ver 7.2 (Tripos, St. Louis, MO, USA) installed on a Pentium 3.6 GHz personal computer. Structural and biological data were collected from articles[31] in which all compounds were tested for their analgesic ability using the hotplate test in mice. The relative analgesic potency was calculated by using the 50% effective dose values of morphine as standard[32]. The structures were built with the Sketcher module and energy minimized by Powell's method using Tripos force field and Gasteiger-Marsili charges[33]. Minimization was terminated at a maximum value of the gradient at 21 kJ/mol/nm.
GALAHAD used in 3D-QSAR analyses
A low value of q2 for the training set can serve as an indicator of the low predictive ability of a model, but the opposite is not necessarily true. Indeed, a high value of q2 does not automatically imply a high predictive ability of the model. To develop and validate the model, one needs to split the entire available dataset into the training and test set. The only way to estimate the true predictive power of a model is to test it on a sufficiently large collection of compounds from an external test set. A set of 50 molecules was used to generate the 3D pharmacophore (Table 1). The analgesic activity, log10 potency, was used as a dependent variable. Using the training-set molecules, 3D-QSAR models were generated and validated with the test set. The external predictions were used to select the best model. We used values of log10 potency as the dependent variable in the linearization procedure, gathered in Table 1, and the activity values were transformed as follows: Activity = log10(potency)
where the potency values are the relative potency based on the morphine's (morphine = 1).
Meaningful conformations and suitable alignments of lead compounds for building interpretable and predictive models are essential for 3D-QSAR/CoMFA and ligand-based drug design in general. The present study used GALAHAD to align the training set molecules. It is done by decomposing the process into two steps: a genetic algorithm[34] operating in torsional (internal coordinate) space is used to examine the full range of possible conformations, then a rigid-body hyper-molecular alignment process is applied to overlay the conformations obtained in Cartesian space. In this work, we align the molecules of the training set on compound 10 using GALAHAD, which has the highest relative potency. The steric and electrostatic fields in CoMFA were calculated at each lattice intersection of a regularly spaced grid of 0.2 nm in all three dimensions within the defined region. The steric and electrostatic field energies were calculated using a sp3 carbon atom with a +1 charge as a probe. The van der Waals potential and Coulombic energy between the probe and the molecule were calculated using the standard Tripos force field. A distance-dependent dielectric constant of 1.0r was used in the calculation of the electrostatics. The steric field and the electrostatic fields were truncated at points where the value exceeded +126 kJ/mol.
Partial Least Squares regression[9] was used to set up a correlation between the molecular fields and the biological data of the molecules. Leave-One-Out cross-validation was utilized to optimize the number of principal components and to evaluate the predictive capability of models.
To speed up the analysis and reduce noise, columns with a value (r) below 8.2 kJ/mol were filtered off. Final analysis was performed to calculate the conventional r2 using the optimum number of components. Knowing the risk of utilizing the leave-one-out q2 as a criterion for selecting the best model, the quality of the final models was further verified using leave-N-out (10%) cross-validation[35].
CoMFA model validation and CoMFA contours
The most critical and important part of the QSAR model development is the model validation. It is widely accepted that a correlation with a q2 value greater than 0.5-0.6 is useful for the prediction of new biologically active molecules in the present work, only models having a value of cross-validated r2 (q2) above 0.5 were considered. The predictive correlation coefficient (r2pred), based on the test set molecules, is defined as r2pred = (SD-PRESS)/SD,
where SD is the sum of squared deviations between the biological activity of the test set and the mean activity of the training set molecules and the PRESS is the sum of squared deviations between predicted and actual activity values for every molecule in the test set. In the present study, the r2 value of the test set for the best model is 0.627.
Acknowledgments
We would like to thank Dr. Zhuo Wang for checking, Xiaoli Liu for technical support and management from the Team of Computational Chemistry, Molecular Designing and Molecular Pharmacology of Prof. Wenxiang Hu Laboratory.
Footnotes
Funding: This study was supported by the National Natural Science Foundation of China, No. 20872095.
Conflicts of interest: None declared.
(Edited by Shi XQ, Zhang JJ/Qiu Y/Wang L)
REFERENCES
- [1].Li B, Liu M, Hu WX. Molecular docking and molecular dynamics simulations of fentanyl analogs binding to μ-opioid receptors. Wuli Huaxue Xuebao. 2010;26(1):206–214. [Google Scholar]
- [2].Liu M, Li B, Hu WX. 3D QSAR of Imidazoline-derived α (2A)-adrenergic ligands on the basis of molecular docking. Huaxue Tongbao. 2010;(11):989–994. [Google Scholar]
- [3].Hu WX, Li PR, Jiang GX, et al. A mild catalytic oxidation system: alkenes were selectively converted into epoxides, aldehydes, dialcohols and acids catalyzed by ruthenium porphyrin. Adv Synth Catal. 2010;352:3190–3194. [Google Scholar]
- [4].Zhu HW, Fang H, Hu WX, et al. 3D-QSAR study with pharmacophore-based molecular alignment of hydroxamic acid-related phosphinates that are amino-peptidase N inhibitors. Drug Discov T. 2008;2:192–197. [PubMed] [Google Scholar]
- [5].Lemmen C, Zimmermann M, Lengauer T. Multiple molecular superpositioning as an effective tool for virtual database screening. Perspect Drug Dis Des. 2000;20(1):43–62. [Google Scholar]
- [6].Chen Y, Mestek A, Liu J, et al. Molecular cloning of a rat kappa opioid receptor reveals sequence similarities to the mu and delta opioid receptors. Biochem J. 1993;295(Pt 3):625–628. doi: 10.1042/bj2950625. [DOI] [PMC free article] [PubMed] [Google Scholar]
- [7].Wild DJ, Willett P. Similarity searching in files of three-dimensional chemical structures. alignment of molecular electrostatic potential fields with a genetic algorithm. J Chem Inf Comput Sci. 1996;36(2):159–167. [Google Scholar]
- [8].Waldhoer M, Bartlett SE, Whistler JL. Opioid receptors. Annu Rev Biochem. 2004;73:953–990. doi: 10.1146/annurev.biochem.73.011303.073940. [DOI] [PubMed] [Google Scholar]
- [9].Liu XL, Wang LY, Hu WX. Homology modeling of human μ opioid receptor and analysis of its active site. Huaxue Tongbao. 2009;72(2):133–137. [Google Scholar]
- [10].Patel Y, Gillet VJ, Bravi G, et al. A comparison of the pharmacophore identification programs: Catalyst, DISCO and GASP. J Comput Aided Mol Des. 2002;16(8-9):653–681. doi: 10.1023/a:1021954728347. [DOI] [PubMed] [Google Scholar]
- [11].Pitman MC, Huber WK, Horn H, et al. FLASHFLOOD: a 3D field-based similarity search and alignment method for flexible molecules. J Comput Aided Mol Des. 2001;15(7):587–612. doi: 10.1023/a:1011921423829. [DOI] [PubMed] [Google Scholar]
- [12].Wu X, Yang ST, Wang H, et al. Influences of the size and hydroxyl number of fullerenes/fullerenols on their interactions with proteins. J Nanosci Nanotechnol. 2010;10(10):6298–6304. doi: 10.1166/jnn.2010.2623. [DOI] [PubMed] [Google Scholar]
- [13].Hahn M. Three-dimensional shape-based searching of conformationally flexible compounds. J Chem Inf Comput Sci. 1997;37(1):80–86. [Google Scholar]
- [14].Liu M, Wan P, Hu WX. Hangzhou: Information Science and Engineering (ICISE), 2010 2nd International Conference; 2010. Protein sequence alignment of target for entanyl analgesics μ-opioid receptor and its analysis. [Google Scholar]
- [15].Lemmen C, Lengauer T. Computational methods for the structural alignment of molecules. J Comput Aided Mol Des. 2000;14(3):215–232. doi: 10.1023/a:1008194019144. [DOI] [PubMed] [Google Scholar]
- [16].Lipinski CA, Lombardo F, Dominy BW, et al. Experimental and computational approaches to estimate solubility and permeability in drug discovery and development settings. Adv Drug Deliv Rev. 2001;46(1-3):3–26. doi: 10.1016/s0169-409x(00)00129-0. [DOI] [PubMed] [Google Scholar]
- [17].Ding CY, Tu SH, Yao QZ, et al. One-pot three-step synthesis of naphtho[2,3-a]carbazole- 5,13-diones using a tandem radical alkylation–cyclization–aromatization reaction sequence. Adv Synth Catal. 2010;352(5):847–853. [Google Scholar]
- [18].Unger VM, Hargrave PA, Baldwin JM, et al. Arrangement of rhodopsin transmembrane a-helices. Nature. 1997;389(11):203–206. doi: 10.1038/38316. [DOI] [PubMed] [Google Scholar]
- [19].He F, Meng F, Song X, et al. First and convergent synthesis of hybrid sulfonophosphinopeptides. Org Lett. 2009;11(17):3922–3925. doi: 10.1021/ol901543y. [DOI] [PubMed] [Google Scholar]
- [20].Ding C, Tu S, Li F, et al. Synthesis study on marmycin A: preparation of the C3’-desmethyl analogues. J Org Chem. 2009;74(16):6111–6119. doi: 10.1021/jo9011078. [DOI] [PubMed] [Google Scholar]
- [21].Baskin II, Tikhonova IG, Palyulin VA, et al. Selectivity fields: comparative molecular field analysis (CoMFA) of the glycine/NMDA and AMPA receptors. J Med Chem. 2003;46(19):4063–4069. doi: 10.1021/jm030833a. [DOI] [PubMed] [Google Scholar]
- [22].Dai Y, Guo Y, Frey RR, et al. Thienopyrimidine ureas as novel and potent multitargeted receptor tyrosine kinase inhibitors. J Med Chem. 2005;48(19):6066–6083. doi: 10.1021/jm050458h. [DOI] [PubMed] [Google Scholar]
- [23].Liu M, Wu QS, Hu WX. Pharmacophore screening on piperidinecarboxamides derivatives based on GALAHAD and CoMFA models. Zhongguo Huaxue. 2011;29(6):1075–1083. [Google Scholar]
- [24].Krämer A, Horn HW, Rice JE. Fast 3D molecular superposition and similarity search in databases of flexible molecules. J Comput Aided Mol Des. 2003;17(1):13–38. doi: 10.1023/a:1024503712135. [DOI] [PubMed] [Google Scholar]
- [25].Putta S, Lemmen C, Beroza P, et al. A novel shape-feature based approach to virtual library screening. J Chem Inf Comput Sci. 2002;42(5):1230–1240. doi: 10.1021/ci0255026. [DOI] [PubMed] [Google Scholar]
- [26].Ljiljana I DM. Molecular modelling of fentanyl analogs. J Serb Chem Soc. 2004;69(11):843–854. [Google Scholar]
- [27].Liu JQ, Wang CF, Hu WX, et al. Six new triterpen-oid glycosides from gynostemma pentaphyllum. Helv Chim Acta. 2009;92(12):237–245. [Google Scholar]
- [28].Chen LM, Zhou XM, Cao YL, et al. Neuroprotection of ginsenoside Re in cerebral ischemia-reperfusion injury in rats. J Asian Nat Prod Res. 2008;10(5-6):439–445. doi: 10.1080/10286020801892292. [DOI] [PubMed] [Google Scholar]
- [29].Wang L, Hu WX, Liu XL. The modeling of three-dimensional structure of human μ-opioid receptor and the study of molecular docking of fentanyl analogs. Computer Appl Chem. 2009;26:746–750. [Google Scholar]
- [30].Zhang Z, An L, Hu W, et al. 3D-QSAR study of hallucinogenic phenylalkylamines by using CoMFA approach. J Comput Aided Mol Des. 2007;21(4):145–153. doi: 10.1007/s10822-006-9090-y. [DOI] [PubMed] [Google Scholar]
- [31].Pandya T, Chaturvedi SC. Structure-activity relationship study of some triazolinone based compounds with antagonistic balanced activity on angiotensin II receptor subtypes AT1 and AT2. A three-dimensional quantitative structure-activity relationship investigation. Arzneimittelforschung. 2005;55(5):265–270. doi: 10.1055/s-0031-1296855. [DOI] [PubMed] [Google Scholar]
- [32].Deininger MW, Goldman JM, Melo JV. The molecular biology of chronic myeloid leukemia. Blood. 2000;96(10):3343–3356. [PubMed] [Google Scholar]
- [33].Berellini G, Cruciani G, Mannhold R. Pharmacophore, drug metabolism, and pharmacokinetics models on non-peptide AT1, AT2, and AT1/AT2 angiotensin II receptor antagonists. J Med Chem. 2005;48(13):4389–4399. doi: 10.1021/jm049024x. [DOI] [PubMed] [Google Scholar]
- [34].Liu M, Liu XL, Wan P, et al. Determination of structure-activity relationships between fentanyl analogs and human μ-opioid receptors based on active binding site models. Neural Regen Res. 2011;6(4):267–276. [Google Scholar]
- [35].Liu M, Hu WX, Liu XL. Molecular docking and 3D-QSAR studies of 4-phenylpiperidine derivatives as μ-opioid agonists. Adv Mat Res. 2012;361-363:263–267. [Google Scholar]