Abstract
Background
A sedentary lifestyle is an independent risk factor for cardiovascular disease and exercise has been shown to ameliorate this risk. Inactivity is associated with a loss of muscle mass, which is also reversed with isometric exercise training. The relationship between muscle mass and vascular function is poorly defined. The aims of the current study were to determine whether increasing muscle mass by genetic deletion of myostatin, a negative regulator of muscle growth, can influence vascular function in mesenteric arteries from obese db/db mice.
Methods and Results
Myostatin expression was elevated in skeletal muscle of obese mice and associated with reduced muscle mass (30% to 50%). Myostatin deletion increased muscle mass in lean (40% to 60%) and obese (80% to 115%) mice through increased muscle fiber size (P<0.05). Myostatin deletion decreased adipose tissue in lean mice, but not obese mice. Markers of insulin resistance and glucose tolerance were improved in obese myostatin knockout mice. Obese mice demonstrated an impaired endothelial vasodilation, compared to lean mice. This impairment was improved by superoxide dismutase mimic Tempol. Deletion of myostatin improved endothelial vasodilation in mesenteric arteries in obese, but not in lean, mice. This improvement was blunted by nitric oxide (NO) synthase inhibitor l‐NG‐nitroarginine methyl ester (l‐NAME). Prostacyclin (PGI2)‐ and endothelium‐derived hyperpolarizing factor (EDHF)‐mediated vasodilation were preserved in obese mice and unaffected by myostatin deletion. Reactive oxygen species) was elevated in the mesenteric endothelium of obese mice and down‐regulated by deletion of myostatin in obese mice. Impaired vasodilation in obese mice was improved by NADPH oxidase inhibitor (GKT136901). Treatment with sepiapterin, which increases levels of tetrahydrobiopterin, improved vasodilation in obese mice, an improvement blocked by l‐NAME.
Conclusions
Increasing muscle mass by genetic deletion of myostatin improves NO‐, but not PGI2‐ or EDHF‐mediated vasodilation in obese mice; this vasodilation improvement is mediated by down‐regulation of superoxide.
Keywords: muscle mass, myostatin, NOX1, oxidant stress, tetrahydrobiopterin, vasodilation
Introduction
Obesity significantly reduces both metabolic and cardiovascular (CV) function, most notably inducing a state of insulin resistance (IR) in the former case1–3 and impeding endothelial control of vascular function in the latter.4–6 Endothelial dysfunction is generally thought to result from decreased bioavailability of nitric oxide (NO) and/or elevated levels of reactive oxygen species (ROS).7–8 Although impairment in vasomotor control in obesity has been well described, the mechanisms underpinning these defects are poorly understood and interventional therapies remain few.
Exercise is a powerful method to limit or improve obesity‐associated diseases. Clinical studies have shown that exercise can improve glucose disposal, glycated hemoglobin (HbA1C), and lipid profile in type 2 diabetic patients.9–10 CV function is also improved after exercise in obese patients.11–13 The beneficial effects of exercise are multifactorial and include increases in muscle mass, reduction in fat mass, and alterations in components of the plasma milieu.14 The relationships between the physiological changes induced by exercise and improvements in vascular function in the obese patient population are poorly defined.
Myostatin is a transforming growth factor‐beta superfamily member, primarily derived from skeletal muscle that negatively regulates muscle mass during fetal development and in adults.15–16 Genetic deletion of myostatin results in increased muscle mass in rodents, dogs, and humans.17–19 In contrast, obesity is associated with reduced muscle mass and elevated myostatin expression20–22 and correlates with increased CV disease (CVD) and all‐cause mortality.23–24 Skeletal muscle is the predominant site for insulin‐stimulated glucose disposal25–27 and myostatin inhibition is efficacious in ameliorating metabolic defects in obesity by improving insulin sensitivity.28–30 Deletion of genes that cause IR improves CV function in obese mice7 and genetic disruption of myostatin reduced aortic atheromatous lesions in nonobese Ldlr−/− mice.31 Based on these observations, we hypothesized that increasing muscle mass in obesity through inhibition of myostatin would confer CV benefits.
To test this hypothesis, we have created a novel animal model in which mice harbor a genetic deletion of myostatin at db/db background to produce muscular obese mice. Myostatin deletion was verified by expression profiling and multiple measures of muscle mass. Metabolic impact was assessed using glucose tolerance and plasma markers of the metabolic syndrome. Vascular function was assessed to vasoconstrictors and endothelium‐dependent and ‐independent vasodilators in the presence and absence of specific pharmacological agents. Oxidant load was determined by gene expression, immunohistochemical, and pharmacological blocker studies.
Methods
Animals
All experiments were conducted in accord with the National Institutes of Health (NIH) Guide for the Care and Use of Laboratory Animals and approved and monitored by the Georgia Regents University Institutional Animal Care and Use Committee (Augusta, GA). Two parental strains of male mice were used in these studies: leptin receptor mutant db/db mice bred on a C57/Bl6 background (#000697; The Jackson Laboratory, Bar Harbor, ME) and myostatin‐null mice bred on an Institute for Cancer Research background (gift of Dr Se‐Jin Lee). Because db/db mice are sterile, progeny were generated from dual heterozygotes (heterozygous for mutant leptin receptor and myostatin deletion). Mice heterozygous for each gene were used, and littermates served as controls to minimize any residual background effects from the founder strains.
Magnetic Resonance Imaging
Both muscle and adipose tissue magnetic resonance imaging (MRI) images were acquired using a 7.0T 20‐cm horizontal bore MRI spectrometer with a microimaging gradient (950 mT/m) and a 35‐mm‐volume coil set to 1H frequency. Muscle images were analyzed and acquired using a three‐dimensional fast imaging with steady‐state precession pulse sequence. Skeletal muscle images were as follows: acquisition matrix=250×250×200 pixels; field of view (FOV)=20×20×16 mm; echo time (TE)/repetition time (TR)=4.2/8.4 ms; slice thickness=0.08 mm; averages=15; and acquisition time=54 minutes 28 seconds. Abdominal images were analyzed and acquired using a rapid acquisition with relaxation enhancement pulse sequence: acquisition matrix=192×192; FOV=40 mm; TE/TR=56.0/2000 ms; slice thickness=1.0 mm; averages=1; and acquisition time=32 second.
Ex Vivo Microvessel Preparation
Second‐ or third‐order mesenteric arteries were cleared from connective tissue under an Olympus dissection scope (Olympus America, Center Valley, PA), and segments were mounted on 2 glass cannulas and secured with 10‐0 silk ophthalmic sutures in a small‐vessel arteriograph (Living Systems Instrumentation, Burlington, VT). By raising the pressure using Pressure Servo System PS/200 (Living Systems Instrumentation) to 10 mm Hg, vessels were flushed gently to remove blood cells. The distal cannula was closed off, and vessels were maintained at 60 mm Hg. Segments were placed in a chilled, oxygenated (21% O2, 5% CO2, and 74% N2) Krebs‐Ringer bicarbonate solution composed of (in mmol/L) 118.3 NaCl, 4.7 KCl, 2.5 CaCl2, 1.2 MgSO4, 1.2 KH2PO4, 25 NaHCO3, and 11.1 d‐glucose. A video camera mounted on a Nikon inverted light microscope (Nikon Inc., Melville, NY) connected to a Video Dimension Analyzer V94 (Living Systems Instrumentation) was used to monitor inner arteriolar diameters continuously. Waveform Recording Systems (DATAQ Instruments, Akron, OH) were connected to a Video Dimension Analyzer to acquire data. Buffer temperature was increased to 37°C using a Temperature Controller (Living Systems Instrumentation), and vessels were allowed to develop a spontaneous myogenic tone. After myogenic tone was developed and incubated with or without Tempol (10−3 mol/L), sepiapterin (10−6 mol/L), or l‐NG‐nitroarginine methyl ester (l‐NAME; 10−4 mol/L), vessel responses were observed with sequential doses of drugs: phenylephrine (PE; 10−9 to 10−4 mol/L); acetylcholine (ACh; 10−9 to 10−4 mol/L); and sodium nitroprusside (SNP; 10−9 to 10−4 mol/L). l‐NAME (10−4 mol/L), indomethacin (INN; 10−5 mol/L), and high K+ (35 mmol/L) were used to assess the contribution of NO, prostacyclin (PGI2) and endothelium‐derived hyperpolarizing factor (EDHF), respectively. The novel NOX1/NOX4 antagonist, GKT136901, was used to assess the effect of NADPH oxidase (NOX) in obesity and was provided by Dr Athanassios Giannis (University of Leipzig, Leipzig, Germany). Wall thickness, inner lumen diameter, wall‐to‐lumen ratio, and cross‐section area (CSA) were as previously described.32 Vasodilation was calculated as %=(vessel diameter−preconstriction diameter)/(passive diameter−preconstriction diameter).
Grip Strength Measurement
Muscle strength in mice was measured using the Animal Grip Strength System (San Diego Instruments, San Diego, CA). This system uses an electronic digital force gauge that measures the peak force exerted upon by the action of the mice. Forelimb grip strength was measured. The mouse was held by the tail and allowed to put its forepaws on the flat pull bar until it released the pull bar. Peak tension was recorded from the system.
Real‐Time Polymerase Chain Reaction
Mesenteric arteries were harvested and frozen in liquid nitrogen. Total RNA was extracted using TRIzol Plus RNA (Invitrogen, Carlsbad, CA), and cDNA was synthesized using the iScript cDNA Synthesis Kit (Bio‐Rad, Hercules, CA). cDNA was then used to assess relative gene expression. Primer sequences for the selected genes are described in Tables 1 and 2.
Table 1.
Primers Sequences That Were Used in the Genotyping
| Genes | Primer Sequences |
|---|---|
| db/db F | 5′‐CCCAACAGTCCATACAATATTAGAAGATTTTTACATTTTGA‐3′ |
| db/db R | 5′‐GTCCAAACTGAACTACATCAAACCTAC‐3′ |
| Myostatin wild type F | 5′‐AGAAGTCAAGGTGACAGACACAC‐3′ |
| Myostatin wild type R | 5′‐GGTGCACAAGATGAGTATGCGG‐3′ |
| Myostatin−/− F | 5′‐GGATCGGCCATTGAACAAGATG‐3′ |
| Myostatin−/− R | 5′‐GAGCAAGGTGAGATGACAGGAG‐3′ |
Table 2.
Primers Sequences That Were Used in Real‐Time PCR Procedure
| Genes | Primer Sequences |
|---|---|
| GAPDH F | 5′‐ACCCAGAAGACTGTGGATGG‐3′ |
| GAPDH R | 5′‐CACATTGGGGGTAGGAACAC‐3′ |
| Myostatin F | 5′‐CTGTAACCTTCCCAGGACCA‐3′ |
| Myostatin R | 5′‐TCTTTTGGGTGCGATAATCC‐3′ |
| eNOS F | 5′‐ACCCCCGGCGCTACGAAGAATG‐3′ |
| eNOS R | 5′‐GGTGGGCGCTGGGTGCTGAA‐3′ |
| AcvRIIB F | 5′‐TCAATTGCTACGACAGGCAG‐3′ |
| AcvRIIB R | 5′‐TGGCTCGTACGTGACTTCTG‐3′ |
eNOS indicates endothelial nitric oxide synthase; PCR, polymerase chain reaction.
Western Blotting
Aliquots of 40 μg of protein were separated on 10% SDS‐PAGE gel and transferred to nitrocellulose membranes. Membranes were incubated with anti‐Ser1177 endothelial nitric oxide synthase (eNOS; 1:1000; Cell Signaling, Danvers, MA) and anti‐NOX 1 (1:1000; GeneTex, Irvine, CA). Membranes were washed and then incubated with the appropriate secondary antibody (Ab). After washing with TBS‐T, the bands were visualized using Pierce ECL Western Blotting Substrate chemiluminescence (Pierce, Indianapolis, IN) and HyBlot CL film (Denville, Scientific Inc., Metuchen, NJ). Membranes were stripped and then washed with TBS‐T and reblocked with 5% skim milk before reprobing with the following Abs: anti‐eNOS (1:1000; BD Transduction Laboratories, San Jose, CA), anti‐GAPDH (1:10 000; Ambion, Austin, TX); and the appropriate secondary Ab.
Confocal Microscopy of NOX1 and Superoxide
Mesenteric arteries were isolated, fixed with formalin, and then embedded in paraffin. Paraffin slides were double stained using Abs against NOX1 (1:100; Sigma‐Aldrich, St. Louis, MO) or 8‐hydroxyguanosine (8‐OHG; 1:150; Sigma‐Aldrich) and α‐actin (1:700; Sigma‐Aldrich) as well as secondary Abs, including goat anti‐rabbit 488 (1:500; (NOX1; Invitrogen) and goat anti‐mouse 594 (1:500; α‐actin; Invitrogen).
Intraperitoneal Glucose Tolerance Test
Mice were fasted overnight and then injected with 0.5 mg of glucose/g body weight (intraperitoneally). The blood was sampled (through the tail vein) for glucose determinations every 10 minutes for 150 minutes. At the end of the glucose tolerance test (GTT), mice were returned to cages and allowed free access to food. Blood glucose levels were determined using a glucometer (AlphaTRAK; Abbott Laboratories, Abbott Park, IL).
Hematoxylin and Eosin
Muscle and adipose tissue was fixed in 4% formaldehyde solution (pH 7.0). Tissues were processed routinely for paraffin embedding, and 5‐μm‐thick sections were cut and placed on glass slides. Tissue samples were then stained with hematoxylin and eosin (H&E). A total of 8 sections in each group, each section randomly selected 5 fields and was photographed counting the size of cells.
Statistical Analysis
All data are reported as means±SEM, with “n” representing the number of mice used in each of the experimental groups. Concentration‐response curves from isolated mesenteric arteries (Figures 7 and 8) were computer fitted to a sigmoidal curve using nonlinear regression (Prism version 5.0; GraphPad Software Inc., San Diego, CA). Maximum vessel relaxation to agonists (Figures 7D, 10A, 11D, and 12A) was measured as a percentage of preconstriction to PE and was analyzed using a multivariable regression analysis in NCSS software (NCSS, LLC, Kaysville, UT). Figure 1A was analyzed using a 1‐way ANOVA and Tukey's multiple comparisons to test myostatin mRNA level difference among different tissues. In Figure 8A through 8D, results were ranked and a 2‐way ANOVA was performed on the ranks. There were 3‐full‐model repeated‐measures analyses. All 3 used the same 2 between factors, which were factor 1 (lean versus obese) and factor 2 (with versus without myostation). For GTT results (Figure 6), the within factor was time. For vessel response curves (Figure 7), the one within factor was different doses ranging from 10−9 to 10−4 mol/L. For the passive mechanical measurements (Figure 13), within factor was pressure. All 3 full‐model repeated‐measures ANOVA were performed using the NCSS software. All remaining experiments were analyzed using a 2‐way ANOVA with Bonferroni's multiple comparisons test. The 2 factors in the 2‐way ANOVA was factor 1 (lean versus obese) and factor 2 (with versus without myostation). Figure 8A through 8D was analyzed using nonparametric repeated measurement. For all analyses, statistical significance was accepted at P<0.05.
Figure 7.
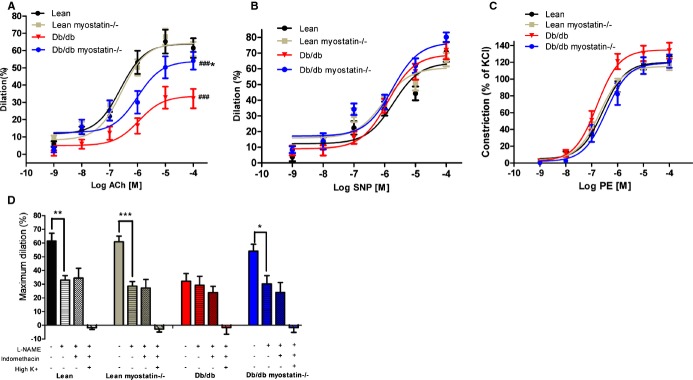
Endothelium‐dependent vasodilation was improved by deletion of myostatin in obese mice. A, Obese mice demonstrated a significant drop in acetylcholine‐induced dilation, which was improved by deletion of myostatin. B, Endothelium‐independent vasodilation response to SNP (B) and vasoconstriction to PE (C) were similar among all 4 groups of mice. D, Deletion of myostatin in obese mice improved nitric oxide–mediated dilation, which is blocked by l‐NAME. PGI2‐ and EDHF‐mediated dilation were measured in the presence of l‐NAME+indomethacin and l‐NAME+indomethacin+high K+. *P<0.05; **P<0.01; ***P<0.001, lean myostatin−/− versus lean or db/db myostatin−/− versus db/db; #P<0.05, ##P<0.01; ###P<0.001, db/db versus lean or db/db myostatin−/− versus lean myostatin−/−. A through D, n>6. Symbols represent the results from repeated measures by using NCSS software (NCSS, LLC, Kaysville, UT). The data are given as the mean±SEM. db/db myostatin−/− indicates mice lacking both myostatin and leptin receptor; db/db, obese leptin receptor‐deficient mice heterozygous for myostastin; EDHF, endothelium‐derived hyperpolarizing factor; lean myostatin−/−, myostatin‐null mice heterozygous for leptin receptors; lean, lean dual heterozygotes; l‐NAME, Nω‐nitro‐l‐arginine methyl ester; PE, phenylephrine; PGI2, prostacyclin; SNP, sodium nitroprusside.
Figure 8.
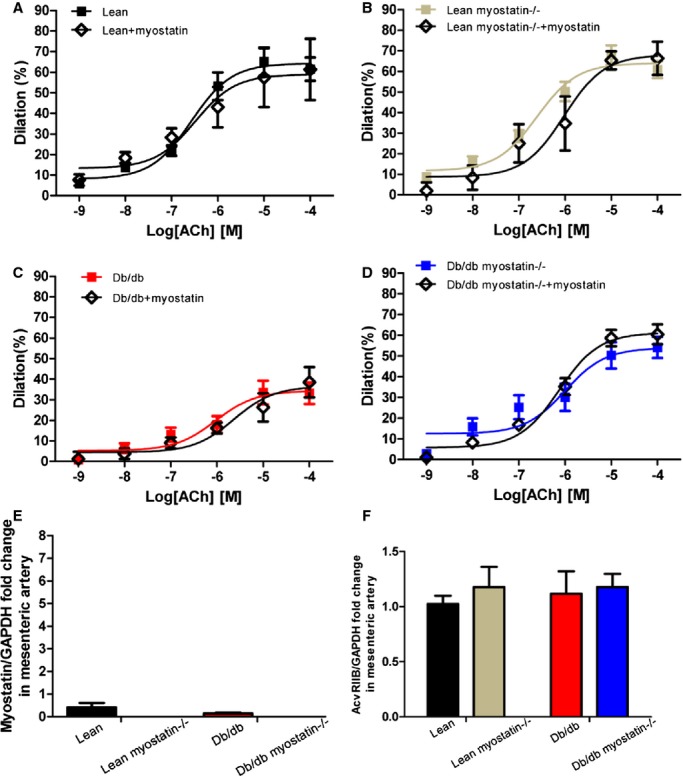
Myostatin has no direct effect on vasculature. A through D, Myostatin incubation has no effect on vasodilation in mesenteric arteries of all genotypes. Concentration‐response curves to acetylcholine were performed in mesenteric arteries from lean, lean myostatin−/−, db/db, and db/db myostatin−/− mice in the absence (■) or in the presence (◊) of myostatin (20 ng/mL for 30 minutes). E, Myostatin mRNA expression in mesenteric artery of all 4 genotypes. F, AcvRIIB mRNA expression in mesenteric artery of all 4 genotypes. Data are shown as mean±SEM (A through D: n=3 to 8; E and F: n=6). db/db myostatin−/− indicates mice lacking both myostatin and leptin receptor; db/db, obese leptin receptor‐deficient mice heterozygous for myostastin; lean myostatin−/−, myostatin‐null mice heterozygous for leptin receptors; lean, lean dual heterozygotes.
Figure 10.
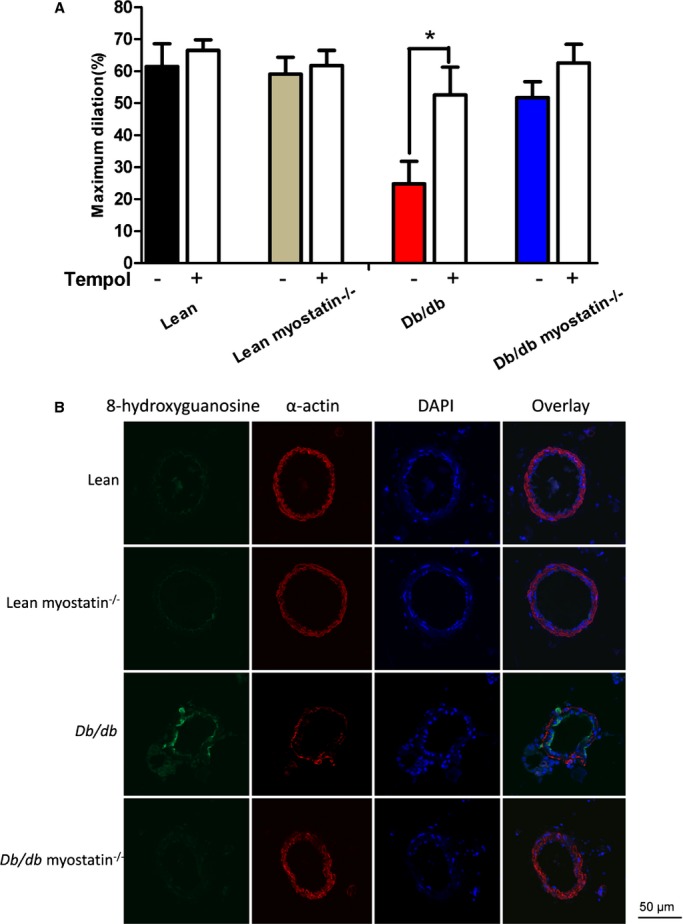
Elevated oxidant load in the endothelium of obese db/db mice is reduced with increases in muscle mass. A, Superoxide scavenging by Tempol produced an improvement of acetylcholine‐induced dilation in obese mice. *P<0.05, in the absence of Tempol (−) versus in the presence of Tempol (+). B, Oxidized DNA marker 8‐OHG is elevated in the endothelium of obese db/db mice and reduced by deletion of myostatin. The data are given as the mean±SEM (A and B: n=6 to 8). 8‐OHG indicates 8‐hydroxyguanosine; DAPI, 4’,6‐diamidino‐2‐phenylindole; db/db myostatin−/−, mice lacking both myostatin and leptin receptor; db/db, obese leptin receptor‐deficient mice heterozygous for myostastin; lean myostatin−/−, myostatin‐null mice heterozygous for leptin receptors; lean, lean dual heterozygotes.
Figure 11.
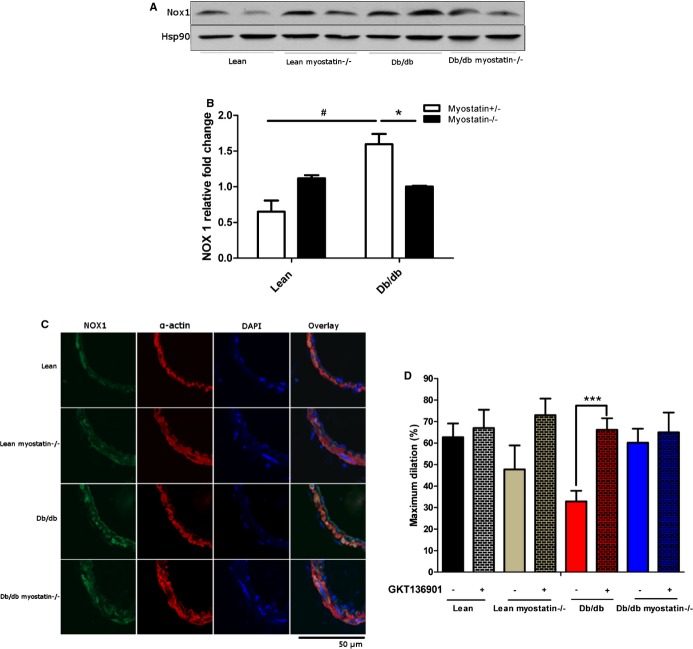
NADPH oxidase 1 expression and NADPH oxidase 1 inhibition improved vasodilation in obese mice. A, Representative blot of expression of NOX 1 in mesenteric arteries determined by Western blot with Hsp90 was used as a loading control. B, Quantification of NOX1 protein expression by 1‐way ANOVA. C, Confocal microscopy assessed localization of NOX1 in mesenteric arteries. D, Inhibition of NOX by GKT136901 restored impaired vasodilation in db/db mice. B, *P<0.05, lean versus lean myostatin−/− or db/db versus db/db myostatin−/−; #P<0.05, lean versus db/db or lean myostatin−/− versus db/db myostatin−/−. D, ***P<0.001, Vessels incubated with GKT 136901 versus vessels incubated without GKT136901. The data are given as the mean±SEM (A through D: n=6 to 8). ANOVA indicates analysis of variance; db/db myostatin−/−, mice lacking both myostatin and leptin receptor; db/db, obese leptin receptor‐deficient mice heterozygous for myostastin; lean myostatin−/−, myostatin‐null mice heterozygous for leptin receptors; lean, lean dual heterozygotes; NADPH, nicotinamide adenine dinucleotide phosphate; NOX, NADPH oxidase 1.
Figure 12.
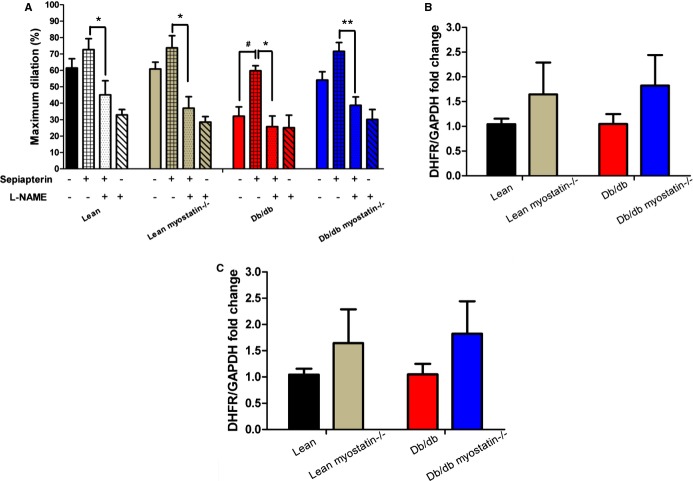
BH4 supplementation or superoxide scavenging improved vasodilation in obese mice. A, BH4 precursor sepiapterin preincubation improved acetylcholine‐induced dilation in obese mice. This improvement was blocked by l‐NAME. B, DHFR mRNA expression in mesenteric artery. C, GCH1 mRNA expression in mesenteric artery. Relative gene expression levels were quantified using the 2‐ΔΔCt approximation method. Gene expression was normalized twice to a control sample that was additionally normalized to GAPDH. The data are given as the mean±SEM. A through C, n≥6. #P<0.05, vessels incubated with versus without sepiapterin; *P<0.05; **P<0.01, vessels incubated with sepiapterin versus vessels incubated sepiapterin and l‐NAME. BH4 indicates tetrahydrobiopterin; db/db myostatin−/−, mice lacking both myostatin and leptin receptor; db/db, obese leptin receptor‐deficient mice heterozygous for myostastin; DHFR, dihydrofolate reductase; GCH1, GTP cyclohydrolase I; lean myostatin−/−, myostatin‐null mice heterozygous for leptin receptors; lean, lean dual heterozygotes; l‐NAME, Nω‐nitro‐l‐arginine methyl ester.
Figure 1.
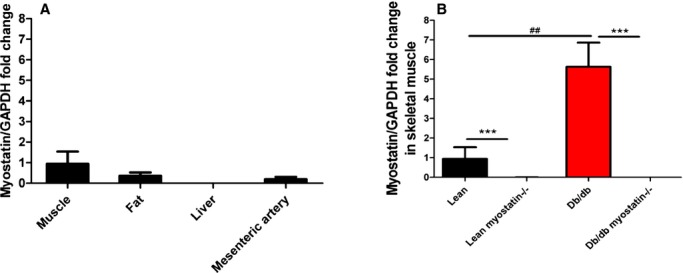
Myostatin expression was assessed by real‐time PCR. A, Myostsatin mRNA expression in different tissues of lean mice (n=6). B, Myostsatin mRNA expression in skeletal muclse of lean, lean myostatin−/−, db/db, and db/db myostatin−/− mice (n=8). A and B, Relative gene expression levels were quantified using the 2‐ΔΔCt approximation method. Gene expression was normalized twice to a control sample that was additionally normalized to GAPDH. Data are shown as mean±SEM. ***P<0.001, lean myostatin−/− versus lean or db/db myostatin−/− versus db/db. ##P<0.01, db/db versus lean or db/db myostatin−/− versus lean myostatin−/−. db/db myostatin−/− indicates mice lacking both myostatin and leptin receptor; db/db, obese leptin receptor‐deficient mice heterozygous for myostastin; lean myostatin−/−, myostatin‐null mice heterozygous for leptin receptors; lean, lean dual heterozygotes; PCR, polymerase chain reaction.
Figure 6.
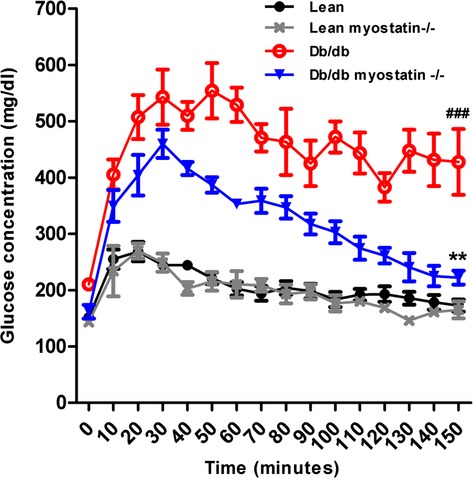
Glucose tolerance test of all groups of male mice. Symbols represent the results from repeated measures by using NCSS software (NCSS, LLC, Kaysville, UT). **P<0.01, lean myostatin−/− versus lean or db/db myostatin−/− versus db/db; ###P<0.001, db/db versus lean or db/db myostatin−/− versus lean myostatin−/−. Data are shown as mean±SEM (n=4). db/db myostatin−/− indicates mice lacking both myostatin and leptin receptor; db/db, obese leptin receptor‐deficient mice heterozygous for myostastin; lean myostatin−/−, myostatin‐null mice heterozygous for leptin receptors; lean, lean dual heterozygotes.
Figure 13.
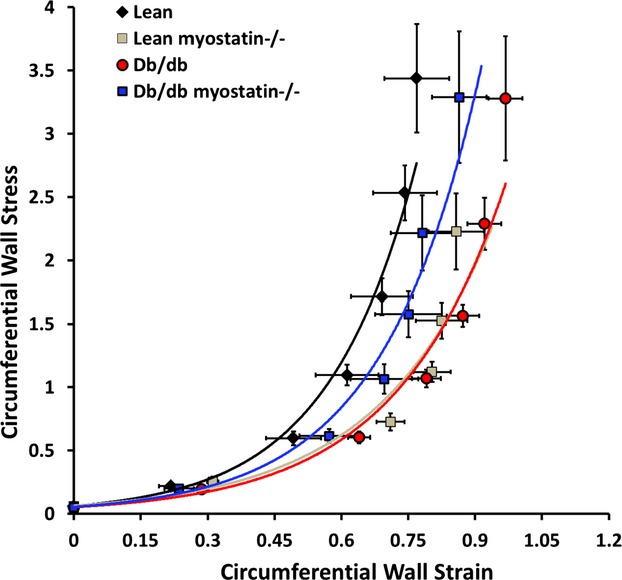
Passive mechanical data of all 4 groups of mice. Circumferential wall stress and circumferential wall strain were similar in all genotypes. Data are shown as mean±SEM (n>8). db/db myostatin−/− indicates mice lacking both myostatin and leptin receptor; db/db, obese leptin receptor‐deficient mice heterozygous for myostastin; lean myostatin−/−, myostatin‐null mice heterozygous for leptin receptors; lean, lean dual heterozygotes.
Results
Myostatin Expression
Expression of myostatin, as assessed by real‐time polymerase chain reaction (PCR) in tissue from normal lean mice is shown in Figure 1A. Myostatin expression shows the well‐known concentration in striated muscle with other metabolic sites (fat and liver) and the target tissue for this study (mesenteric microvessels) showing little expression. As shown in Figure 1B, myostatin is markedly up‐regulated in skeletal muscle in obese, but is essentially absent in both lean and obese, knockouts (KOs), verifying the efficacy of the genetic deletion in these studies.
Morphometric Phenotype
Figure 2A depicts adult body weight in all 4 genotypes at the time of experimentation. db/db mice were markedly obese, consistent with mutation of the leptin receptor. Deletion of myostatin had no significant effect on adult body weight or the pattern of body‐weight gain (Figure 2B).
Figure 2.
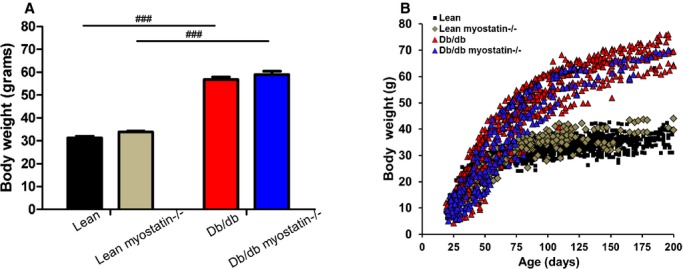
Body weight was not changed by myoststin deletion. A, Body weight of all 4 groups of genotype at the time of experiment. Twenty‐week‐old male mice were used for measurement. B, Growth curve of all the genotypes. Deletion of myostatin did not have an effect on body weight or weight gain in either lean or obese db/db mice. A and B, Data are shown as mean±SEM (n=8). ###P<0.001, db/db versus lean or db/db myostatin−/− versus lean myostatin−/−. db/db myostatin−/− indicates mice lacking both myostatin and leptin receptor; db/db, obese leptin receptor‐deficient mice heterozygous for myostastin; lean myostatin−/−, myostatin null mice heterozygous for leptin receptors; lean, lean dual heterozygotes.
The effect of myostatin on muscle mass is depicted in Figure 3 in a number of ways. In Figure 3A, lower‐limb muscles from cadaver mice are shown for the purpose of illustration. Limb mass was observably larger after myostatin deletion than those of lean and obese control mice. Figure 3B shows the axial T1‐weighted cross‐section of the lower‐limb muscles by MRI in anesthetized mice. Obese mice showed a decreased cross‐section area of lower‐limb muscles, whereas deletion of myostatin increased muscles in both lean and obese mice. For Figure 3D, individual muscles were dissected free and weighed for quantitative assessment. Deletion of myostatin significantly increased tibialis anterior (TA) in both lean and db/db mice, essentially restoring obese muscle mass back to lean levels. Similar results were observed in the gastrocnemius (GS), gluteal, and triceps muscles (Table 3). To determine the anatomic basis of increased muscle mass, TA muscle fiber size was assessed histologically with H&E‐stained cryosections (representative examples in Figure 3C) as well as as box and whisker plots comprising minimum, median, and maximum value for muscle fiber diameter (Figure 3E). Obese mice showed decreased TA muscle fiber size, compared to lean mice (28.52±0.25 vs. 43.29±1.01 μm; P<0.05), deletion of myostatin increased TA muscle fiber size in both lean and db/db mice (lean myostatin−/−: 50.06±1.02 μm; db/db myostatin−/−: 46.08±0.96 μm; P<0.05).
Figure 3.
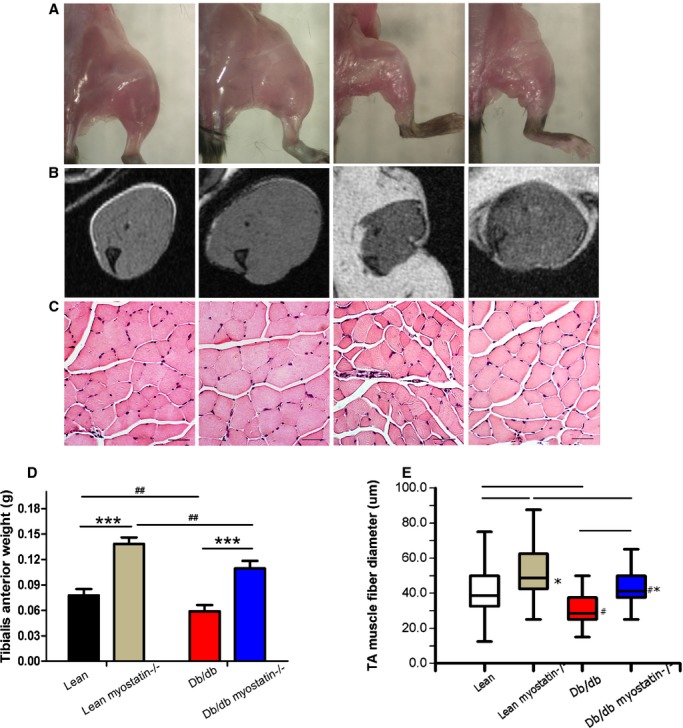
The myostatin gene significantly increased muscle mass in both lean and obese (db/db) mice. A, Increased skeletal muscle mass by deletion of myostatin in both lean and obese (db/db) mice. B, Axial leg MRI scans. Muscle is shown in gray; adipose tissue is shown in white. C, Sections of distal hindlimbs (TA muscle) stained with hematoxylin and eosin (×200); bars represent 50 μm. A through C, left to right: lean, lean myostatin−/−, db/db, and db/db myostatin−/−. D, Tibialis anterior muscle weight of all groups of mice. E, Tibialis anterior myofiber diameter. Data reported here as representative hematoxylin and eosin–stained cryosections, and as box and whisker plots comprising minimum, median, and maximum value for myofiber diameter. Data are shown as mean±SEM (A through E: n=8). *P<0.05; ***P<0.001, lean myostatin−/− versus lean or db/db myostatin−/− versus db/db. #P<0.05; ##P<0.01, db/db versus lean or db/db myostatin−/− versus lean myostatin−/−. db/db myostatin−/− indicates mice lacking both myostatin and leptin receptor; db/db, obese leptin receptor‐deficient mice heterozygous for myostastin; lean myostatin−/−, myostatin‐null mice heterozygous for leptin receptors; lean, lean dual heterozygotes; MRI, magnetic resonance imaging; TA, tibialis anterior.
Table 3.
Organ Weights and Body Length for All 4 Genotypes
| Lean | Lean Myostatin−/− | db/db | db/db Myostatin−/− | |
|---|---|---|---|---|
| Heart weight, g | 0.158±0.004 | 0.148±0.003 | 0.172±0.005### | 0.156±0.004* |
| Liver weight, g | 1.274±0.044 | 1.230±0.045* | 4.103±0.210### | 3.061±0.299###*** |
| Kidney weight, g | 0.406±0.015 | 0.349±0.008 | 0.496±0.023### | 0.448±0.023###* |
| Intestine weight, g | 2.115±0.125 | 1.822±0.113 | 3.780±0.158### | 2.465±0.214#** |
| Body length, cm | 16.73±0.31 | 16.56±0.76 | 16.64±0.27 | 16.42±0.62 |
| Gastrocnemius, g | 0.212±0.015 | 0.335±0.023*** | 0.139±0.009### | 0.250±0.015##*** |
| Gluteus maximus, g | 0.248±0.017 | 0.399±0.021*** | 0.131±0.008### | 0.277±0.027###*** |
| Triceps, g | 0.193±0.026 | 0.304±0.029** | 0.117±0.011# | 0.238±0.026** |
Data are shown as mean±SEM (n=8). db/db myostatin−/− indicates mice lacking both myostatin and leptin receptor; db/db, obese leptin receptor‐deficient mice heterozygous for myostastin; lean myostatin−/−, myostatin‐null mice heterozygous for leptin receptors; lean, lean dual heterozygotes.
*P<0.05; **P<0.01; ***P<0.001, lean myostatin−/− versus lean or db/db myostatin−/− versus db/db. #P<0.05; ##P<0.01; ###P<0.001, db/db versus lean or db/db myostatin−/− versus lean myostatin−/−.
To determine whether myostatin deletion increases functional as well as physical muscle mass, experiments were performed to assess the strength of myostatin KO mice. Consistent with skeletal muscle phenotype, the peak forelimb grip force of db/db mice was smaller, compared to lean mice (P<0.001), whereas deletion of myostatin in both lean and db/db mice increased peak forelimb grip force (Figure 4; P<0.01, lean vs. lean myostatin−/−; P<0.001, db/db vs. db/db myostatin−/−). It indicates that myostatin deletion not only increases muscle mass, but also improves muscle strength.
Figure 4.
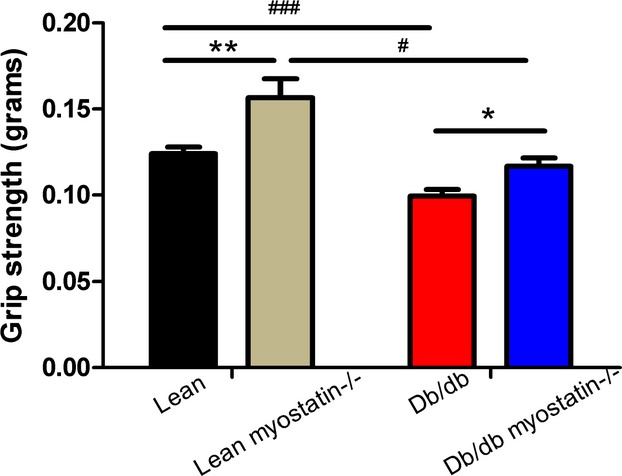
Forelimb grip strength of all groups of mice (n=5 to 10). *P<0.05; **P<0.01, lean myostatin−/− versus lean or db/db myostatin−/− versus db/db; #P<0.05; ###P<0.001, db/db versus lean or db/db myostatin−/− versus lean myostatin−/−. Data are shown as mean±SEM. db/db myostatin−/− indicates mice lacking both myostatin and leptin receptor; db/db, obese leptin receptor‐deficient mice heterozygous for myostastin; lean myostatin−/−, myostatin‐null mice heterozygous for leptin receptors; lean, lean dual heterozygotes.
The effect of myostatin on fat mass was examined in a similar fashion as muscle mass. Abdominal axial T1‐weighted cross‐section of all groups of mice is shown for illustrative purposes in Figure 5A. Myostatin deletion in lean mice caused a modest reduction of adipose tissue, but it had no significant effect in obese mice, indicating that whatever drives myostatin's effect in lean mice requires functional leptin signaling. Adipose tissue size was assessed histologically with H&E‐stained cryosections (Figure 5B). Visceral adipose tissue weight from each mouse genotype is shown in Figure 5C. Quantification showed that deletion of myostatin produced modest decreases in adipose tissue of lean myostatin−/−, as shown in MRI images, but db/db myostatin−/− mice remain markedly obese. Quantification of H&E staining is shown as box and whisker plots of adipocyte size (Figure 5D). Adipocytes from fat pad of obese mice were found to be of a significantly larger size (90.92±3.26 μm) than those from lean mice (50.37±1.68 μm). Myostatin deletion decreased adipocytes size (37.45±1.17 μm) in lean mice, but it had no significant effect on obese mice adipocyte size (86.59±2.44 μm; Figure 5D). Lean myostatin−/− mice had modest reduction in plasma leptin levels versus lean mice, which is consistent with reduction of adipose tissue in lean myostatin−/− mice. In obese mice, plasma leptin levels along with body weight were markedly increased and were not significantly affected by deletion of myostatin (Table 4). As shown in Table 3, deletion of myostatin produced modest reductions in visceral organ weights, explaining why significant increases in muscle mass do not greatly increase body weight, despite persistent fat mass.
Figure 5.
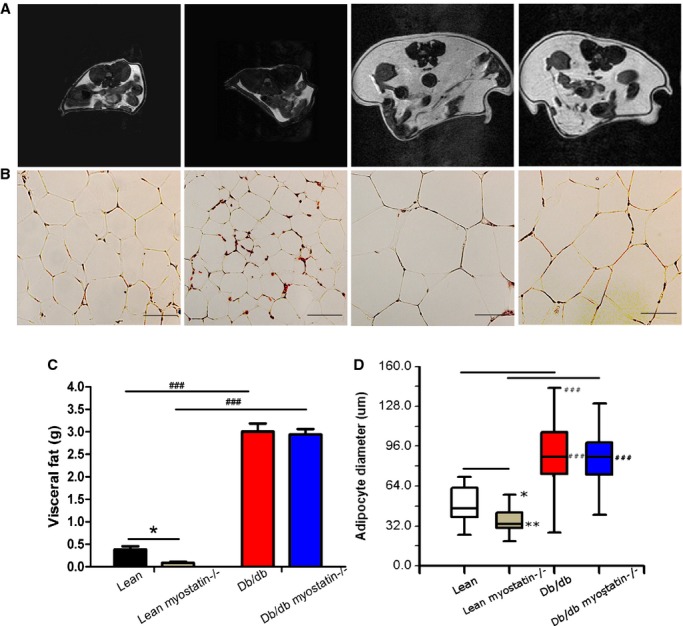
Deletion of myostatin reduces fat mass in lean, but not obese, mice. A, Abdominal axial T1‐weighted cross‐section of MRI scan; adipose tissue is shown in white (n=3). B, Hematoxylin and eosin (H&E) staining for visceral fat (×200); bars represent 50 μm. A and B, From left to right: lean, lean myostatin−/−, db/db, and db/db myostatin−/− (n≥8). C, Visceral fat weight of all the genotypes (n≥8). D, Quantification of representative H&E‐stained cryosections, presenting as box‐and‐whisker plots comprising minimum, median, and maximum value for adipocytes diameter (n≥8). *P<0.05; **P<0.01, lean myostatin−/− versus lean or db/db myostatin−/− versus db/db; ###P<0.001; db/db versus lean or db/db myostatin−/− versus lean myostatin−/−. Data are shown as mean±SEM. db/db myostatin−/− indicates mice lacking both myostatin and leptin receptor; db/db, obese leptin receptor‐deficient mice heterozygous for myostastin; lean myostatin−/−, myostatin‐null mice heterozygous for leptin receptors; lean, lean dual heterozygotes; MRI, magnetic resonance imaging.
Table 4.
Metabolic Parameters
| Lean | Lean Myostatin−/− | db/db | db/db Myostatin−/− | |
|---|---|---|---|---|
| Fasting glucose, mg/dL | 158.47±5.80 | 135.44±4.39* | 244.37±29.84### | 180.19±18.89##* |
| HbA1c, % | 4.63±0.06 | 4.46±0.05 | 8.32±0.30### | 6.77±0.24###*** |
| Cholesterol, mg/dL | 58.35±4.91 | 52.99±6.39 | 133.05±12.79### | 93.31±8.67###** |
| Triglyceride, mg/dL | 44.34±7.37 | 30.73±2.80 | 44.24±6.34 | 40.95±7.06 |
| NEFA, mEq/mL | 0.33±0.04 | 0.42±0.05 | 1.07±0.14### | 1.05±0.16### |
| Leptin, pg/mL | 3101.26±633.09 | 644.38±136.99* | 11 842.66±1031.30### | 9528.70±1011.70### |
| Insulin, ng/mL | 0.17±0.05 | 0.07±0.04 | 1.16±0.15# | 3.07±0.30# |
| Food intake, g | 2.67±0.35 | 2.06±0.46 | 4.02±0.74 | 4.42±0.71 |
| Water intake, g | 3.06±0.30 | 2.74±0.46 | 5.06±1.49 | 4.04±0.73 |
Data are shown as mean±SEM (n=8). db/db myostatin−/− indicates mice lacking both myostatin and leptin receptor; db/db, obese leptin receptor‐deficient mice heterozygous for myostastin; lean myostatin−/−, myostatin‐null mice heterozygous for leptin receptors; lean, lean dual heterozygotes.
*P<0.05; **P<0.01; ***P<0.001, lean myostatin−/− versus lean or db/db myostatin−/− versus db/db. #P<0.05; ##P<0.01; ###P<0.001, db/db versus lean or db/db myostatin−/− versus lean myostatin−/−.
Taken together, these data indicate that deletion of myostatin increases muscle mass without significantly affecting adiposity in obese mice, and thus differences in vascular function between myostatin‐intact and depleted mice cannot be attributed to simple weight loss.
Metabolic Phenotype
The effects of myostatin deletion on fasting glucose levels are shown in Table 4. Fasting blood glucose was significantly elevated in obese mice, compared to lean mice. Myostatin deletion in both lean and obese mice reduced fasting glucose, suggesting an increased muscle uptake of glucose, whereas fasting insulin level remained elevated in obese mice, indicative of persistant hepatic IR7 (Table 4). Glucose tolerance was measured by clearance of an intraperitoneal bolus, as shown in Figure 6. Lean mice displayed rapid glucose disposal, and clearance of glucose in lean myostatin−/− mice was similar, showing no effect of larger muscle mass on whole‐body glucose tolerance. Obese mice showed impaired glucose tolerance (P<0.001), and myostatin deletion in obese mice improved glucose tolerance significantly (P<0.01).
As an index of long‐term glycemic control, HbA1c levels are shown in Table 4. Both lean and lean myostatin−/− mice showed HbA1c levels <5%, suggesting euglycemic control. Obese mice displayed higher levels of HbA1c (P<0.001), which is consistent with hyperglycemia and impaired glucose tolerance. Although not completely normalized, HbA1c levels were significantly improved by deletion of myostatin in obese mice (P<0.001). Taken together, these data indicate that deletion of myostatin improves glucose control in obese mice.
Fasting lipid parameters are also shown in Table 4. Myostatin deletion has no effect on nonesterified fatty acids (NEFAs), triglycerides (TGs), and cholesterol levels in lean mice. Obese mice displayed significant increased NEFA and cholesterol levels, compared to lean mice (P<0.001). Deletion of myostatin decreased cholesterol level in obese mice (P<0.01), but had no significant effect on NEFAs or TGs.
To determine the effects of obesity and myostatin on food and water intake, animals were maintained in metabolic cages for 72 hours. Deletion of myostatin had no effect on either food or water consumption, but obesity markedly increased both, consistent with the dysfunctional leptin receptor in db/db mice. Deletion of myostatin in obese mice had no effect on either food or water consumption.
Vascular Function
To determine whether deletion of myostatin improves endothelium‐dependent vasodilation, we measured ACh (10−9 to 10−4 mol/L)‐induced vasodilation in mesenteric arteries, which is shown in Figure 7A. Mesenteric arteries from obese mice showed impaired vasodilation, whereas deletion of myostatin in obese mice improved this impairment (P<0.01 myostatin+/− vs. myostatin−/−; P<0.001 lean versus db/db). Obese mice displayed decreased maximum dilation to Ach, compared to lean values (33±5% vs. 61±6%, respectively; n≥8; P=0.002; Figure 3D). Deletion of myostatin in obese mice improved ACh‐induced maximum dilation, compared to obese mice (54±5% vs. 33±5%, respectively; n≥8; P<0.05), suggesting that deletion of myostatin improves endothelium‐dependent vasodilation in obesity. ACh‐induced vasodilation in the lean myostatin−/− group was similar to the lean group, suggesting that myostatin has no direct effect on endothelium‐dependent vasodilation. In contrast, endothelium‐independent vasodilator responses to SNP (Figure 7B) and vasoconstrictor responses to PE (Figure 7C) were similar in lean and obese mice, whether myostatin was deleted or not.
To determine whether endothelium‐dependent vasodilation improvement by myostatin deletion in obese mice is mainly mediated by NO, l‐NAME (10−4 mol/L), an inhibitor of NO synthesis, was preincubated (30 minutes) before ACh‐induced (10−4 mol/L) vasodilation measurement. Improved vasodilation caused by deletion of myostatin in obese mice was blunted by l‐NAME (Figure 7D), and in the presence of l‐NAME, responses to ACh were similar. Because endothelial‐dependent dilation is similar among groups in the absence of NO, the difference between groups must reflect differences in NO. Blockade of cyclooxygenase with INN caused no further reduction in vasodilation in any group, and inhibition of EDHF with high concentration of K+ (35 mmol/L) abolished dilation in all groups, indicating that residual l‐NAME‐resistant dilation was mediated by EDHF. Taken together, these data indicate that NO‐mediated vasodilation is specifically impaired by obesity and improved by deletion of myostatin in obese mice.
To exclude the possibility that myostatin has a direct effect on vasculature, we measured ACh‐induced vasodilation with the presence of myostatin (20 ng/mL). Pretreatment with myostatin did not affect vasodilation response in all 4 groups of mice (Figure 8A through 8D). It is shown that relative to other tissues, myostatin expression in the vasculature is relatively low. Myostatin (Figure 8E) and activin receptor IIb (AcvRIIB; Figure 8F) mRNA expression in the mesenteric arteries was assessed. Neither the level of AcvRIIB nor myostatin were affected by obesity. Myostatin expression was not detected in vascular tissues of KO mice, consistent with an effective KO. These results suggested that deletion of myostatin improves endothelium‐dependent vasodilation through indirect mechanisms.
Mechanisms of Vascular Dysfunction
To determine the role of eNOS in the observed results, eNOS expression was determined by Western blotting. As shown in Figure 9, total eNOS protein expression was elevated in obesity and partially normalized with myostatin deletion. The increased eNOS was likely a compensation for another deficit that was normalized by myostatin deletion (ie, superoxide). Phosphorylation state of eNOS was assessed with Abs to serine 1177 of eNOS. There was no effect of either obesity or myostatin deletion on eNOS phosphorylation expression.
Figure 9.
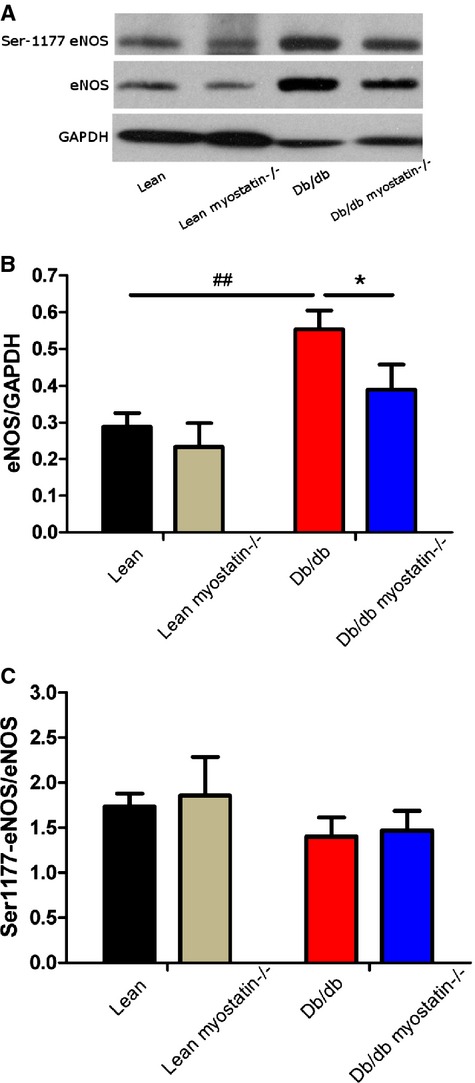
eNOS expression in db/db mice was not decreased, compared to lean mice. A, Representative blot of phosphorylation of eNOS at Ser1177 and eNOS expression in mesenteric arteries. B and C, Quantification of eNOS (normalized to GAPDH) and phosphorylation of eNOS (normalized to total NOS) protein expression. Results are presented as mean±SEM. A through C, n>6; *P<0.05, db/db versus db/db myostatin−/−; ##P<0.01, lean versus db/db. db/db myostatin−/− indicates mice lacking both myostatin and leptin receptor; db/db, obese leptin receptor‐deficient mice heterozygous for myostastin; eNOS, endothelial nitric oxide synthase; lean myostatin−/−, myostatin‐null mice heterozygous for leptin receptors; lean, lean dual heterozygotes.
To determine whether elevated superoxide production was a mechanism of impaired vasodilation in obese mice, vascular function was assessed in the presence of a superoxide dismutase mimetic, Tempol (10−3 mol/L). Tempol improved impaired ACh‐induced vasodilation in obese mice (peak responses in Figure 10A) with no significant effect on lean mice. To localize superoxide production, the oxidized base, 8‐OHG, a marker of oxidative damage in DNA/RNA, was assessed in mesenteric arteries by confocal microscopy (CFM). High levels of 8‐OHG (indicated in green) were only evidenced in mesenteric arteries from obese mice with intact myostatin (Figure 11B). Lean mice or mice lacking myostatin had little to no staining.
NOX1 is considered a major source of oxidant tone in the vasculature and thus its expression was assessed to explore the source of superoxide. Western blotting showed that NOX1 protein level was elevated in obese mice and modestly decreased in the myostatin KO group (Figure 11A). Using CFM, NOX1 was identified in both endothelium and smooth muscle cells in all groups of mice. However, NOX1 was noticeably increased in mesenteric arteries of obese mice and reduced by deletion of myostatin (Figure 11B). The NOX1/4 inhibitor, GKT136901 (1 μmol/L), restored impaired endothelial‐dependent vasodilation in obese mice and did not change vessel dilation in obese myostatin−/− mice, indicating that myostatin deletion improved endothelial function by down‐regulation of elevated NOX1 in obese mice (Figure 11C). Taken together, these results suggest that elevation of NOX1‐mediated ROS production triggers endothelial dysfunction, which is restored by deletion of myostatin.
Superoxide contributes to deterioration of endothelial function by degrading tetrahydrobopterin (BH4), an NOS cofactor. To assess whether BH4 level was limiting, ACh‐induced vasodilation responses were obtained before and after administration of BH4 precursor sepiapterin (10−6 mol/L), which is converted intracellularly by a salvage pathway to BH4. Administration of sepiapterin enhanced vasodilation in mesenteric arteries of obese mice (Figure 12A), but it did not affect vessel responses of other groups significantly. l‐NAME equalized dilation among groups, indicating that improvements observed with sepiapterin are mediated by NO. Expression of GTP cyclohydrolase I (GCH1), the rate‐limiting enzyme in de novo BH4 biosynthesis and dihydrofolate reductase, the enzyme that regenerates BH4 to BH2 in a salvage pathway, were assessed by real‐time PCR. No significant difference was found among all the genotypes (Figure 12B and 12C).
Small mesenteric artery vascular structure and mechanics were assessed in a Ca2+‐free Krebs solution, and results are shown in Figure 13 and Table 5. Maximal vessel wall thickness and vessel wall/lumen ratio (150 mm Hg of intraluminal pressure) were similar in all genotypes. Inner lumen diameter and CSA of obese mice were significantly increased, compared to lean mice (P<0.01). Myostatin deletion decreased inner lumen diameter and cross‐section area of mesenteric arteries in obese mice (P<0.001). Deletion of myostatin had no effect on circumferential wall stress or strain. Taken together, the data suggest that generalized deficits in vasomotor control exist in obese mice. Myostatin deletion has no effect on vascular structure and mechanics. Thus, structural deficits are unlikely mechanisms of impaired vasodilator function in obesity, further arguing an NO‐specific defect.
Table 5.
Vasculature Mechanics of All Groups of Mice Were Assessed
| Vascular Mechanics at 150 mm Hg | Lean | Lean Myostatin−/− | db/db | db/db Myostatin−/− |
|---|---|---|---|---|
| Inner lumen diameter, mm | 214.28±7.26 | 206.97±5.53 | 259.37±9.10### | 229.20±9.51###*** |
| Wall thickness, mm | 7.22±0.67 | 7.98±0.99 | 9.13±0.99 | 8.74±1.70 |
| Wall: lumen ratio | 0.07±0.01 | 0.08±0.01 | 0.07±0.01 | 0.08±0.02 |
| Cross‐section area, μm2 | 5016.20±514.84 | 5477.93±761.84 | 7786.36±894.38## | 6528.36±1275.30*** |
Data are given as the mean±SEM. n=8. db/db myostatin−/− indicates mice lacking both myostatin and leptin receptor; db/db, obese leptin receptor‐deficient mice heterozygous for myostastin; lean myostatin−/−, myostatin‐null mice heterozygous for leptin receptors; lean, lean dual heterozygotes.
***P<0.001, lean versus lean myostatin−/− or db/db versus db/db myostatin−/−. ##P<0.01; ###P<0.001, lean versus db/db or lean myostatin−/− versus db/db myostatin−/−.
Discussion
The aim of this study was to determine whether increasing muscle mass by deletion of myostatin in obese mice improves vascular function. To test this hypothesis and explore the mechanisms involved, we established a new animal model by genetically deleting the negative regulator of muscle mass (myostatin) in obese mice. The key findings in the current study are: Deletion of myostatin in obese db/db mice (1) increases muscle mass significantly, (2) improves fasting glucose, HbA1c, and glucose tolerance, (3) selectively improves NO‐mediated vasodilation in mesenteric arteries, (4) reduces elevated oxidative stress (OS) in the endothelium, which contributes to improvement of vasodilation, and (5) reduces expression of NOX1.
Muscle Atrophy and Vascular Function
Correlative links between muscle mass and vascular homeostasis have previously been described. Impaired endothelium‐dependent vasodilation and elevated superoxide is observed secondary to muscle atrophy that occurs with hindlimb unweighting.33–34 Duchenne muscular dystrophy, a classic muscle‐wasting disease, is associated with perfusion deficits secondary to endothelial dysfunction.35–36 Obese patients or animals also exhibit muscle atrophy37–39 and compromised vascular function.7,40 Consistent with these reports, our study suggests that genetically obese mice develop significant muscle atrophy and impairment of NO‐mediated dilation, compared to lean mice. Through deletion of myostatin, we have successfully generated muscular obese mice (Figure 3) that maintain muscle mass in obesity with commensurate improvements in metabolic and vascular function.
Metabolic Effects of Myostatin Deletion in Obese Mice
Obese db/db mice on the C57/Bl6 background displayed reduced muscle mass, compared to lean controls. Deletion of myostatin increased muscle mass in both lean and obese mice, but did not fully restore muscle mass to control levels in obese mice. The loss of muscle mass in obese mice correlated with impairment of glycemic control and was reversed by deletion of myostatin, suggesting a significant role of skeletal muscle in metabolic control.
Increased muscle mass in the myostatin KOs trended to increase body weight in both lean and obese mice, but these changes were not statistically significant. There were no significant effects on visceral fat levels or adipocyte diameters in obese mice. In agreement with our findings, a previous study showed that inhibition of myostatin using soluble AcvRIIB treatment did not cause fat loss in mice with diet‐induced obesity.41 In the present study, we compared metabolic function in both obese and obese myostatin KO groups, which had similar body weights. Accordingly, improvement of metabolic function must therefore be the result of myostatin deletion and not the indirect effects of weight loss.
Skeletal muscle is the predominant site of insulin‐mediated glucose uptake after meals.42 Loss of muscle mass known as muscle atrophy occurs in catabolic disease, such as in diabetes mellitus patients.43 Consistent with previous studies, db/db mice demonstrated loss of muscle mass, impaired glucose tolerance, higher fasting glucose, and HbA1c levels. Conversely, increased muscle mass in myostatin KO mice resulted in improved glycemic control in obese mice. Collectively, these data suggest that long‐term glycemic control was improved by deletion of myostatin in obese mice. However, plasma insulin levels remained unchanged, suggesting continued impairment of insulin sensitivity, most likely in liver or adipose tissue.
Effects of Myostatin Deletion on Vasodilation
The endothelium is a potent regulator of vascular tone, and abnormal endothelial function underlies CVD in obesity. Impaired vasodilation to the endothelium‐dependent vasodilator, ACh, has been well documented in obese rodents.44–48 PGI2, NO, and EDHF are the 3 major mediators of endothelium‐dependent vasodilation.49 However, the respective role of each factor in mediating the impairment of endothelium‐dependent vasodilation in obese mice is not fully understood. Previous studies have shown that physical activity can improve CV function,50 but whether the exercise itself or the effects physical activity to increase in muscle mass improves vascular function is yet to be determined. In the current study, we show that obese mice exhibit significant impairment of NO‐mediated vasodilation, but not PGI2‐ or EDHF‐mediated vasodilation. Furthermore, impaired vasodilation to ACh was improved by deletion of myostatin. Endothelium‐independent vasodilation to SNP were similar in obese mice, compared to lean mice, and were unaffected by myostatin deletion in both lean and obese mice, suggesting a selective effect on the endothelium versus vascular smooth muscle.
The effect of myostatin deletion on NO‐mediated vasodilation can be attributed to either a direct effect of myostatin on vasodilation or an improvement secondary to correction of metabolic function. A direct effect is refuted because no effect of myostatin was observed on vascular function in lean myostatin KO mice (Figure 8A through 8D). It is therefore likely that deletion of myostatin improves vasodilation secondary to metabolic function improvement, which was observed in obese myostatin KO mice. Previous studies have shown that improving insulin sensitivity improves CV dysfunction in obese mice,7,48,51–52 suggesting that amelioration of metabolic dysfunction improves CV function. Our study suggests that deletion of myostatin is a viable strategy to ameliorate metabolic dysfunction by improving fasting glucose, HbA1c, and glucose tolerance.29,31 Given the dominant role of skeletal muscle in insulin‐dependent disposal of glucose, maintaining muscle mass is crucial in obese and aging populations who are at elevated risk of developing diabetes.4
Mechanisms of Vasodilator Improvement With Myostatin Deletion
Although the effect of obesity and IR on NO‐mediated dilation is compelling, the mechanisms are not clear. NO‐dependent endothelial function is, in part, the balance of NO produced by eNOS and NO scavenged by ROS.53 Excess ROS is a leading cause of reduced NO and endothelial dysfunction in obese mice. In our study, incubation of superoxide scavenger improved vasodilation in obese mice and did not change vasodilation in obese myostatin−/− mice, suggesting that deletion of myostatin improved NO‐mediated dilation by decreasing superoxide levels. To determine the location of superoxide production, mesenteric arteries were double stained for 8‐OHG (a DNA damage marker) and α‐actin. We found that OS is elevated in vasculature of obese mice, whereas deletion of myostatin decreased OS. NOX is known to activate oxygen to form highly reactive oxygen radicals through generation of superoxide radical.54 Consistent with superoxide production results, Western blot results showed that NOX1 expression is elevated in obese mice, whereas deletion of myostatin modestly reduced NOX1 expression. Specifically, CFM demonstrated that NOX1 expression was elevated in the vasculature of obese mice and was down‐regulated with increase of muscle mass. Furthermore, blockage of NOX1/NOX4 with GKT136901 normalized obesity‐induced endothelial‐dependent vasodilation. Whereas GKT136901 inhibits both NOX1 and NOX4, NOX4 is thought to be primarily a source of hydrogen peroxide, which, in microvessels, is a vasodilator.55 Thus, these results suggest that the improvement of NO‐mediated vasodilation by myostatin deletion may be attributed to a reduction in NOX1‐mediated oxidant tone.
eNOS requires BH4 as a cofactor to produce NO and, in its absence, produces superoxide (O2˙−) rather than NO, a condition referred to as eNOS uncoupling.56–57 BH4 infusion increases NO production, decreases O2˙− production, and therefore restores impaired NO‐dependent vasodilation.58–62 We found that the BH4 precursor, sepiapterin, improved impaired vasodilation in blood vessels from obese mice. The effects of sepiapterin were less pronounced in vessels from obese mice with myostatin deletion, suggesting that deletion of myostatin improves endothelial dysfunction in obese mice by increased BH4.
Taken together, the results of these studies suggest that loss of muscle mass, as occurs in sedentary obesity, is a significant contributor to CV risk. Deletion of myostatin reverses this loss of muscle mass and provides protection to endothelial health. This protection is likely mediated by improved glycemic control and/or improved balance of NOX1, BH4, and oxidant tone. We conclude from these studies that novel therapies targeting muscle growth or exercise regimens focused on maintaining or improving overall muscle mass are critical to restoring CV health in the sedentary, obese population.
Sources of Funding
This work was supported by the NIH (R01 HL092446 and R21 HL098829; to Stepp and Fulton) and an American Heart Association predoctoral fellowship (13PRE14680055; to Qiu).
Disclosures
None.
Acknowledgments
The authors acknowledge Eric Belin de Chantemele for his critical reading of the manuscript.
References
- 1.Odegaard JI, Chawla A. Pleiotropic actions of insulin resistance and inflammation in metabolic homeostasis. Science. 2013; 339:172-177. [DOI] [PMC free article] [PubMed] [Google Scholar]
- 2.Romeo GR, Lee J, Shoelson SE. Metabolic syndrome, insulin resistance, and roles of inflammation–mechanisms and therapeutic targets. Arterioscler Thromb Vasc Biol. 2012; 32:1771-1776. [DOI] [PMC free article] [PubMed] [Google Scholar]
- 3.Odegaard JI, Chawla A. Mechanisms of macrophage activation in obesity‐induced insulin resistance. Nat Clin Pract Endocrinol Metab. 2008; 4:619-626. [DOI] [PMC free article] [PubMed] [Google Scholar]
- 4.Kolka CM, Bergman RN. The endothelium in diabetes: its role in insulin access and diabetic complications. Rev Endocr Metab Disord. 2013; 14:13-19. [DOI] [PMC free article] [PubMed] [Google Scholar]
- 5.Virdis A, Neves MF, Duranti E, Bernini G, Taddei S. Microvascular endothelial dysfunction in obesity and hypertension. Curr Pharm Des. 2013; 19:2382-2389. [DOI] [PubMed] [Google Scholar]
- 6.Wang H, Luo W, Wang J, Guo C, Wang X, Wolffe SL, Bodary PF, Eitzman DT. Obesity‐induced endothelial dysfunction is prevented by deficiency of P‐selectin glycoprotein ligand‐1. Diabetes. 2012; 61:3219-3227. [DOI] [PMC free article] [PubMed] [Google Scholar]
- 7.Ali MI, Ketsawatsomkron P, Belin de Chantemele EJ, Mintz JD, Muta K, Salet C, Black SM, Tremblay ML, Fulton DJ, Marrero MB, Stepp DW. Deletion of protein tyrosine phosphatase 1b improves peripheral insulin resistance and vascular function in obese, leptin‐resistant mice via reduced oxidant tone. Circ Res. 2009; 105:1013-1022. [DOI] [PMC free article] [PubMed] [Google Scholar]
- 8.Stepp DW. Impact of obesity and insulin resistance on vasomotor tone: nitric oxide and beyond. Clin Exp Pharmacol Physiol. 2006; 33:407-414. [DOI] [PubMed] [Google Scholar]
- 9.Carter LG, Qi NR, de Cabo R, Pearson KJ. Maternal exercise improves insulin sensitivity in mature rat offspring. Med Sci Sports Exerc. 2013; 45:832-840. [DOI] [PMC free article] [PubMed] [Google Scholar]
- 10.Izadpanah A, Barnard RJ, Almeda AJ, Baldwin GC, Bridges SA, Shellman ER, Burant CF, Roberts CK. A short‐term diet and exercise intervention ameliorates inflammation and markers of metabolic health in overweight/obese children. Am J Physiol. 2012; 303:E542-E550. [DOI] [PMC free article] [PubMed] [Google Scholar]
- 11.Hu G, Eriksson J, Barengo NC, Lakka TA, Valle TT, Nissinen A, Jousilahti P, Tuomilehto J. Occupational, commuting, and leisure‐time physical activity in relation to total and cardiovascular mortality among Finnish subjects with type 2 diabetes. Circulation. 2004; 110:666-673. [DOI] [PubMed] [Google Scholar]
- 12.Park JH, Miyashita M, Kwon YC, Park HT, Kim EH, Park JK, Park KB, Yoon SR, Chung JW, Nakamura Y, Park SK. A 12‐week after‐school physical activity programme improves endothelial cell function in overweight and obese children: a randomised controlled study. BMC Pediatr. 2012; 12:111. [DOI] [PMC free article] [PubMed] [Google Scholar]
- 13.Swift DL, Lavie CJ, Johannsen NM, Arena R, Earnest CP, O'Keefe JH, Milani RV, Blair SN, Church TS. Physical activity, cardiorespiratory fitness, and exercise training in primary and secondary coronary prevention. Circ J. 2013; 77:281-292. [DOI] [PMC free article] [PubMed] [Google Scholar]
- 14.Forbes SC, Little JP, Candow DG. Exercise and nutritional interventions for improving aging muscle health. Endocrine. 2012; 42:29-38. [DOI] [PubMed] [Google Scholar]
- 15.Lee SJ. Extracellular regulation of myostatin: a molecular rheostat for muscle mass. Immunol Endocr Metab Agents Med Chem. 2010; 10:183-194. [DOI] [PMC free article] [PubMed] [Google Scholar]
- 16.McPherron AC. Metabolic functions of myostatin and GDF11. Immunol Endocr Metab Agents Med Chem. 2010; 10:217-231. [DOI] [PMC free article] [PubMed] [Google Scholar]
- 17.McPherron AC, Lawler AM, Lee SJ. Regulation of skeletal muscle mass in mice by a new TGF‐beta superfamily member. Nature. 1997; 387:83-90. [DOI] [PubMed] [Google Scholar]
- 18.Mosher DS, Quignon P, Bustamante CD, Sutter NB, Mellersh CS, Parker HG, Ostrander EA. A mutation in the myostatin gene increases muscle mass and enhances racing performance in heterozygote dogs. PLoS Genet. 2007; 3:e79. [DOI] [PMC free article] [PubMed] [Google Scholar]
- 19.Schuelke M, Wagner KR, Stolz LE, Hubner C, Riebel T, Komen W, Braun T, Tobin JF, Lee SJ. Myostatin mutation associated with gross muscle hypertrophy in a child. N Engl J Med. 2004; 350:2682-2688. [DOI] [PubMed] [Google Scholar]
- 20.Hittel DS, Berggren JR, Shearer J, Boyle K, Houmard JA. Increased secretion and expression of myostatin in skeletal muscle from extremely obese women. Diabetes. 2009; 58:30-38. [DOI] [PMC free article] [PubMed] [Google Scholar]
- 21.Bassil MS, Gougeon R. Muscle protein anabolism in type 2 diabetes. Curr Opin Clin Nutr Metab Care. 2013; 16:83-88. [DOI] [PubMed] [Google Scholar]
- 22.Lebrasseur NK. Building muscle, browning fat and preventing obesity by inhibiting myostatin. Diabetologia. 2012; 55:13-17. [DOI] [PubMed] [Google Scholar]
- 23.Britton KA, Massaro JM, Murabito JM, Kreger BE, Hoffmann U, Fox CS. Body fat distribution, incident cardiovascular disease, cancer, and all‐cause mortality. J Am Coll Cardiol. 2013; 62:921-925. [DOI] [PMC free article] [PubMed] [Google Scholar]
- 24.Manrique C, Demarco VG, Aroor AR, Mugerfeld I, Garro M, Habibi J, Hayden MR, Sowers JR. Obesity and insulin resistance induce early development of diastolic dysfunction in young female mice fed a Western diet. Endocrinology. 2013; 154:3632-3642. [DOI] [PMC free article] [PubMed] [Google Scholar]
- 25.Karlsson HK, Ahlsen M, Zierath JR, Wallberg‐Henriksson H, Koistinen HA. Insulin signaling and glucose transport in skeletal muscle from first‐degree relatives of type 2 diabetic patients. Diabetes. 2006; 55:1283-1288. [DOI] [PubMed] [Google Scholar]
- 26.Meyer C, Dostou JM, Welle SL, Gerich JE. Role of human liver, kidney, and skeletal muscle in postprandial glucose homeostasis. Am J Physiol. 2002; 282:E419-E427. [DOI] [PubMed] [Google Scholar]
- 27.Shulman GI, Rothman DL, Jue T, Stein P, DeFronzo RA, Shulman RG. Quantitation of muscle glycogen synthesis in normal subjects and subjects with non‐insulin‐dependent diabetes by 13C nuclear magnetic resonance spectroscopy. N Engl J Med. 1990; 322:223-228. [DOI] [PubMed] [Google Scholar]
- 28.Guo T, Bond ND, Jou W, Gavrilova O, Portas J, McPherron AC. Myostatin inhibition prevents diabetes and hyperphagia in a mouse model of lipodystrophy. Diabetes. 2012; 61:2414-2423. [DOI] [PMC free article] [PubMed] [Google Scholar]
- 29.Guo T, Jou W, Chanturiya T, Portas J, Gavrilova O, McPherron AC. Myostatin inhibition in muscle, but not adipose tissue, decreases fat mass and improves insulin sensitivity. PLoS One. 2009; 4:e4937. [DOI] [PMC free article] [PubMed] [Google Scholar]
- 30.Wilkes JJ, Lloyd DJ, Gekakis N. Loss‐of‐function mutation in myostatin reduces tumor necrosis factor alpha production and protects liver against obesity‐induced insulin resistance. Diabetes. 2009; 58:1133-1143. [DOI] [PMC free article] [PubMed] [Google Scholar]
- 31.Tu P, Bhasin S, Hruz PW, Herbst KL, Castellani LW, Hua N, Hamilton JA, Guo W. Genetic disruption of myostatin reduces the development of proatherogenic dyslipidemia and atherogenic lesions in Ldlr null mice. Diabetes. 2009; 58:1739-1748. [DOI] [PMC free article] [PubMed] [Google Scholar]
- 32.Stepp DW, Pollock DM, Frisbee JC. Low‐flow vascular remodeling in the metabolic syndrome X. Am J Physiol Heart Circ Physiol. 2004; 286:H964-H970. [DOI] [PubMed] [Google Scholar]
- 33.Zhang R, Bai YG, Lin LJ, Bao JX, Zhang YY, Tang H, Cheng JH, Jia GL, Ren XL, Ma J. Blockade of AT1 receptor partially restores vasoreactivity, NOS expression, and superoxide levels in cerebral and carotid arteries of hindlimb unweighting rats. J Appl Physiol. 2009; 106:251-258. [DOI] [PubMed] [Google Scholar]
- 34.Zhang R, Ran HH, Ma J, Bai YG, Lin LJ. NAD(P)H oxidase inhibiting with apocynin improved vascular reactivity in tail‐suspended hindlimb unweighting rat. J Physiol Biochem. 2012; 68:99-105. [DOI] [PubMed] [Google Scholar]
- 35.Ennen JP, Verma M, Asakura A. Vascular‐targeted therapies for Duchenne muscular dystrophy. Skelet Muscle. 2013; 3:9. [DOI] [PMC free article] [PubMed] [Google Scholar]
- 36.Ito K, Kimura S, Ozasa S, Matsukura M, Ikezawa M, Yoshioka K, Ueno H, Suzuki M, Araki K, Yamamura K, Miwa T, Dickson G, Thomas GD, Miike T. Smooth muscle‐specific dystrophin expression improves aberrant vasoregulation in mdx mice. Hum Mol Genet. 2006; 15:2266-2275. [DOI] [PubMed] [Google Scholar]
- 37.Watts R, McAinch AJ, Dixon JB, O'Brien PE, Cameron‐Smith D. Increased smad signaling and reduced mrf expression in skeletal muscle from obese subjects. Obesity. 2013; 21:525-528. [DOI] [PubMed] [Google Scholar]
- 38.Kim TN, Park MS, Yang SJ, Yoo HJ, Kang HJ, Song W, Seo JA, Kim SG, Kim NH, Baik SH, Choi DS, Choi KM. Body size phenotypes and low muscle mass: the Korean sarcopenic obesity study (KSOS). J Clin Endocrinol Metab. 2013; 98:811-817. [DOI] [PubMed] [Google Scholar]
- 39.Russell ST, Tisdale MJ. Mechanism of attenuation of skeletal muscle atrophy by zinc‐alpha2‐glycoprotein. Endocrinology. 2010; 151:4696-4704. [DOI] [PubMed] [Google Scholar]
- 40.Loffredo L, Martino F, Carnevale R, Pignatelli P, Catasca E, Perri L, Calabrese CM, Palumbo MM, Baratta F, Del Ben M, Angelico F, Violi F. Obesity and hypercholesterolemia are associated with NOX2 generated oxidative stress and arterial dysfunction. J Pediatr. 2012; 161:1004-1009. [DOI] [PubMed] [Google Scholar]
- 41.McPherron AC, Guo T, Wang Q, Portas J. Soluble activin receptor type IIB treatment does not cause fat loss in mice with diet‐induced obesity. Diabetes Obes Metab. 2012; 14:279-282. [DOI] [PMC free article] [PubMed] [Google Scholar]
- 42.DeFronzo RA, Tripathy D. Skeletal muscle insulin resistance is the primary defect in type 2 diabetes. Diabetes Care. 2009; 32:S157-S163. [DOI] [PMC free article] [PubMed] [Google Scholar]
- 43.Wang X, Hu Z, Hu J, Du J, Mitch WE. Insulin resistance accelerates muscle protein degradation: activation of the ubiquitin‐proteasome pathway by defects in muscle cell signaling. Endocrinology. 2006; 147:4160-4168. [DOI] [PubMed] [Google Scholar]
- 44.Sloboda N, Feve B, Thornton SN, Nzietchueng R, Regnault V, Simon G, Labat C, Louis H, Max JP, Muscat A, Osborne‐Pellegrin M, Lacolley P, Benetos A. Fatty acids impair endothelium‐dependent vasorelaxation: a link between obesity and arterial stiffness in very old Zucker rats. J Gerontol A Biol Sci Med Sci. 2012; 67:927-938. [DOI] [PubMed] [Google Scholar]
- 45.Chinen I, Shimabukuro M, Yamakawa K, Higa N, Matsuzaki T, Noguchi K, Ueda S, Sakanashi M, Takasu N. Vascular lipotoxicity: endothelial dysfunction via fatty‐acid‐induced reactive oxygen species overproduction in obese Zucker diabetic fatty rats. Endocrinology. 2007; 148:160-165. [DOI] [PubMed] [Google Scholar]
- 46.Belin de Chantemele EJ, Vessieres E, Guihot AL, Toutain B, Maquignau M, Loufrani L, Henrion D. Type 2 diabetes severely impairs structural and functional adaptation of rat resistance arteries to chronic changes in blood flow. Cardiovasc Res. 2009; 81:788-796. [DOI] [PubMed] [Google Scholar]
- 47.Belin de Chantemele EJ, Vessieres E, Guihot AL, Toutain B, Loufrani L, Henrion D. Cyclooxygenase‐2 preserves flow‐mediated remodelling in old obese Zucker rat mesenteric arteries. Cardiovasc Res. 2010; 86:516-525. [DOI] [PubMed] [Google Scholar]
- 48.Romanko OP, Ali MI, Mintz JD, Stepp DW. Insulin resistance impairs endothelial function but not adrenergic reactivity or vascular structure in fructose‐fed rats. Microcirculation. 2009; 16:414-423. [DOI] [PMC free article] [PubMed] [Google Scholar]
- 49.Feletou M, Vanhoutte PM. Endothelium‐derived hyperpolarizing factor: where are we now? Arterioscler Thromb Vasc Biol. 2006; 26:1215-1225. [DOI] [PubMed] [Google Scholar]
- 50.Gu Q, Wang B, Zhang XF, Ma YP, Liu JD, Wang XZ. Contribution of hydrogen sulfide and nitric oxide to exercise‐induced attenuation of aortic remodeling and improvement of endothelial function in spontaneously hypertensive rats. Mol Cell Biochem. 2013; 375:199-206. [DOI] [PubMed] [Google Scholar]
- 51.Belin de Chantemele EJ, Ali MI, Mintz JD, Rainey WE, Tremblay ML, Fulton DJ, Stepp DW. Increasing peripheral insulin sensitivity by protein tyrosine phosphatase 1B deletion improves control of blood pressure in obesity. Hypertension. 2012; 60:1273-1279. [DOI] [PMC free article] [PubMed] [Google Scholar]
- 52.Belin de Chantemele EJ, Muta K, Mintz J, Tremblay ML, Marrero MB, Fulton DJ, Stepp DW. Protein tyrosine phosphatase 1B, a major regulator of leptin‐mediated control of cardiovascular function. Circulation. 2009; 120:753-763. [DOI] [PMC free article] [PubMed] [Google Scholar]
- 53.Belin de Chantemele EJ, Stepp DW. Influence of obesity and metabolic dysfunction on the endothelial control in the coronary circulation. J Mol Cell Cardiol. 2012; 52:840-847. [DOI] [PMC free article] [PubMed] [Google Scholar]
- 54.Kulkarni AC, Kuppusamy P, Parinandi N. Oxygen, the lead actor in the pathophysiologic drama: enactment of the trinity of normoxia, hypoxia, and hyperoxia in disease and therapy. Antioxid Redox Signal. 2007; 9:1717-1730. [DOI] [PubMed] [Google Scholar]
- 55.Ray R, Murdoch CE, Wang M, Santos CX, Zhang M, Alom‐Ruiz S, Anilkumar N, Ouattara A, Cave AC, Walker SJ, Grieve DJ, Charles RL, Eaton P, Brewer AC, Shah AM. Endothelial Nox4 NADPH oxidase enhances vasodilatation and reduces blood pressure in vivo. Arterioscler Thromb Vasc Biol. 2011; 31:1368-1376. [DOI] [PubMed] [Google Scholar]
- 56.Alp NJ, Channon KM. Regulation of endothelial nitric oxide synthase by tetrahydrobiopterin in vascular disease. Arterioscler Thromb Vasc Biol. 2004; 24:413-420. [DOI] [PubMed] [Google Scholar]
- 57.Forstermann U, Sessa WC. Nitric oxide synthases: regulation and function. Eur Heart J. 2012; 33:829-837. [DOI] [PMC free article] [PubMed] [Google Scholar]
- 58.Stroes E, Kastelein J, Cosentino F, Erkelens W, Wever R, Koomans H, Luscher T, Rabelink T. Tetrahydrobiopterin restores endothelial function in hypercholesterolemia. J Clin Invest. 1997; 99:41-46. [DOI] [PMC free article] [PubMed] [Google Scholar]
- 59.Heitzer T, Brockhoff C, Mayer B, Warnholtz A, Mollnau H, Henne S, Meinertz T, Munzel T. Tetrahydrobiopterin improves endothelium‐dependent vasodilation in chronic smokers: evidence for a dysfunctional nitric oxide synthase. Circ Res. 2000; 86:E36-E41. [DOI] [PubMed] [Google Scholar]
- 60.Alkaitis MS, Crabtree MJ. Recoupling the cardiac nitric oxide synthases: tetrahydrobiopterin synthesis and recycling. Curr Heart Fail Rep. 2012; 9:200-210. [DOI] [PMC free article] [PubMed] [Google Scholar]
- 61.Crabtree MJ, Tatham AL, Hale AB, Alp NJ, Channon KM. Critical role for tetrahydrobiopterin recycling by dihydrofolate reductase in regulation of endothelial nitric‐oxide synthase coupling: relative importance of the de novo biopterin synthesis versus salvage pathways. J Biol Chem. 2009; 284:28128-28136. [DOI] [PMC free article] [PubMed] [Google Scholar]
- 62.Maier W, Cosentino F, Lutolf RB, Fleisch M, Seiler C, Hess OM, Meier B, Luscher TF. Tetrahydrobiopterin improves endothelial function in patients with coronary artery disease. J Cardiovasc Pharmacol. 2000; 35:173-178. [DOI] [PubMed] [Google Scholar]


