

Abstract
Background
The TRIB1 locus has been linked to hepatic triglyceride metabolism in mice and to plasma triglycerides and coronary artery disease in humans. The lipid‐associated single nucleotide polymorphisms (SNPs), identified by genome‐wide association studies, are located ≈30 kb downstream from TRIB1, suggesting complex regulatory effects on genes or pathways relevant to hepatic triglyceride metabolism. The goal of this study was to investigate the functional relationship between common SNPs at the TRIB1 locus and plasma lipid traits.
Methods and Results
Characterization of the risk locus reveals that it encompasses a gene, TRIB1‐associated locus (TRIBAL), composed of a well‐conserved promoter region and an alternatively spliced transcript. Bioinformatic analysis and resequencing identified a single SNP, rs2001844, within the promoter region that associates with increased plasma triglycerides and reduced high‐density lipoprotein cholesterol and coronary artery disease risk. Further, correction for triglycerides as a covariate indicated that the genome‐wide association studies association is largely dependent on triglycerides. In addition, we show that rs2001844 is an expression trait locus (eQTL) for TRIB1 expression in blood and alters TRIBAL promoter activity in a reporter assay model. The TRIBAL transcript has features typical of long noncoding RNAs, including poor sequence conservation. Modulation of TRIBAL expression had limited impact on either TRIB1 or lipid regulatory genes mRNA levels in human hepatocyte models. In contrast, TRIB1 knockdown markedly increased TRIBAL expression in HepG2 cells and primary human hepatocytes.
Conclusions
These studies demonstrate an interplay between a novel locus, TRIBAL, and TRIB1. TRIBAL is located in the genome‐wide association studies identified risk locus, responds to altered expression of TRIB1, harbors a risk SNP that is an eQTL for TRIB1 expression, and associates with plasma triglyceride concentrations.
Keywords: cardiovascular diseases, lipids, lipoproteins, liver
Introduction
Several genome‐wide association studies (GWAS) have identified a region in the vicinity (≈30 kb) of the TRIB1coding region associated with plasma levels of triglycerides (TGs), high‐density lipoprotein cholesterol (HDL‐C), and coronary artery disease (CAD).1–6 The proximity of the associated region to TRIB1 suggested that the Trib1 protein might constitute the bona fide effecter of the GWAS‐identified risk alleles. However, the TRIB1 coding region and risk SNPs are not in linkage disequilibrium (LD), consistent with possible independent functions. Although not previously implicated in lipoprotein metabolism, in a mouse model, hepatic overexpression of Trib1 lowered plasma TGs by reducing VLDL production, an effect attributed to downregulation of lipogenic genes (Acc1, Fas, Scd1) and upregulation of genes involved in fatty acid oxidation (Cpt1a, Cpt2, Acox1). Liver‐specific Trib1 knockout mice exhibited opposite changes in lipogenic gene expression and plasma TGs.7 Implicit in this model, higher Trib1 levels would be expected to protect against atherosclerosis by reducing hepatic TG synthesis and increasing fatty acid oxidation.
Recent studies by Satoh et al demonstrate the challenge of defining a simple function for TRIB1.8 They elegantly demonstrated that Trib1 deficiency limited to the hematopoietic compartment (M2‐like macrophages) is associated with increased lipolysis in adipose tissue. Thus, TRIB1 is likely to play multiple, tissue‐specific roles with complex systemic implications. Equally at odds with the simple antiatherogenic model, Ostertag et al demonstrated that Trib1 haploinsufficiency in the mouse protects against obesity without altering serum TG.9 The latter study revealed inflammation regulation as an important facet of Trib1 function. In view of the accepted role of inflammation in atherosclerosis progression, this may explain a part of the association of the TRIB1 locus with CAD. Importantly, the GWAS identified the 8q24.13 locus for TG and CAD has not yet been identified as an expression trait locus (eQTL) for TRIB1, suggesting that the genomic effects of this locus may not be limited to alterations in expression of the Trib1 protein.3
At the molecular level, the mechanism by which TRIB1 regulates TG metabolism is poorly understood.10 Clearly, TRIB1 could regulate transcription by operating as a coactivator and more broadly by regulating transcription factor function.10 Our understanding of Trib1 function stems largely from tumorigenic models where TRIB1 has been implicated as an oncogene in leukemia.11 Key to the oncogenic properties of Trib1 is its ability to promote degradation of CCAAT/Enhancer‐Binding Protein Alpha via its stimulatory interaction with MAP2K1 and RFWD2. Interestingly, Trib2, which shares Trib1's oncogenic properties, has been implicated in murine adipocyte differentiation via CCAAT/Enhancer‐Binding Protein Beta regulation.12 In addition and consistent with a role in the human vascular disease, a Trib2 epitope has been identified in atheroma supporting a possible role in plaque development.13 Finally, Trib3, the last member of the family, also plays a key regulatory role in lipid metabolism in adipose tissue via regulation of Acc1 and inhibition of fatty acid synthesis.14 Despite evidence for a role of all 3 members of the Tribbles family in some facet of lipid metabolism, only the TRIB1 locus has been associated with plasma TG concentrations in humans.
Here, we identify a novel long noncoding RNA (lncRNA) in the TRIB1‐associated locus (TRIBAL) that encompasses risk SNPs for TG and HDL‐C. lncRNA, broadly defined as RNAs longer than 200 bp, with no protein coding potential, have attracted considerable interest as important transcriptional regulators.15–16 The shear abundance of these transcripts vis‐à‐vis the total transcriptome hints to important functions that are just beginning to be elucidated. Nevertheless, the relatively poor sequence conservation of lncRNA vs mRNA as a group has cast doubt on their relevance to biology, and many lncRNA have been proposed to constitute transcriptional noise.17 Alternatively, it has been proposed that RNA structure and function might be preserved despite a lack of sequence conservation. Nevertheless, there is general consensus that some lncRNA are indeed biologically important, consistent with significant genome‐wide expression changes observed on knock‐down of certain lncRNA.18 In recent years, their roles have expanded considerably as potentially new classes of lncRNA have been described including circular RNAs (ciRNA) that are proposed to function as molecular sponges for miRNA and enhancer RNAs (eRNA) that redefine the enhancer element paradigm.19–20
Efforts to systematically categorize lncRNAs are under way.21 On the one hand, lncRNA can resemble mRNA transcripts: they tend to be polyadenylated, can be found in the cytosol, and typically consist of multiple exons. On the other hand, some lncRNA compartmentalize in the nucleus, are expressed at a lower level, and tend to be poorly conserved.17,21 To date, most functional nuclear lncRNA have been associated with gene expression regulation in cis, usually defined as acting on genes located 3′ or 5′ of the lncRNA gene.15,17 According to 1 prevailing model, nuclear lncRNA regulate the expression of specific neighboring protein coding genes by regulating their epigenetic status via the recruitment of specific remodeling complexes. However, analyses of whole genome transcription appear equally, if not more, consistent with longer distance interactions by lncRNA.17
Here, we demonstrate a functional interplay between a novel lncRNA termed TRIBAL and TRIB1. TRIBAL responds to altered expression of TRIB1 and harbors a risk SNP that is an eQTL for TRIB1 expression in blood and associates with plasma TG concentrations.
Methods
Research Cohort
Patients were all part of the Ottawa Heart Study and recruited as described previously. Subjects for CAD cases included white men and women from the Ottawa Heart Study with severe premature CAD that resulted in coronary revascularization. The study was approved by the Human Research Ethics Committee of the Ottawa Heart Institute; written inform consent was obtained from all participants. In all CAD cases, the documented onset was under 60 years of age. Diabetics and individuals with plasma cholesterol levels indicative of monogenic hypercholesterolemia (>280 mg/dL) were excluded from the study. Written and informed consent was obtained from all participants. For SNP genotyping at the TRIB1/TRIBAL locus, controls included healthy white men (>65 years) and women (>70 years) with no symptoms and no previous personal or family history of CAD. For TRIB1 mRNA expression analysis in whole blood, the chosen control subjects were not on lipid‐altering medication and were matched for age, sex, and body mass index. Written and informed consent was obtained from all participants.
Cell Culture
Primary human hepatocytes were obtained from Corning Life Sciences from multiple donors, 1 donor per replicate. HepG2, Huh7, and COS‐7 were from ATCC. Transfections were performed with Fugene HD (Promega) or Lipofectamine RNAimax (Life Technologies) for plasmids or oligonucleotides, respectively. HepG2 and Huh7 cells were maintained in low‐glucose DMEM (Life Technologies) supplemented with 10% FBS and penicillin/streptomycin (P‐S, Life Technologies). COS‐7 cells were maintained in high‐glucose DMEM (Life Technologies) containing 10% FBS and P‐S. Human hepatocytes were obtained from Corning Life Sciences, preattached to collagen‐coated plates. On arrival, medium was changed to low‐glucose DMEM containing a 1:500 dilution of gentamicin/amphoterin‐B (Lonza) for 20 hours before the experiment. After a fresh media change, knock‐downs were performed for 48 hours in 12‐well plates by using 60 nmol/L (hepatocytes) or 20 nmol/L (HepG2/Huh7) of 2′‐O‐(2‐methoxy)ethyl–modified antisense oligonucleotides (sequences in supplemental sequences) with 4.8 mL of Lipofectamine RNAimax in 1 mL final volume (0.2 mL OptiMEM+0.8 mL of DMEM). Overexpression was performed by using lentiviral constructs (PLVX‐derived) coding for TRIBAL form 1 (TRIBAL1). Infections were performed in the presence of 4 μg/mL polybrene with concentrated viral supernatants (Lenti‐X, Clontech). Viral supernatants were obtained from 293FT cells (Life Technologies) cultured for 3 days after being cotransfected with psPAX2 (4.5 μg), pMD2.G (1.5 μg) and PLVX‐derived (6 μg) constructs per 10‐cm culture dish. Stable cell lines (Huh7 and HepG2) were selected with puromycin (2 μg/mL) for 3 days, after which cells were passaged in the absence of puromycin. Cells were maintained for 5 to 10 additional passages before analysis. Expression levels of TRIBAL increased ≈150 and 600‐fold, respectively, in Huh7 and HepG2.
Quantitative Real‐Time PCR
For routine quantitative reverse transcription PCR (qRT‐PCR), RNA was isolated by using the Roche High Pure RNA isolation kit. Total RNA (0.5 to 1 μg) was reverse transcribed with the Transcriptor First Strand cDNA synthesis kit from Roche Diagnostics. A combination of oligo(dT) and random hexamer primers was used, as indicated by the supplier. Quantitative real time PCR was performed by using the Roche LightCycler 480 SybrGreen I Master mix, and reactions were run on a LightCycler480 (Roche). TRIBAL signal typically yielded crossing point (Cp) values around 32. Unless mentioned otherwise, Cp values were normalized to peptidylprolyl isomerase A (PPIA).
Rapid Amplification of DNA Ends
Total RNA was obtained from HepG2 by using Trizol (Life Technologies). Rapid amplification of DNA ends (RACE) was performed by using the 5′/3′ RACE kit, 2nd Generation (Roche Diagnostics) according to the manufacturer's instructions. Reverse transcription was performed on 1 μg of total RNA for 60 minutes at 55°C followed by 5 minutes at 85°C and purified with the High Pure PCR Purification Kit (Roche Diagnostics) according to the modifications described in the RACE kit instructions. All PCRs were run on the ABI GenAmp PCR system 9700. TRIBAL amplification required 2 rounds of PCR with the Roche FastStart Taq DNA polymerase, dNTPack (Roche Diagnostics). For 3′ RACE, in the first round of PCR, each reaction contained a gene‐specific forward primer targeting exon 1 or 2 and 1× GC‐rich solution. The first‐round PCR products were diluted 1:20 for the second round by using a nesting primer, under the following conditions: (1) an initial denaturation for 2 minutes at 95°C; (2) 10 cycles of 95°C for 15 seconds, 57°C for 30 seconds, 72°C for 40 seconds; (3) 25 cycles of 95°C for 15 seconds, 57°C for 30 seconds, 72°C for 40 seconds (+20 s/cycle for the 25 cycles); and (4) a final elongation at 72°C for 7 minutes. For 5′ RACE, the purified cDNA was used for the 2‐step poly(A)‐tailing reaction with terminal transferase at 37°C for 30 minutes followed by a 10‐minute incubation at 70°C to inactivate the enzyme. PCR conditions were as follows: (1) an initial denaturation for 2 minutes at 95°C and (2) 45 cycles of 95°C for 15 seconds, 57°C for 1 minutes, 72°C for 90 seconds. In the first round, a 3:1 ratio of oligo(dT)‐anchor primer and a nested primer was used, while a ratio of 1:1 was used in the second round. For the second round, a shorter anchor primer was used to allow for more compatible melting temperatures. Finally, several primers were designed upstream from one another to “chase” the 5′ end of the transcripts. Chasing required 1 round of PCR and was performed by using the conditions just described.
Plasmid Constructs
Reporter constructs were derived from pGL3.0 (Promega). The lentiviral vector (PLVX) was from Clontech. All constructs were generated by conventional cloning methodologies by using PCR and sequencing to ascertain identity. Primers used for cloning are described in the supplemental sequence information file.
Reporter Assays and Cignal Finder Reporter Arrays
Inserts were generated by PCR by using the PfuUltraII system from Stratagene (Agilent Technologies) and subcloned in pGL3.0 basic. All plasmids were affinity‐purified (Qiagen) and transfected with Fugene HD (Promega) in 80% confluent COS‐7 and HepG2 in 12‐well plates. Unless otherwise indicated, 1 μg of total plasmid was transfected per well containing 2% pRL‐SV40 renilla (Promega). For Cignal Finder, HepG2 or Huh7 cells seeded (80 000 cells per well) in Cignal Finder Signal Transduction 45‐Pathway Reporter Arrays were reverse‐transfected with Attractene (0.75 μL in 50 μL Opti‐MEM). Cells were lysed in 0.1 mL of passive lysis buffer, and 20 μL was used per luciferase/renilla assay. All assays were performed 24 hours posttransfection in triplicate in a GLOMAX apparatus.
Cellular Fractionation and Nuclear Enrichment
Nuclear fractionation was obtained as described by Rinn et al.22 Relative abundance of TRIBAL, U1, and PPIA in comparison with total signal obtained from whole cell lysates was measured by using qRT‐PCR. All primer sequences used are described in the supplemental sequence information section. TRIBAL amount was quantified by using a pair of primers targeting exons 1 and 2. The fraction of nuclear to total signal was determined for each transcript. TRIBAL values were normalized to the relative nuclear signal of PPIA and U1.
Chromatin RNA Precipitation
The procedure was performed as described in detail by Chu et al.23 Briefly, 3×10‐cm dishes of near‐confluent HepG2 cells were used for each pulldown (1 dish per pulldown condition). Cells were rinsed briefly in PBS and fixed in 1% formaldehyde in PBS for 10 minutes followed by a 10‐minute glycine block. Following 1 additional rinse in PBS, cells were lysed in 50 mmol/L Tris‐HCl, 10 mmol/L EDTA, and 1% SDS containing RNase inhibitor (1:400 dilution), PMSF, and a Roche protease inhibitor mix. Cells were then frozen in liquid N2 and stored at −80°C. Thawed lysates were sonicated in a Bioruptor (Diagenode) by using 1.5 mL of cell suspension in 15‐mL Falcon tubes for 30 minutes with 30‐seconds‐on/60‐seconds‐off cycles. Following a brief centrifugation (5 minutes, 13 000g) the supernatant were diluted 1:2 in hybridization buffer (50 mmol/L Tris‐HCl, 750 mmol/L NaCl, 1 mmol/L EDTA, and 1% SDS containing RNase inhibitor [1:400 dilution]), PMSF, and a Roche protease inhibitor cocktail and precleared for 30 minutes with streptavidin‐coupled magnetic beads (PureProteome, Millipore). The supernatant was recovered and incubated in the absence of oligonucleotides or in the presence of 2 sets of 5 biotinylated nucleotides (see supplemental information) with nonoverlapping sequences. Incubation was performed for 90 minutes at 37°C followed by 10 washes (4 minutes per wash) in 2× SSC and 0.5% SDS at 37°C. Aliquots were then processed separately for RNA and DNA analyses. RNA was recovered by successive proteinase K treatment, TriPure extraction, and purification with the RNAeasy Kit (Qiagen). Recovered RNAs were quantified by qRT‐PCR. Bead‐associated DNA was first released by 2 rounds of 2 μL each of RNase H (Epicenter, 10 U/μL) and RNase A (Roche, 10 mg/mL) digests, followed by proteinase K treatment. DNA was further purified by a combination of phenol/chloroform/isoamyl alcohol extraction and ethanol precipitation with 2.5 volumes of ethanol and GenElute LPA (Sigma‐Aldrich) for 20 minutes on ice. The recovered material was resuspended in 30 μL EB buffer (Qiagen) and quantified by qPCR. All the oligonucleotides are described in the supplemental sequence information section.
Transcription Array Analyses
Stable pools of HepG2 expressing TRIBAL1 were generated by lentiviral infection with PLVXTRIBAL1 (or PLVX control) followed by puromycin selection (2 μg/mL). For Huh7, TRIBAL was suppressed for 48 hours with the TRIBAL‐specific antisense oligonucleotides or a nontarget control before RNA isolation. Samples from 3 independent experiments were processed for RNA. For Huh7, total RNA (200 ng) from each of the experimental and control group samples and universal reference total RNA (Agilent) were used to synthesize double‐stranded cDNA and cyanine‐labeled cRNA according to the manufacturer's instruction. Experimental and/or control cRNAs were labeled with cyanine 5‐CTP, and reference RNAs were labeled with cyanine 3‐CTP. Cyanine‐labeled cRNAs were synthesized by using T7 RNA polymerase in vitro transcription kit (Agilent Technologies) and later purified by using RNeasy Mini Kit (Qiagen). Each experimental or control Cy‐5 labeled cRNA sample was mixed with equimolar amount of Cy‐3 labeled reference cRNA and were hybridized to Agilent SurePrint G3 Hmn GE 8×60K oligonucleotide microarrays (Agilent Technologies Inc, Mississauga, ON, Canada). Arrays were scanned on an Agilent G2505B scanner. Data from the scanned images were extracted by using Agilent Feature Extraction software version 11. A reference randomized block design was used to analyze gene expression microarray data. Data were normalized by using the locally weighted scatterplot smoothing regression modeling method, and statistical significance of the differentially expressed genes was analyzed by using microarray ANOVA with R statistical software (http://www.r-project.org). The F statistic was used to test the treatment effects, and P values were estimated by using the permutation method with residual shuffling. The false discovery rate multiple testing correction24 was applied to minimize any false‐positive results. Fold change calculations were based on the least‐square means. For overexpression experiments (HepG2), isolated RNAs were processed at the Centre for Applied Genomics (The Hospital for Sick Children, Toronto, ON, Canada). Labeled cRNAs were hybridized on GeneChip Human Transcriptome Arrays 2.0, and results were analyzed by using Expression Console and the Transcriptome Analysis Console from Affymetrix. The analyses are available at the Gene Expression Omnibus (accession number GSE54957).
Statistical Analyses
For cell biology experiments, 3 independent replicates, each quantified by using 2 or 3 technical replicates, were analyzed. Samples were normalized to their matched control first (nontarget oligonucleotide control, empty vector, etc) to obtain relative changes for each experiment; relative changes were then averaged across 3 or 4 experiments. Statistical analyses for biologic experiments were performed by using 2‐tailed unpaired Student's t tests, and differences were deemed significant if P<0.05. Nonparametric tests (Mann–Whitney U test) were then performed, which corroborated the t test results (P<0.05). Error bars correspond to 95% CIs (α=0.05).
Allelic frequencies were analyzed by using Fisher's exact test to generate the indicated P values. Odds ratios (ORs) for CAD were determined with 95% CIs by using a logistic regression model fit. LD between SNPs was determined by using R Program 2.10.1. For CAD/TG/SNP association analyses in larger cohorts, association of candidate SNPs with CAD and TG phenotypes was measured by using linear and logistic models implemented in PLINK v1.0725; both methods allow for inclusion of covariates in the analysis. Linear regression was conducted to analyze the association of TGs with SNPs. The first 2 principal components (pc1 and pc2) of ancestry as determined by EIGENSTRAT26 were included as covariates in the analysis. Logistic regression was conducted to quantify the association of the CAD with SNPs, after adjustment for pc1 and pc2. To determine if the association of CAD with SNPs is dependent on TGs, we also conducted a logistic regression analysis by including TGs, pc1, and pc2 as covariates in the analysis.
Results
Identification of 2 Common TRIB1‐Associated SNPs That Correlate With CAD and Changes in Lipoprotein Profile
To address the relationship of risk SNPs for TG/CAD, we carried out phylogenetic analysis and identified a ≈300‐bp conserved region (CNS) proximal to most of the GWAS identified risk SNPs (Figure 1A and 1B). This region was resequenced by using DNA from a sample of CAD cases and controls, matched for age and sex, who had participated in the Ottawa Heart Study. We identified 2 common SNPs (rs2001844 and rs2001845), neither of which is in the same LD block as the TRIB1 coding region (Figure1C), that displayed a strong association with CAD with allele‐specific OR ≈1.5 (Table 1). These SNPs are in LD with the TG‐associated SNP rs200194527 and, of these, rs2001844 displayed a stronger association with the TG and CAD risk SNP, rs17321515 (D'=1, r2=0.98).3 As expected from their unequal LD with rs17321515, rs2001844 and rs2001845 were moderately linked (D'=1, r2=0.38). Of note, subsequent to our analysis, a recent gene‐centric meta‐analysis of plasma lipid traits identified rs2001844 to have the largest effect size of the 40 SNPs investigated in this region.28
Figure 1.

Conserved region (CNS) and its relationship with TG and CAD‐associated SNP identified by GWAS. A, The position of the SNP identified in this study are shown in red relative to the CAD/TG‐associated SNP (black). TRIBAL exons are numbered. B, CNS region and its conservation. PhastCons (UCSC Genome Browser) analysis of CNS and surrounding region, focusing on vertebrates. SNPs are indicated at bottom. Of common SNPs, only rs2001844 (underlined in red) is located within the ≈500‐bp CNS region. The TG associated SNP rs2001945 is boxed in black. C, TRIB1 and the CAD‐associated SNPs occupy distinct LD blocks. LD plot generated by HaploView (version 4.2) highlighting the lack of linkage between SNPs associated with the TRIB1 coding region and the SNPs associated with CAD. Analysis was performed using the 1000 Genome indexed SNPs spanning chromosome 8: 126447308 to 126486409. Blocks shown (black triangles) were defined by CIs. CAD indicates coronary artery disease; CNS, conserved region; GWAS, genome‐wide association studies; LD, linkage disequilibrium; SNP, single nucleotide polymorphism; TG, triglycerides.
Table 1.
Allele Frequencies, CAD Association, and LD Data for SNPs Within Evolutionarily Conserved Regions Genotyped in CAD Cases and Controls From the Ottawa Heart Study
| SNP | Chromosome 8 Location | Phenotype | AA | AB | BB | MAF | Allelic P Value | Odds Ratio (95% CI) | LD With rs2001945 |
|---|---|---|---|---|---|---|---|---|---|
| rs2001845 | 126478644 | Cases | 106 | 122 | 38 | 0.37 | 0.0062 | 1.46 (1.19 to 1.87) | D′=1 |
| Controls | 145 | 98 | 28 | 0.28 | r2=0.52 | ||||
| rs2001844 | 126478745 | Cases | 47 | 125 | 94 | 0.59 | 0.004 | 1.50 (1.18 to 1.90) | D′=1 |
| Controls | 74 | 131 | 66 | 0.48 | r2=0.81 |
Minor allele frequencies (MAF) were compared between CAD cases and controls for each SNP. Statistical analysis was based on a univariate logistic regression model. rs2001945 is a previously identified TG‐associated SNP. Both SNPs are in partial LD with one another (D′=1, r2=0.38), according to Haploreg (CEU population); A=major allele, B=minor allele. CAD indicates coronary artery disease; LD, linkage disequilibrium; SNP, single nucleotide polymorphism.
Having established its relationship to CAD, the association of rs2001844 with lipid traits was investigated in healthy control subjects who were not receiving lipid‐modifying therapy; CAD patients were excluded from this first analysis due to confounding effects of medication regimens. The rs2001844 CAD risk allele was associated with increased TGs and decreased HDL‐C (Figure 2A). These data appear most consistent with an additive model for TGs and a nonadditive model for HDL‐C.
Figure 2.

Risk SNP at rs2001844 is associated with higher TG and lower HDL levels. A, Fasting levels of HDL and TG (normalized) in non‐CAD patients with homozygous risk (AA, n=385), heterozygous (AB, n=666) and homozygous risk (BB, n=346) genotypes. Error bars represent 95% CIs. For HDL, statistically significant differences were observed for AA vs BB (P=0.0036) and AB vs BB (P=0.0044) only. For TG, all groups were statistically different (P<0.05). B, Levels of TRIB1 transcript were measured in a total of 160 patients (50 AA, 56 AB, 54 BB) well matched for sex, age, and BMI. Data are normalized to PPIA for each patient, and bars represent the means±95% CIs TRIB1 mRNA levels were statistically significant between AA and BB only (P=0.008). BMI indicates body mass index; CAD, coronary artery disease; HDL, high‐density lipoprotein; SNP, single nucleotide polymorphism; TG, triglycerides.
While these data suggest that changes in lipid profiles underlie the CAD association with rs2001844, this remained to be investigated. To this end, the association was examined in a larger cohort consisting of both healthy and CAD patients, focusing on the contribution of TGs. As shown in Table 2, when TGs were excluded from the logistic regression analysis, rs2001844 was significantly associated with CAD, consistent with our earlier findings. When the analysis was adjusted for TGs, however, the association with CAD was considerably attenuated, indicating that the association of rs2001844 with CAD can be explained largely by the plasma TGs effect. Similar findings were obtained for rs2001945 and rs2001845, implying that the whole locus operates similarly.
Table 2.
Association of Risk SNPs With CAD Depends on TGs
| SNP | Chr8 Location | Allele | Cases/Controls | Adjusted for pc1+pc2 | Adjusted for pc1+pc2+TGs | ||
|---|---|---|---|---|---|---|---|
| Odds Ratio | P Value | Odds Ratio | P Value | ||||
| rs2001945 | 126477978 | G | 4628/3920 | 1.1504 | 9.35E–06 | 1.088 | 1.79E–02 |
| rs2001845 | 126478644 | A | 6243/4284 | 1.145 | 2.31E–05 | 1.0993 | 8.08E–03 |
| rs2001844 | 126478745 | G | 6243/4284 | 0.8736 | 5.00E–06 | 0.9133 | 5.98E–03 |
After removing SNPs with missingness per SNP >5%, Hardy‐Weinberg equilibrium <0.0001, mean allele frequency <0.01, info <0.4, and subjects with >10% genotype missingness, we measured the association of each candidate SNP with CAD and its dependence on TGs as explained under Statistical Analysis in the Methods section. CAD indicates coronary artery disease; SNP, single nucleotide polymorphism; TGs, triglycerides.
rs2001844 Is an eQTL for TRIB1
Previous GWAS that used lymphoblastoid cells did not identify an eQTL for TRIB1 expression in the TG and CAD risk locus. To investigate a potential relationship in untransformed cells, Paxgene‐derived RNA was isolated from whole blood of 160 genotyped patients, and TRIB1 mRNA was quantified by qRT‐PCR (Figure 2B). These data indicate that rs2001844 is associated with TRIB1 mRNA expression as assessed by using a 1‐way ANOVA (P=0.035), with the risk genotype being associated with 20% lower expression of TRIB1 (AA versus BB, P=0.008, unpaired t test).
Identification of TRIBAL Transcripts 3′ of the CNS Region
Expression data from the ENSEMBL and UCSC databases revealed 2 distinct transcripts of unknown function (ie, ENST00000522815 and TCONS_00014852 [UCSC]) that were either juxtaposed or overlapping the CAD‐associated TG SNPs (Figure 3). Further, the corresponding putative gene ENSG00000253111 appeared to encode a third distinct transcript (ENST00000521991). All 3 transcripts consisted of multiple exons and appeared to lack protein coding potential, consistent with their classification as lncRNAs. In view of the close linear proximity of this locus to TRIB1, the functional association between both regions as assessed by previous GWAS, and the convolution of the existing nomenclature, we refer to the ENSG00000253111 locus as TRIBAL (TRIB1 associated locus) throughout this work. Reverse transcription PCR analysis detected a transcript encompassing 2 exons (designated exons 1 and 2) in HepG2 cells and, to a lesser extent, in peripheral blood mononuclear cells obtained from whole blood (Figure 4). Examination of the Illumina RNAseq data (Human Body Map) via the UCSC Genome Browser revealed expression of low abundance transcription over the 2 exons as determined by RNAseq.
Figure 3.

TRIBAL spliced variants. Top, exon distribution of the reported forms of TRIBAL observed in HepG2. Relative positions of coronary artery disease/triglycerides relevant single nucleotide polymorphisms are indicated with arrows. Conserved (CNS) region is in magenta. Bottom, TRIBAL forms identified by RACE in HepG2 cells. TRIBAL1 was the most consistently recovered version.
Figure 4.

Detection of a transcript containing TRIBAL exons 1 and 2 in HepG2 and peripheral blood mononuclear cells (PBMCs). TRIBAL transcripts were amplified from HepG2 (lane 1) and PBMCs (lane 2) RNA by reverse transcription PCR analysis using a pair of oligonucleotides matching exons 1 and 2 as described in the Methods section. The amplified products were visualized following agarose gel eletrophoresis and ethidium bromide detection. Lane 3 represents a non–reverse‐transcribed peripheral blood mononuclear cell control. Arrowhead indicates migration position of TRIBAL amplicons.
Implication of TRIBAL Transcription in TRIB1 Regulation
Due to the close proximity of this transcript to risk SNPs and the effect of rs2001844 on TRIB1 mRNA, we first investigated the potential role of TRIBAL in the regulation of TRIB1 transcription. We hypothesized that rs2001844 or a linked SNP could regulate TRIBAL expression level, which in turn might alter TRIB1 expression. Unfortunately, due to the very low expression level of TRIBAL in blood, we were not able to accurately quantify TRIBAL transcripts by using qRT‐PCR. Reporter constructs were thus used to determine the effects of rs2001844 on TRIBAL1 expression. Of note, the region encompassing rs2001844 displays epigenetic marks consistent with a regulatory function, including several acetylation and methylation marks, DNase I accessibility, and potential conserved transcription factor binding sites (UCSC browser and RegulomeDB). We reasoned that the risk SNP may alter promoter activity of the TRIBAL transcript. Transfection in COS‐7 and HepG2 cells indicated that the CNS region harbors weak promoter‐like activity, increasing basal transcription by a factor of 3‐ to 4‐fold over the promoter‐free constructs (Figure 5A). Further deleting the construct to the core CNS1 enhanced the activity somewhat, but further reduction gradually decreased its promoter activity (Figure 5B). The influence of the risk allele was then evaluated by comparing sequences derived from control subjects differing only in the rs2001844 allele (A or G). Of note, constructs containing the risk allele (A) displayed significantly less activity than the reference allele, suggesting that TRIBAL expression may be altered by rs2001844, an eQTL for TRIB1 expression as demonstrated earlier (Figure 5C).
Figure 5.

Characterization of the conserved region proximal to the TRIBAL1 transcript. A, HepG2 and COS‐7 cells were transfected with empty pGL3 basic or pGL3 basic harboring the ≈500‐bp region located 28 kb 3′ of TRIB1. Plasmids were cotransfected with pRL‐SV40. Luciferase (firefly and renilla) activity was measured 24 hours posttransfection. B, Same as in A except 3′ deletions of the 406‐bp region were tested. C, Substitution of the risk allele in pGL3p211 blunts promoter activity. Oligonucleotides used to generate the truncations are described in the supplemental sequence information. Values were first normalized to pGL3 (set to 1) and then averaged across 3 biologic replicates. Differences with the control (pGL3 or Reference [G], as appropriate) were all statistically significant. Error bars represent 95% CIs. RLU indicates relative light units.
Identification of Multiple TRIBAL Transcripts in HepG2 Cells
Expression data indicated the presence of transcripts containing both exons 1 and 2 but fell short of addressing whether the transcript(s) extended further, as hinted by the several forms reported in publicly available data. To obtain a complete TRIBAL sequence, we performed 5′ and 3′ RACE to extend in both directions from exon 1 in HepG2 cells. The 5′ RACE extended exon 1 somewhat over the available sequences but identified no additional exons. The 3′ RACE, on the other hand, identified multiple novel exons and corresponding transcripts, covering a genomic span of ≈60 kbp (Figure 3 and supplemental sequence information). Conservation analysis revealed TRIBAL exons to be poorly conserved (Figure 6). Of the transcripts recovered, those consisting of exons 1, 2, and 7 were the most frequent. Cellular fractionation of HepG2 cells demonstrated a clear nuclear enrichment of TRIBAL relative to PPIA, on par with that of the snRNA U1, as well as a relatively short half‐life of ≈2 hours (Figure 7).
Figure 6.

Mouse and human sequences were aligned using PIPmaker (http://www.bx.psu.edu/miller_lab/). Position of the human exons are shown on top, numbered 1 to 7. Note that the exons identified in human correspond to poorly conserved regions.
Figure 7.

TRIBAL transcripts reside in the nucleus and display a moderately short half‐life. A, Localization of TRIBAL transcripts. TRIBAL, PPIA, and U1 RNAs were quantified by qRT‐PCR in total HepG2 lysates and isolated nuclei. Relative nuclear abundance (defined as nuclear over total signal) was measured for all 3 transcripts by qRT‐PCR and nuclear enrichment is expressed relative to U1 and PPIA nuclear signals. B, Stability of TRIBAL transcripts. Abundance of GAPDH, ANRIL (another long noncoding RNA), and TRIBAL transcripts in HepG2 cells treated with actinomycin D (5 μg/mL) for the indicated time, as assessed by qRT‐PCR. Data are the average of 3 experiments. Error bars represent 95% CIs. GAPDH indicates glyceraldehyde‐3‐phosphate dehydrogenase; PPIA, Peptidylprolyl Isomerase A; qRT‐PCR, quantitative reverse transcription polymerase chain reaction; TRIBAL, TRIB1‐associated locus.
Effect of Expression of TRIBAL Transcripts on TRIB1 Expression
Localization of TRIBAL to the nucleus hinted at a gene regulatory function. While these results suggested that TRIBAL transcription might regulate TRIB1 levels, they did not address whether the transcripts themselves played any role in the process. To test the contribution of the TRIBAL transcripts to TRIB1 expression, TRIBAL expression was attenuated by using an antisense oligonucleotide targeting exon 1 (Figure 8A). A ≈60% reduction in TRIBAL abundance resulted in a ≈10% decrease in TRIB1 in Huh7 cells and primary human hepatocytes, reaching statistical significance only in Huh7 cells; HepG2 cells, in contrast, showed no significant change. In view of the incomplete downregulation leading to possible threshold effects, the impact of TRIBAL overexpression was investigated. Among the various TRIBAL forms identified earlier, TRIBAL1 was selected since it represented the most frequently isolated transcript by RACE, presumably reflecting higher endogenous levels and greater biologic significance. Introduction of high levels of TRIBAL1 had no significant impact on TRIB1 mRNA levels in any of the human hepatic cell types studied (Figure 8B). Thus, the overexpression data are inconsistent with a direct role of TRIBAL in TRIB1 regulation. To further probe the interplay between the 2 genes, we next investigated the impact of TRIB1 knock‐down on TRIBAL. We reasoned that TRIBAL might regulate TRIB1 chiefly under conditions where the latter is perturbed. Notably, TRIB1 knock‐down strongly stimulated TRIBAL expression in HepG2 and primary human hepatocytes (Figure 8C).
Figure 8.

Modulation of TRIBAL transcript levels fails to impact TRIB1 mRNA abundance. A, Knock‐down of TRIBAL lncRNA. Cells were incubated for 48 hours prior harvest with a TRIBAL‐targeting oligonucleotide or a control oligonucleotide (NT). B, Overexpression of TRIBAL1 in primary human hepatocytes and HepG2. HepG2 cells and primary human hepatocytes were infected with TRIBAL1‐expressing (or control) lentivirus. HepG2 and Huh7 clones were stably selected with puromycin while hepatocytes were harvested 48 hours post infection. C, Knock‐down of TRIB1 increases TRIBAL transcript levels; the same ss in A except that TRIB1 was targeted with an antisense nucleotide against TRIB1. Values were normalized to the NT (A and C) or empty vector (B). Numbers shown represent the average of 3 or 4 experiments. *Statistically significant change from the respective nontarget (NT: A and C) or empty vector (B) control values. TRIBAL indicates TRIB1‐associated locus.
Absence of Specific TRIBAL Transcript Recruitment to TRIB1
Given the nonreciprocal effects of TRIBAL and TRIB1 expression, we next determined the occupancy of TRIBAL on TRIB1 by using chromatin RNA immunoprecipitation (ChIRP). Presence of TRIBAL on the TRIB1 regulatory sequences might offer a mechanism of transcriptional regulation that could be turned on or off in response to appropriate cellular cues. We focused our efforts on TRIBAL1‐overexpressing cells as detection of the endogenous transcript was difficult due to the combination of low expression levels and cross‐linking conditions. To ensure specificity, ChIRP uses 2 distinct pools of oligonucleotides, and a pull‐down qualifies as genuine if, and only if, both sets of target‐specific oligonucleotides lead to similar enrichment. While TRIBAL1 was indeed isolated and markedly enriched relative to PPIA, we found no evidence of preferential association of TRIBAL1 in or adjacent to the TRIB1 promoter region (Figure 9). Consistent with the lack of preferential recruitment, there was no evidence of TRIB1 promoter regulation by TRIBAL1 in reporter assay experiments (Figure 10).
Figure 9.

No preferential TRIBAL1 association with TRIB1 genomic regions. ChIRP analysis was performed on HepG2 cells overexpressing TRIBAL1 using 2 sets of nonoverlapping biotinylated oligonucleotides reverse complement to the TRIBAL1 transcript. A, qRT‐PCR analysis. TRIBAL1 enrichment achieved with both sets of oligonucleotides (solid, set 1 and open bars, set 2) over beads alone. As a control, GAPDH shows no enrichment. B, qPCR amplification of the DNA fraction associated with the TRIBAL1 pull‐down. Two unrelated promoter regions (GAPDH and ZNF572) serve as non‐specific controls. Data shown are representative of 4 independent experiments. TRIBAL indicates TRIB1‐associated locus.
Figure 10.

TRIBAL1 overexpression fails to affect TRIB1 promoter activity. Indicated pGL3‐derived constructs were transfected in HepG2 cells (12‐well plate), and luciferase and renilla luminescence were measured 24 hours later. pTRIB1 contains a 1.9‐kb fragment of the Trib1 promoter region (see supplemental sequence information for the PCR primers used). PLVXTRIBAL1 (TRIBAL1) or PLVX (Vector) (0.35 μg) was included where indicated. Data are normalized to pRL‐SV40 included as internal transfection control, and data are expressed relative to pTRIB1 (0.15 μg). pGL3 basic and pGL3 promoter (SV40 promoter) are shown for comparison. PLVXTRIBAL1 transfection resulted in >1000 fold‐increase over endogenous levels. PCR indicates polymerase chain reaction; TRIBAL, TRIB1‐associated locus.
Key Lipid Metabolism Regulatory Genes Are Unaffected by Perturbations of TRIBAL in Huh7 Cells
While these results indicated a subtle interaction between TRIBAL transcripts and TRIB1, they did not address possible TRIB1‐independent contributions of TRIBAL to lipid metabolism. To address this point, the expression levels of several key genes, including several previously demonstrated to be affected by TRIB1 downregulation,7 were tested in response to TRIBAL downregulation and overexpression. Reducing TRIBAL expression by ≈60% in Huh7 or increasing expression by >100‐fold had no significant impact on any lipid regulatory genes tested (Figure 11). Thus, despite the link between rs2001844 and plasma TGs, the TRIBAL transcript does not appear to directly affect the expression of key hepatic lipid regulatory genes.
Figure 11.

Expression levels of lipid metabolism genes are not affected by changes in TRIBAL message level. Transcription of the indicated genes was assessed in Huh7 by qRT‐PCR following targeting of TRIBAL lncRNA with antisense oligonucleotides (ASO) or stable overexpression of TRIBAL1 (O/E) generated by lentiviral infection. Incubation with the ASO was performed for 48 hours before cell harvest. Data are normalized to corresponding nontarget (ASO vs NT) or empty vector (O/E vs PLVX). Data represent the average of 3 biologic replicates ±95% CIs. *Statistically significant change. TRIBAL1 expression was increased 151‐fold (±48, 95% CI). ACC1 indicates Acetyl‐CoA Carboxylase Alpha; ACOX1, Acyl‐CoA Oxidase 1, Palmitoyl; APOB, apolipoprotein B; CPT1A, Carnitine Palmitoyltransferase 1A; DGAT2, Diacylglycerol O‐Acyltransferase 2; FASN, fatty acid synthase; MTTP, Microsomal Triglyceride Transfer Protein; SCD1, Stearoyl‐CoA Desaturase (Delta‐9‐Desaturase); SREBP‐1, Sterol Regulatory Element Binding Transcription Factor 1; TRIBAL, TRIB1‐associated locus.
Implication of TRIBAL in Small GTPase and G Protein–Coupled Signaling
With the limited impact of TRIBAL level manipulation on key lipid genes and TRIB1 expression, the search for putative targets was broadened. First, interrogations of public databases (CSG, University of Michigan; ScanDB) with rs2001844 or rs2001845 failed to reveal any genome‐wide significant (P<5×10⁻⁸) genetic associations. In view of the paucity of information obtained from these early efforts, microarray analyses of transcriptional responses to TRIBAL perturbation were performed. Changes in response to TRIBAL downregulation were first assessed; Huh7 were used rather than HepG2 because the former exhibited more extensive and consistent downregulation of TRIBAL. In addition to TRIBAL itself (not shown), only 2 targets with large (>1.5) absolute changes were observed, both lncRNA of unknown function (Table 3). Next, the transcriptional impact of TRIBAL1 overexpression was examined by using stable HepG2‐derived cell lines. Again, no protein coding genes exhibited a >1.5‐fold change (Table 3). However, several piwi RNAs (piRNA) were identified, as well as SNORD109B, the only indexed protein coding gene to exhibit a >1.5‐fold change. Of interest, SNORD109B, although poorly characterized, has been implicated in Prader–Willi disease, a syndromic obesity phenotype.
Table 3.
Changes in Response to TRIBAL Levels Assessed by Transcription Array Analyses
| Transcript Cluster ID | Fold Change (Linear) | Gene Symbol |
|---|---|---|
| TRIBAL1 O/E | ||
| DQ599087,uc001nas.1 | −2.62 | — |
| Small nucleolar RNA, C/D box 109B | −1.90 | SNORD109B |
| DQ590525,uc001jym.1 | −1.81 | — |
| DQ597713,uc004alm.2 | −1.72 | — |
| DQ577812,uc021qhx.1 | −1.68 | — |
| DQ589460,uc010rgf.2 | −1.62 | — |
| JA202363,uc022bun.1 | 1.50 | — |
| OTTHUMT00000006709/lnc‐OR4F29‐3 | 1.51 | — |
| DQ577137,uc001xwa.3 | 1.74 | — |
| DQ594093,uc021vmi.1 | 1.84 | — |
| TRIBAL knock‐down | ||
| lincRNA:chr21:44907688‐44909690 forward strand | −2.32 | — |
| lincRNA:chr7:29652000‐29661000 forward strand | 2.36 | — |
Transcripts displaying greater than 1.5× linear changes in response to TRIBAL1 overexpression (TRIBAL1 O/E) or TRIBAL knock‐down are listed.
Limiting the analysis to >1.5‐fold changes might miss small yet biologically relevant differences. To obtain a global picture of the changes entailed, DAVID analyses (http://david.abcc.ncifcrf.gov/) were performed on the top statistically significant changes (adjusted P<0.05) from both analyses. Down‐regulation of TRIBAL resulted (false discovery rate <0.05) in perturbation of genes involved in small GTPase regulation, while TRIBAL1 overexpression was associated with G protein–coupled receptor (GPCR) signaling (Table 4), suggesting that TRIBAL may impinge on GTP metabolism.
Table 4.
Analyses of Statistically Significant Changes According to the Database for Annotation, Visualization and Integrated Discovery (DAVID)
| Category | Term | P Value | Fold | FDR |
|---|---|---|---|---|
| TRIBAL1 O/E | ||||
| GOTERM_BP_FAT | GO:0007186~G protein–coupled receptor protein | 4E–07 | 2.8 | 6.42E–04 |
| REACTOME | REACT_14797:Signaling by GPCR | 1.7E–06 | 3.2 | 1.06E–03 |
| GOTERM_BP_FAT | GO:0007166~cell surface receptor linked signal transduction | 1.1E–05 | 2.1 | 1.81E–02 |
| TRIBAL knock‐down | ||||
| GOTERM_BP_FAT | GO:0032318~regulation of Ras GTPase activity | 1.4E–05 | 3.5 | 2.45E–02 |
| GOTERM_BP_FAT | GO:0051056~regulation of small GTPase mediated signal | 2.3E–05 | 2.4 | 4.05E–02 |
Genes with significantly affected changes (without correction for multiple testing) following TRIBAL1 overexpression (O/E) or knock‐down were analyzed for pathway enrichment. Pathways that are significantly enriched (FDR <0.05) are shown. FDR indicates false discovery rate; fold, fold enrichment.
Multiple Pathways Affected by TRIBAL Overexpression Revealed by Promoter Arrays
These experiments focused on transcriptional regulation, which constitutes one of several layers of biologic homeostasis. To obtain a more complete picture of the potential role of TRIBAL, we explored the impact of TRIBAL on posttranscriptional regulation by using Cignal Reporter Arrays (SABiosciences); these are designed to probe the status of several pathways simultaneously by measuring the activity of promoter elements functionally validated for each pathway. Of the 45 pathways tested, TRIBAL1 overexpression in HepG2 and Huh7 hepatoma cells impinged on several distinct pathways (P<0.05) (Figure 12). In addition, using less stringent criteria (P<0.1 for at least 1 cell type), shared pathway trends across the 2 cell types (KLF4, JNK, Oct4) emerged.
Figure 12.

Long‐term impact of TRIBAL1 overexpression. HepG2 (black bars) and Huh7 (white bars) cells, stably expressing TRIBAL1 or vector (PLVX) alone were assessed for pathway activation status using Cignal Reporter arrays. Relative reporter activity (firefly/renilla) was divided by the PLVX infected population values. Values represent the mean of 3 biologic replicates ±95% CI. Overexpression of TRIBAL1 increased TRIBAL signal ≈200 for Huh7 and 800× for HepG2. Data shown focus on pathways trending toward significance (of 45 total pathways tested) in either cell type (P<0.1, 2‐tailed Student's t test). *Statistically significant changes (P<0.05). ER indicates Endoplasmic reticulum; EGR1, Early growth response protein 1; KLF4, Kruppel‐Like Factor 4; MAPK, mitogen‐activated protein kinase; Jnk, c‐Jun N‐terminal kinase; MEF2, myocyte enhancer factor‐2; TGFbeta, Transforming Growth Factor Beta; TRIBAL, TRIB1‐associated locus.
Discussion
In an investigation of the functional relationship of a noncoding region at 8q24.13, downstream from the TRIB1 gene, to plasma TG and CAD risk, we have identified and characterized a novel gene locus (TRIBAL) that codes for multiple lncRNA splice variants. In addition, we demonstrate that TRIBAL contains a conserved promoter region in tight LD with risk SNPs previously identified in multiple GWAS. Furthermore, we identify an SNP, rs2001844, within the 5′ region of TRIBAL that alters promoter activity and is associated with: plasma TG concentrations, TRIB1 expression in blood cells of healthy subjects, and the risk for CAD. These findings provide a partial mechanistic link between the TRIB1 locus and CAD risk. Before this work, a direct association of TRIB1 with plasma TG and CAD risk was inferred from mouse models of Trib1 knock‐down and overexpression under the assumption that the risk locus exerted its effects via TRIB1. While the relative linear proximity of TRIB1 and TRIBAL makes a cis regulation model appealing, the complex architecture of the genome permits long‐range interactions that could equally account for the relationship of the TRIBAL region to plasma lipids and CAD.29
While not identified in the original GWAS for TG or CAD, subsequent to our analysis, a gene‐centric meta‐analysis of plasma lipid traits identified rs2001844 as having the largest effect size of the 40 SNPs investigated in this region.28 In addition, analysis of rs2001844 predicted function by RegulomeDB yields a relatively high score (2b) consistent with a functional role and, notably, rs2001844 is the only reported common SNP within the CNS region that has the potential to alter cognate regulatory motifs (HaploReg). More specifically, a G (reference)‐to‐A (risk) substitution, associated with a decrease in TRIBAL promoter activity in our assays, is predicted to significantly decrease association of the p300 coactivator and promote heat shock gactor binding. Interestingly, p300 was found to interact with a DNA fragment matching exon 1 of TRIBAL by ChIP‐seq in both HepG2 and HeLa cells (ENCODE).
Our data appear globally consistent with a previous report,7 demonstrating that Trib1 deficiency in mice results in increased plasma TG. More specifically, the current study demonstrates that the CAD risk SNPs are associated with increased plasma TGs and decreased TRIB1 in the blood of normolipemic subjects, consistent with, but by no means proof of, an atheroprotective role for TRIB1 in humans. Burkhardt et al7 demonstrated a profound influence of hepatocyte Trib1 on murine TG metabolism. The specific contributions of hepatic TRIB1 expression to these processes in human hepatocytes remain to be addressed, but it is important to note that the TG risk SNPs at the human TRIB1 locus are also linked to hepatic steatosis, implicating effects mediated by altered hepatic lipogenesis, fatty acid oxidation, or VLDL assembly and secretion.30 Extrahepatic roles are also plausible. Satoh et al7 uncovered novel metabolic roles for Trib1 that extend into the macrophage compartment, in turn affecting adipocyte metabolism. Given the association of risk SNPs with TRIB1 expression in PBMCs observed here, the role of Trib1 in macrophages is of interest to our understanding of this locus.
The data presented here demonstrate that TRIBAL responds to altered expression of TRIB1 but are not supportive of a role for TRIBAL transcripts in the regulation of hepatocyte TRIB1. Manipulation of TRIBAL1 transcript abundance by antisense or overexpression approaches failed to alter TRIB1 in a consistent manner, although a small effect was observed in the Huh7 hepatocyte cell line. Results from overexpression experiments are largely consistent with the knock‐down data and are indicative of functional independence of the 2 transcripts. In addition, we did not detect specific recruitment of TRIBAL1 to the TRIB1 promoter in HepG2 cells. By analogy with transcription factors where occupancy is not tantamount to gene regulation, TRIBAL transcripts could be recruited to chromatin in a primed but inactive state. The data presented here are inconsistent with this model, although there remains the possibility that TRIBAL1 may interact with TRIB1 via a regulatory region that we have not examined. ChIRP experiments were designed to interrogate regions proximal to the TRIB1 promoter and did not provide evidence of binding at or upstream of the 5′ sequence of TRIB1. To extend these findings, in future experiments we will use a ChIRPseq system31 to identify genome‐wide TRIBAL1 chromatin binding sites. One additional caveat to the overexpression approach is that we selected one of several identified TRIBAL transcript variants. Analogous to several other lncRNAs, TRIBAL transcripts are subject to alternative splicing and it is unclear whether the “major” form identified so far is the most biologically relevant in human hepatocytes. Clearly, a full understanding of the relationship among TRIBAL, TRIB1, and CAD/TG will necessitate further characterization of the various TRIBAL transcripts, in hepatocytes as well as in other CAD‐relevant tissues.
As proposed previously for other poorly conserved lncRNA, TRIBAL expression may simply arise from transcriptional noise secondary to local and transient chromatin opening,32 and the GWAS locus regulation may not necessitate specific, or even any, TRIBAL transcripts. Rather, the unwinding itself, with no obligate transcription, could act as a TRIB1 locus regulatory switch via an enhancer‐like looping mechanism for instance.33 It is possible that the increased TRIBAL abundance observed following TRIB1 knock‐down is a byproduct of a local chromatin rearrangement aimed at restoring TRIB1 mRNA levels. According to some estimates, up to 40% of the genome may harbor enhancer‐like functions.29 Interestingly, the CNS region shares chromatin features found, albeit not exclusively, in weak enhancers according to publicly available ENCODE data. Early studies in our laboratories using TRIB1 promoter reporter constructs have thus far identified no such activity (Figure 13). However, while this manuscript was in revision, Ishizuka et al34 reported that the poorly conserved region immediately downstream of the CNS region, roughly spanning exon 1 and intron 1 of TRIBAL, harbors enhancer‐like activity in transient reporter assays. Certainly, these experiments point to a possible functional link between TRIBAL and TRIB1 but fall short of addressing whether the region identified affects endogenous TRIB1 (or TRIBAL) expression. Testing this model adequately requires in‐depth analyses probing the topology of the genome around the TRIB1 locus, in the presence of either TRIBAL control or risk alleles.
Figure 13.
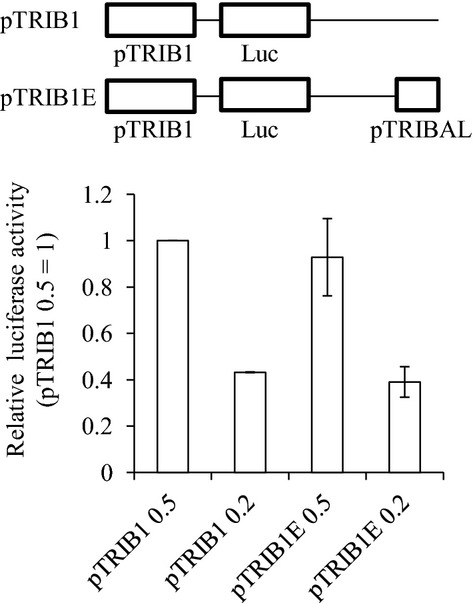
No measurable cis regulation by TRIBAL conserved region on TRIB1 promoter region. Indicated pGL3‐derived constructs were transfected in HepG2 cells, and levels of luciferase and renilla were measured 24 hours later. pTRIB1 contains a 1.9‐kb fragment of TRIB1 promoter region. pTRIBAL corresponds to a 497‐bp fragment encompassing the conserved TRIBAL promoter region. Amounts transfected are indicated (12‐well plates; μg). Data are normalized to pRL‐SV40 and expressed relative to the “pTRIB1 0.5″ values. Data represent the mean of 2 experiments (±95% CIs) and are representative of 3. TRIBAL indicates TRIB1‐associated locus.
Further arguing against transcriptional noise, our analyses reveal that perturbation of expression by TRIBAL knock‐down or TRIBAL1 overexpression resulted into systematic expression changes in transcripts associated with small monomeric Ras GTPases and GPCR signaling, respectively. Interestingly, Ras is a well‐characterized regulator of mitogen‐activated protein kinase signaling, which we have recently shown to be implicated in TRIB1 mRNA stability35 hinting that TRIBAL could affect TRIB1 levels in trans, via putative alterations in mitogen‐activated protein kinase kinase/extracellular signal‐regulated kinases signaling. The implication of mitogen‐activated protein kinases is consistent with the overexpression results as elements from both GPCR and Ras signaling can converge on mitogen‐activated protein kinase.36 In view of the lack of consistent effect of altered TRIBAL expression, TRIB1 mRNA levels in primary human hepatocytes or hepatocyte cell lines, any impact of TRIBAL in liver is likely to be modest. Nevertheless, these results point to potential regulatory nodes that may link TRIBAL to TRIB1 in extrahepatic settings.
Supplementary Material
Appendix qRT-PCR primers (forward primer first).
Sources of Funding
Funded by the Heart & Stroke Foundation of Canada (T‐7268 to McPherson). Dr Douvris was supported by a Canadian Institutes of Health Research Graduate Scholarship.
Disclosures
None.
Acknowledgments
We express our gratitude to the subjects who generously participated in this study and to Heather Doelle, BSc, MLT, who assisted in sample collection. We are also obliged to Richard Lee and ISIS pharmaceuticals for kindly providing us with the antisense oligonucleotides.
References
- 1.Chasman DI, Pare G, Mora S, Hopewell JC, Peloso G, Clarke R, Cupples LA, Hamsten A, Kathiresan S, Malarstig A, Ordovas JM, Ripatti S, Parker AN, Miletich JP, Ridker PM. Forty‐three loci associated with plasma lipoprotein size, concentration, and cholesterol content in genome‐wide analysis. PLoS Genet. 2009; 5:e1000730. [DOI] [PMC free article] [PubMed] [Google Scholar]
- 2.Waterworth DM, Ricketts SL, Song K, Chen L, Zhao JH, Ripatti S, Aulchenko YS, Zhang W, Yuan X, Lim N, Luan J, Ashford S, Wheeler E, Young EH, Hadley D, Thompson JR, Braund PS, Johnson T, Struchalin M, Surakka I, Luben R, Khaw KT, Rodwell SA, Loos RJ, Boekholdt SM, Inouye M, Deloukas P, Elliott P, Schlessinger D, Sanna S, Scuteri A, Jackson A, Mohlke KL, Tuomilehto J, Roberts R, Stewart A, Kesaniemi YA, Mahley RW, Grundy SM, McArdle W, Cardon L, Waeber G, Vollenweider P, Chambers JC, Boehnke M, Abecasis GR, Salomaa V, Jarvelin MR, Ruokonen A, Barroso I, Epstein SE, Hakonarson HH, Rader DJ, Reilly MP, Witteman JC, Hall AS, Samani NJ, Strachan DP, Barter P, van Duijn CM, Kooner JS, Peltonen L, Wareham NJ, McPherson R, Mooser V, Sandhu MS. Genetic variants influencing circulating lipid levels and risk of coronary artery disease. Arterioscler Thromb Vasc Biol. 2010; 30:2264-2276. [DOI] [PMC free article] [PubMed] [Google Scholar]
- 3.Willer CJ, Sanna S, Jackson AU, Scuteri A, Bonnycastle LL, Clarke R, Heath SC, Timpson NJ, Najjar SS, Stringham HM, Strait J, Duren WL, Maschio A, Busonero F, Mulas A, Albai G, Swift AJ, Morken MA, Narisu N, Bennett D, Parish S, Shen H, Galan P, Meneton P, Hercberg S, Zelenika D, Chen WM, Li Y, Scott LJ, Scheet PA, Sundvall J, Watanabe RM, Nagaraja R, Ebrahim S, Lawlor DA, Ben‐Shlomo Y, vey‐Smith G, Shuldiner AR, Collins R, Bergman RN, Uda M, Tuomilehto J, Cao A, Collins FS, Lakatta E, Lathrop GM, Boehnke M, Schlessinger D, Mohlke KL, Abecasis GR. Newly identified loci that influence lipid concentrations and risk of coronary artery disease. Nat Genet. 2008; 40:161-169. [DOI] [PMC free article] [PubMed] [Google Scholar]
- 4.Teslovich TM, Musunuru K, Smith AV, Edmondson AC, Stylianou IM, Koseki M, Pirruccello JP, Ripatti S, Chasman DI, Willer CJ, Johansen CT, Fouchier SW, Isaacs A, Peloso GM, Barbalic M, Ricketts SL, Bis JC, Aulchenko YS, Thorleifsson G, Feitosa MF, Chambers J, Orho‐Melander M, Melander O, Johnson T, Li X, Guo X, Li M, Shin CY, Jin GM, Jin KY, Lee JY, Park T, Kim K, Sim X, Twee‐Hee OR, Croteau‐Chonka DC, Lange LA, Smith JD, Song K, Hua ZJ, Yuan X, Luan J, Lamina C, Ziegler A, Zhang W, Zee RY, Wright AF, Witteman JC, Wilson JF, Willemsen G, Wichmann HE, Whitfield JB, Waterworth DM, Wareham NJ, Waeber G, Vollenweider P, Voight BF, Vitart V, Uitterlinden AG, Uda M, Tuomilehto J, Thompson JR, Tanaka T, Surakka I, Stringham HM, Spector TD, Soranzo N, Smit JH, Sinisalo J, Silander K, Sijbrands EJ, Scuteri A, Scott J, Schlessinger D, Sanna S, Salomaa V, Saharinen J, Sabatti C, Ruokonen A, Rudan I, Rose LM, Roberts R, Rieder M, Psaty BM, Pramstaller PP, Pichler I, Perola M, Penninx BW, Pedersen NL, Pattaro C, Parker AN, Pare G, Oostra BA, O'Donnell CJ, Nieminen MS, Nickerson DA, Montgomery GW, Meitinger T, McPherson R, McCarthy MI, McArdle W, Masson D, Martin NG, Marroni F, Mangino M, Magnusson PK, Lucas G, Luben R, Loos RJ, Lokki ML, Lettre G, Langenberg C, Launer LJ, Lakatta EG, Laaksonen R, Kyvik KO, Kronenberg F, Konig IR, Khaw KT, Kaprio J, Kaplan LM, Johansson A, Jarvelin MR, Janssens AC, Ingelsson E, Igl W, Kees HG, Hottenga JJ, Hofman A, Hicks AA, Hengstenberg C, Heid IM, Hayward C, Havulinna AS, Hastie ND, Harris TG, Haritunians T, Hall AS, Gyllensten U, Guiducci C, Groop LC, Gonzalez E, Gieger C, Freimer NB, Ferrucci L, Erdmann J, Elliott P, Ejebe KG, Doring A, Dominiczak AF, Demissie S, Deloukas P, de Geus EJ, de FU, Crawford G, Collins FS, Chen YD, Caulfield MJ, Campbell H, Burtt NP, Bonnycastle LL, Boomsma DI, Boekholdt SM, Bergman RN, Barroso I, Bandinelli S, Ballantyne CM, Assimes TL, Quertermous T, Altshuler D, Seielstad M, Wong TY, Tai ES, Feranil AB, Kuzawa CW, Adair LS, Taylor HA, Borecki IB, Gabriel SB, Wilson JG, Holm H, Thorsteinsdottir U, Gudnason V, Krauss RM, Mohlke KL, Ordovas JM, Munroe PB, Kooner JS, Tall AR, Hegele RA, Kastelein JJ, Schadt EE, Rotter JI, Boerwinkle E, Strachan DP, Mooser V, Stefansson K, Reilly MP, Samani NJ, Schunkert H, Cupples LA, Sandhu MS, Ridker PM, Rader DJ, van Duijn CM, Peltonen L, Abecasis GR, Boehnke M, Kathiresan S. Biological, clinical and population relevance of 95 loci for blood lipids. Nature. 2010; 466:707-713. [DOI] [PMC free article] [PubMed] [Google Scholar]
- 5.Kathiresan S, Willer CJ, Peloso GM, Demissie S, Musunuru K, Schadt EE, Kaplan L, Bennett D, Li Y, Tanaka T, Voight BF, Bonnycastle LL, Jackson AU, Crawford G, Surti A, Guiducci C, Burtt NP, Parish S, Clarke R, Zelenika D, Kubalanza KA, Morken MA, Scott LJ, Stringham HM, Galan P, Swift AJ, Kuusisto J, Bergman RN, Sundvall J, Laakso M, Ferrucci L, Scheet P, Sanna S, Uda M, Yang Q, Lunetta KL, Dupuis J, de Bakker PI, O'Donnell CJ, Chambers JC, Kooner JS, Hercberg S, Meneton P, Lakatta EG, Scuteri A, Schlessinger D, Tuomilehto J, Collins FS, Groop L, Altshuler D, Collins R, Lathrop GM, Melander O, Salomaa V, Peltonen L, Orho‐Melander M, Ordovas JM, Boehnke M, Abecasis GR, Mohlke KL, Cupples LA. Common variants at 30 loci contribute to polygenic dyslipidemia. Nat Genet. 2009; 41:56-65. [DOI] [PMC free article] [PubMed] [Google Scholar]
- 6.Varbo A, Benn M, Tybjaerg‐Hansen A, Grande P, Nordestgaard BG. TRIB1 and GCKR polymorphisms, lipid levels, and risk of ischemic heart disease in the general population. Arterioscler Thromb Vasc Biol. 2011; 31:451-457. [DOI] [PubMed] [Google Scholar]
- 7.Burkhardt R, Toh SA, Lagor WR, Birkeland A, Levin M, Li X, Robblee M, Fedorov VD, Yamamoto M, Satoh T, Akira S, Kathiresan S, Breslow JL, Rader DJ. Trib1 is a lipid‐ and myocardial infarction‐associated gene that regulates hepatic lipogenesis and VLDL production in mice. J Clin Invest. 2010; 120:4410-4414. [DOI] [PMC free article] [PubMed] [Google Scholar]
- 8.Satoh T, Kidoya H, Naito H, Yamamoto M, Takemura N, Nakagawa K, Yoshioka Y, Morii E, Takakura N, Takeuchi O, Akira S. Critical role of Trib1 in differentiation of tissue‐resident M2‐like macrophages 150. Nature. 2013; 495:524-528. [DOI] [PubMed] [Google Scholar]
- 9.Ostertag A, Jones A, Rose AJ, Liebert M, Kleinsorg S, Reimann A, Vegiopoulos A, Berriel DM, Strzoda D, Yamamoto M, Satoh T, Akira S, Herzig S. Control of adipose tissue inflammation through TRB1 95. Diabetes. 2010; 59:1991-2000. [DOI] [PMC free article] [PubMed] [Google Scholar]
- 10.Angyal A, Kiss‐Toth E. The tribbles gene family and lipoprotein metabolism. Curr Opin Lipidol. 2012; 23:122-126. [DOI] [PubMed] [Google Scholar]
- 11.Yoshida A, Kato JY, Nakamae I, Yoneda‐Kato N. COP1 targets C/EBPalpha for degradation and induces acute myeloid leukemia via Trib1. Blood. 2013; 122:1750-1760. [DOI] [PubMed] [Google Scholar]
- 12.Naiki T, Saijou E, Miyaoka Y, Sekine K, Miyajima A. TRB2, a mouse Tribbles ortholog, suppresses adipocyte differentiation by inhibiting AKT and C/EBPbeta. J Biol Chem. 2007; 282:24075-24082. [DOI] [PubMed] [Google Scholar]
- 13.Deng J, James CH, Patel L, Smith A, Burnand KG, Rahmoune H, Lamb JR, Davis B. Human tribbles homologue 2 is expressed in unstable regions of carotid plaques and regulates macrophage IL‐10 in vitro. Clin Sci (Lond). 2009; 116:241-248. [DOI] [PubMed] [Google Scholar]
- 14.Qi L, Heredia JE, Altarejos JY, Screaton R, Goebel N, Niessen S, Macleod IX, Liew CW, Kulkarni RN, Bain J, Newgard C, Nelson M, Evans RM, Yates J, Montminy M. TRB3 links the E3 ubiquitin ligase COP1 to lipid metabolism. Science. 2006; 312:1763-1766. [DOI] [PubMed] [Google Scholar]
- 15.Flynn RA, Chang HY. Active chromatin and noncoding RNAs: an intimate relationship. Curr Opin Genet Dev. 2012; 22:172-178. [DOI] [PMC free article] [PubMed] [Google Scholar]
- 16.Wang KC, Chang HY. Molecular mechanisms of long noncoding RNAs. Mol Cell. 2011; 43:904-914. [DOI] [PMC free article] [PubMed] [Google Scholar]
- 17.Ulitsky I, Bartel DP. lincRNAs: genomics, evolution, and mechanisms. Cell. 2013; 154:26-46. [DOI] [PMC free article] [PubMed] [Google Scholar]
- 18.Khalil AM, Guttman M, Huarte M, Garber M, Raj A, Rivea MD, Thomas K, Presser A, Bernstein BE, van OA, Regev A, Lander ES, Rinn JL. Many human large intergenic noncoding RNAs associate with chromatin‐modifying complexes and affect gene expression. Proc Natl Acad Sci USA. 2009; 106:11667-11672. [DOI] [PMC free article] [PubMed] [Google Scholar]
- 19.Jeck WR, Sorrentino JA, Wang K, Slevin MK, Burd CE, Liu J, Marzluff WF, Sharpless NE. Circular RNAs are abundant, conserved, and associated with ALU repeats. RNA. 2013; 19:141-157. [DOI] [PMC free article] [PubMed] [Google Scholar]
- 20.Orom UA, Shiekhattar R. Long noncoding RNAs usher in a new era in the biology of enhancers. Cell. 2013; 154:1190-1193. [DOI] [PMC free article] [PubMed] [Google Scholar]
- 21.Kung JT, Colognori D, Lee JT. Long noncoding RNAs: past, present, and future. Genetics. 2013; 193:651-669. [DOI] [PMC free article] [PubMed] [Google Scholar]
- 22.Rinn JL, Kertesz M, Wang JK, Squazzo SL, Xu X, Brugmann SA, Goodnough LH, Helms JA, Farnham PJ, Segal E, Chang HY. Functional demarcation of active and silent chromatin domains in human HOX loci by noncoding RNAs. Cell. 2007; 129:1311-1323. [DOI] [PMC free article] [PubMed] [Google Scholar]
- 23.Chu C, Qu K, Zhong FL, Artandi SE, Chang HY. Genomic maps of long noncoding RNA occupancy reveal principles of RNA‐chromatin interactions. Mol Cell. 2011; 44:667-678. [DOI] [PMC free article] [PubMed] [Google Scholar]
- 24.Benjamini Y, Hochberg Y. Controlling the False Discovery Rate: a Practical and Powerful Approach to Multiple Testing. Journal of the Royal Statistical Society. 1995. B289-300. [Google Scholar]
- 25.Purcell S, Neale B, Todd‐Brown K, Thomas L, Ferreira MA, Bender D, Maller J, Sklar P, de Bakker PI, Daly MJ, Sham PC. PLINK: a tool set for whole‐genome association and population‐based linkage analyses. Am J Hum Genet. 2007; 81:559-575. [DOI] [PMC free article] [PubMed] [Google Scholar]
- 26.Price AL, Patterson NJ, Plenge RM, Weinblatt ME, Shadick NA, Reich D. Principal components analysis corrects for stratification in genome‐wide association studies. Nat Genet. 2006; 38:904-909. [DOI] [PubMed] [Google Scholar]
- 27.Kim YJ, Go MJ, Hu C, Hong CB, Kim YK, Lee JY, Hwang JY, Oh JH, Kim DJ, Kim NH, Kim S, Hong EJ, Kim JH, Min H, Kim Y, Zhang R, Jia W, Okada Y, Takahashi A, Kubo M, Tanaka T, Kamatani N, Matsuda K, Park T, Oh B, Kimm K, Kang D, Shin C, Cho NH, Kim HL, Han BG, Lee JY, Cho YS. Large‐scale genome‐wide association studies in East Asians identify new genetic loci influencing metabolic traits. Nat Genet. 2011; 43:990-995. [DOI] [PubMed] [Google Scholar]
- 28.Asselbergs FW, Guo Y, van Iperen EP, Sivapalaratnam S, Tragante V, Lanktree MB, Lange LA, Almoguera B, Appelman YE, Barnard J, Baumert J, Beitelshees AL, Bhangale TR, Chen YD, Gaunt TR, Gong Y, Hopewell JC, Johnson T, Kleber ME, Langaee TY, Li M, Li YR, Liu K, McDonough CW, Meijs MF, Middelberg RP, Musunuru K, Nelson CP, O'Connell JR, Padmanabhan S, Pankow JS, Pankratz N, Rafelt S, Rajagopalan R, Romaine SP, Schork NJ, Shaffer J, Shen H, Smith EN, Tischfield SE, van der Most PJ, van Vliet‐Ostaptchouk JV, Verweij N, Volcik KA, Zhang L, Bailey KR, Bailey KM, Bauer F, Boer JM, Braund PS, Burt A, Burton PR, Buxbaum SG, Chen W, Cooper‐Dehoff RM, Cupples LA, deJong JS, Delles C, Duggan D, Fornage M, Furlong CE, Glazer N, Gums JG, Hastie C, Holmes MV, Illig T, Kirkland SA, Kivimaki M, Klein R, Klein BE, Kooperberg C, Kottke‐Marchant K, Kumari M, LaCroix AZ, Mallela L, Murugesan G, Ordovas J, Ouwehand WH, Post WS, Saxena R, Scharnagl H, Schreiner PJ, Shah T, Shields DC, Shimbo D, Srinivasan SR, Stolk RP, Swerdlow DI, Taylor HA, Jr, Topol EJ, Toskala E, van Pelt JL, van SJ, Yusuf S, Whittaker JC, Zwinderman AH, Anand SS, Balmforth AJ, Berenson GS, Bezzina CR, Boehm BO, Boerwinkle E, Casas JP, Caulfield MJ, Clarke R, Connell JM, Cruickshanks KJ, Davidson KW, Day IN, de Bakker PI, Doevendans PA, Dominiczak AF, Hall AS, Hartman CA, Hengstenberg C, Hillege HL, Hofker MH, Humphries SE, Jarvik GP, Johnson JA, Kaess BM, Kathiresan S, Koenig W, Lawlor DA, Marz W, Melander O, Mitchell BD, Montgomery GW, Munroe PB, Murray SS, Newhouse SJ, Onland‐Moret NC, Poulter N, Psaty B, Redline S, Rich SS, Rotter JI, Schunkert H, Sever P, Shuldiner AR, Silverstein RL, Stanton A, Thorand B, Trip MD, Tsai MY, Van der HP, van der SE, van der Schouw YT, Verschuren WM, Watkins H, Wilde AA, Wolffenbuttel BH, Whitfield JB, Hovingh GK, Ballantyne CM, Wijmenga C, Reilly MP, Martin NG, Wilson JG, Rader DJ, Samani NJ, Reiner AP, Hegele RA, Kastelein JJ, Hingorani AD, Talmud PJ, Hakonarson H, Elbers CC, Keating BJ, Drenos F. Large‐scale gene‐centric meta‐analysis across 32 studies identifies multiple lipid loci. Am J Hum Genet. 2012; 91:823-838. [DOI] [PMC free article] [PubMed] [Google Scholar]
- 29.de LW, Duboule D. Topology of mammalian developmental enhancers and their regulatory landscapes. Nature. 2013; 502:499-506. [DOI] [PubMed] [Google Scholar]
- 30.Speliotes EK, Yerges‐Armstrong LM, Wu J, Hernaez R, Kim LJ, Palmer CD, Gudnason V, Eiriksdottir G, Garcia ME, Launer LJ, Nalls MA, Clark JM, Mitchell BD, Shuldiner AR, Butler JL, Tomas M, Hoffmann U, Hwang SJ, Massaro JM, O'Donnell CJ, Sahani DV, Salomaa V, Schadt EE, Schwartz SM, Siscovick DS, Voight BF, Carr JJ, Feitosa MF, Harris TG, Fox CS, Smith AV, Kao WH, Hirschhorn JN, Borecki IB. Genome‐wide association analysis identifies variants associated with nonalcoholic fatty liver disease that have distinct effects on metabolic traits 148. PLoS Genet. 2011; 7:e1001324. [DOI] [PMC free article] [PubMed] [Google Scholar]
- 31.Chu C, Quinn J, Chang HY. Chromatin isolation by RNA purification (ChIRP). J Vis Exp. 2012; 61:3912. [DOI] [PMC free article] [PubMed] [Google Scholar]
- 32.Kowalczyk MS, Higgs DR, Gingeras TR. Molecular biology: RNA discrimination. Nature. 2012; 482:310-311. [DOI] [PubMed] [Google Scholar]
- 33.Gibcus JH, Dekker J. The hierarchy of the 3D genome. Mol Cell. 2013; 49:773-782. [DOI] [PMC free article] [PubMed] [Google Scholar]
- 34.Ishizuka Y, Nakayama K, Ogawa A, Makishima S, Boonvisut S, Hirao A, Iwasaki Y, Yada T, Yanagisawa Y, Miyashita H, Takahashi M, Iwamoto S. TRIB1 down‐regulates hepatic lipogenesis and glycogenesis via multiple molecular interactions. J Mol Endocrinol. 2014; 52:145-158. [DOI] [PubMed] [Google Scholar]
- 35.Soubeyrand S, Naing T, Martinuk A, McPherson R. ERK1/2 regulates hepatocyte Trib1 in response to mitochondrial dysfunction 1. Biochim Biophys Acta. 2013; 1833:3405-3414. [DOI] [PubMed] [Google Scholar]
- 36.Short SM, Boyer JL, Juliano RL. Integrins regulate the linkage between upstream and downstream events in G protein‐coupled receptor signaling to mitogen‐activated protein kinase. J Biol Chem. 2000; 275:12970-12977. [DOI] [PubMed] [Google Scholar]
Associated Data
This section collects any data citations, data availability statements, or supplementary materials included in this article.
Supplementary Materials
Appendix qRT-PCR primers (forward primer first).