

Abstract
Background
YKL‐40, encoded by the chitinase 3‐like 1 (CHI3L1) gene, is a chitinase‐like protein involved in innate immune function hypothesized to play a role in the progression of atherosclerosis that may have differential roles in myocardial infarction (MI), as compared to stroke.
Methods and Results
In a nested case‐control study conducted within a prospective cohort of 23 294 initially healthy women of European ancestry, we (1) measured plasma concentration of YKL‐40 among 359 participants who subsequently developed cardiovascular events and among 359 age‐, smoking‐, and hormone replacement therapy–matched participants who remained free of disease during 17 years of follow‐up, (2) compared effects of YKL‐40 on vascular risk to that associated with 3 alternative inflammatory biomarkers (high‐sensitivity C‐reactive protein) ([hsCRP], soluble intracellular adhesion molecule 1, and fibrinogen), and (3) evaluated the role of 41 single‐nucleotide polymorphisms (SNPs) in the chitinase 3‐like 1 gene (CHI3L1) as determinants of YKL‐40 levels and incident vascular events. YKL‐40 levels were higher in women with hypertension, diabetes, and obesity and correlated modestly with high‐density lipoprotein cholesterol, triglycerides, and hsCRP, but not with low‐density lipoprotein cholesterol. Baseline YKL‐40 level was significantly associated with incident thromboembolic stroke with a magnitude of effect (a 40% per quartile increase in odds ratio [OR], P=0.019) comparable to that of hsCRP (a 52% per quartile increase in OR, P=0.006). By contrast, no significant association was observed between YKL‐40 and incident MI. Genetic variation in CHI3L1 was strongly associated with YKL‐40 levels; however, in this sample set, we did not observe a statistically significant association between genotype and future vascular events.
Conclusions
Among initially healthy U.S. women, plasma levels of the proinflammatory chitenase‐like protein, YKL‐40, were influenced by environmental as well as genetic factors and predicted incident thromboembolic stroke, but not MI, a differential effect consistent with limited previous data.
Keywords: chitin, genetics, inflammation, innate immunity, myocardial infarction, stroke
Introduction
In addition to hyperlipidemia, inflammation is a major determinant of atherothrombosis, and plasma levels of inflammatory biomarkers, such as high‐sensitivity C‐reactive protein (hsCRP), interleukin‐6 (IL‐6), and soluble intracellular adhesion molecule type 1 (sICAM‐1), have long been known to associate with incident vascular events.1–2 In several studies, these biomarkers have been similarly associated with incident stroke as with incident myocardial infarction (IMI), an observation suggesting that a common proinflammatory condition is present in the cerebral, as well as coronary, vasculatures. However, just as low‐density lipoprotein cholesterol (LDL‐C) is a stronger predictor of myocardial infarction (MI) than stroke, it has conversely been observed, in some cohorts, that specific inflammatory biomarkers have a greater association with incident stroke than with coronary events.3–4
One recent example of a potential differential effect of inflammation in the cerebral and coronary circulations relates to the proinflammatory chitin‐, heparin‐, and collagen‐binding lectin known as YKL‐40 that is expressed in atherosclerotic plaques.5–7 In particular, investigators in the Copenhagen City Heart Study reported that elevated levels of plasma YKL‐40 were significantly associated with incident stroke among those with above median (P<0.001) as well as below median (P=0.02) levels of hsCRP, whereas no association was observed for MI (corresponding P values 0.60 and 0.64).8 Similarly, in a second Danish cohort, YKL‐40 levels in the upper quartile were significantly associated with incident stroke (hazard ratio [HR], 1.63; P=0.001), but, again, showed no association with IMI (HR, 0.73; P=0.2).9 Finally, in a European population with stable coronary artery disease (CAD), YKL‐40 was strongly associated with all‐cause mortality inclusive of stroke, but not with recurrent episodes of angina and only marginally with recurrent MI (RMI).10 This difference, if real, could be of pathophysiological importance because, in contrast to CRP, which is largely produced by hepatocytes, YKL‐40 is produced by macrophages and neutrophils within inflamed tissues and thus might reflect better local vascular bed inflammation. However, because YKL‐40 is also an acute‐phase reactant, it remains uncertain whether this chitinase‐like protein plays a direct role in atherothrombosis or, as with other acute‐phase biomarkers, reflects an underlying proinflammatory response prevalent among high‐risk individuals.
To address these issues, we evaluated the role of YKL‐40 as a potential determinant of MI and stroke in an independent prospective cohort of initially healthy U.S. women who were followed over a 17‐year period for incident vascular events. Within this cohort, we also sought to understand the relationships of YKL‐40 to major cardiovascular (CV) risk (CVR) factors, such as age, diabetes, smoking, and hypertension (HTN), and to a series of measured plasma biomarkers of risk, including traditional lipids, apolipoproteins, homocysteine, and lipoprotein(a). Furthermore, we sought to compare the magnitude of any effects on vascular risk observed for YKL‐40 to the magnitude of effect observed for 3 alternative systemic inflammatory biomarkers (hsCRP, sICAM‐1, and fibrinogen). Finally, we evaluated the role of a prespecified lead single‐nucleotide polymorphism (SNP), rs rs4950928, and 40 additional SNPs at the chitinase 3‐like 1 (CHI3L1) gene locus as potential determinants of YKL‐40 levels and for their effect on incident vascular events among the 23 294 study participants of European ancestry.
Methods
Study Cohort and Endpoint Ascertainment
We investigated plasma levels of YKL‐40 and genetic polymorphisms in CHI3L1 among initially healthy participants in the prospective Women's Health Study (WHS) and its associated genome‐wide association study, the Women's Genome Health Study (WGHS). Details of the WHS and WGHS have been provided elsewhere11–12; in brief, the WHS is a nationwide cohort of 39 876 U.S. women aged 45 years and older who were free of CV disease (CVD), cancer, or other major illness at study entry from September 1992 through May 1995. Women initially took part in a randomized factorial trial of aspirin and vitamin E in the primary prevention of CVD and cancer; since trial conclusion in 2004, all participants have continued to be followed prospectively with follow‐up rates of 97.2% for morbidity and 99.4% for mortality. Final results of the trial have been published11; neither intervention had a significant effect on the combined endpoint of major CV events (CVEs), including MI, stroke, or death resulting from CV cause. All study participants provided written informed consent. The study protocol was approved by the institutional review board of Brigham and Women's Hospital (Boston, MA). The WGHS12 is the genetic component of the WHS and includes approximately 25 000 of these women who additionally provided baseline plasma samples, which were collected in EDTA and stored in liquid nitrogen until the time of analysis. Buffy coat samples obtained at this initial blood collection were used as a source of DNA for the genetic analyses.
Once enrolled, all study participants were prospectively followed over an average period of 17 years for the occurrence of first‐ever CVEs (MI, thromboembolic stroke, or CV death). The endpoint of MI was confirmed if symptoms of ischemia were present and if the event was associated with diagnostic changes in cardiac enzyme levels or if there were diagnostic electrocardiographic changes. The diagnosis of thromboembolic stroke was confirmed if the patient had a new neurological deficit of >24‐hour duration that was not coded by the WHS neurologic endpoint committee as having a primary hemorrhagic origin; computed tomography or magnetic resonance scanning was available for almost all cases. Deaths from coronary heart disease were confirmed by record review, death certificates, autopsy reports, and information provided by family members.
Plasma Studies of YKL‐40
For the plasma‐based component of the current analysis, we constructed a prospective nested case control study within the WHS in which baseline samples were obtained from 359 study participants of European ancestry who subsequently developed a confirmed CV endpoint during follow‐up (cases). For efficiency and to provide comparable power for comparisons of MI and stroke, 146 cases of IMI and 146 incident cases of stroke were included in the cases selected (along with an additional 67 CV deaths). For each of these women, baseline plasma samples were also obtained from a control woman of European ancestry who was selected from the pool of remaining study participants who did not develop CVEs during follow‐up (controls). Case and control women were matched on the basis of age (±2 years), smoking status (former, current, and never), and use of hormone replacement therapy (HRT).
Baseline plasma samples from each case (N=359) and control (N=359) participant, which had been stored since study initiation in liquid nitrogen, were thawed and assayed for YKL‐40 protein by enzyme‐linked immunoassay (R&D Systems, Minneapolis, MN) in a core laboratory certified by the National Heart, Lung and Blood Institute/Centers for Disease Control and Prevention Lipid Standardization program. Matched plasma specimens were analyzed in duplicate, with the position of the case specimen varied at random to reduce systematic bias and minimize interassay variability. In pilot data performed using blinded split plasma samples obtained, shipped, stored, and processed in an identical manner to those used in the main study, intra‐ and interassay coefficients of variation were <7% across expected ranges of YKL‐40. In this pilot, we observed no substantive difference in YKL‐40 levels measured before or after 2 freeze‐thaw cycles, the same number of cycles used for the main study.
Levels of total and high‐density lipoprotein cholesterol (HDL‐C) as well as triglycerides (TGs) were measure enzymatically on a Hitachi 911 autoanalyzer (Roche Diagnostics, Basel, Switzerland), whereas low‐density lipoprotein cholesterool (LDL‐C) was determined directly (Genzyme, Cambridge, MA). Levels of apolipoprotein B100 and apolipoprotein A‐I were measured by an immunoturbidometric technique, also on the Hitachi 911 analyzer (Roche Diagnostics). Plasma levels of homocysteine, lipoprotein(a), hsCRP, fibrinogen, and sICAM‐1 were measured in a central core laboratory facility, as previously described.13–15
For the plasma‐based analyses, medians and proportions for baseline risk factors were computed for case and control participants and compared using Wilcoxon's signed‐rank test or McNemar's test. Wilcoxon's rank‐sum test was used to compare plasma YKL‐40 values in risk factor subgroups. Spearman's correlation coefficients were used to evaluate for any evidence of relationship between plasma YKL‐40 and a series of other measured lipid and inflammatory biomarkers known to reflect vascular risk in this cohort. Tests for trend were used to evaluate evidence of association between increasing levels of YKL‐40 and subsequent vascular risk after dividing the study population into quartiles on the basis of the distribution of control values. Adjusted odds ratios (ORs) were obtained with conditional multivariable logistic regression models that, in addition to conditioning on the matching variables of age, smoking status, and HRT, also adjusted for potential confounding variables (LDL‐C, HDL‐C, systolic blood pressure, body mass index (BMI), diabetes, and parental history of MI before age 60 years). On an a priori basis, we performed separate analyses for IMI and incident stroke. Finally, we compared the magnitude of any effects observed between YKL‐40 and incident vascular events in this prospective case‐control study to the magnitude of effect observed in these study samples for 3 other inflammatory biomarkers (hsCRP, fibrinogen, and sICAM‐1).
Genetic Studies of CHI3L1
For the genetic component of the current analysis, genotype data were evaluated for 41 SNPs within 110 kb 5′ to 40 kb 3′ of the CHI3L1 encoding YKL‐40 protein. Genotypes for 40 of these SNPs were obtained as part of the WGHS, which used the Illumina (San Diego, CA) HumanHap300 Duo+platform to query a genome‐wide panel of tag and candidate SNPs, as described previously.12 Given previous data16 and to avoid issues related to linkage disequilibrium and multiple hypothesis testing, we elected, on an a priori basis, to use rs4950928 as the lead SNP for these analyses. Thus, in addition to the above 40 SNPs, genotypes for rs4950928 were derived by imputation with MaCH v.1.0.16 using the HapMap2 release 22 CEU reference panel and had imputation quality of R2=0.91. One of the directly genotyped SNPs, rs946263, was in high linkage disequilibrium (LD; r2=0.78 in 1000 genomes CEU panel) with rs4950928.
To investigate the relationship of genetic variation in CHI3L1 to plasma levels of YKL‐40, we limited our analyses to those women who participated in the plasma component of this study and who were of European ancestry (N=614). Median levels of YKL‐40 were computed by genotype for each of the 41 SNPs and association tests used to evaluate for statistical significance of any effect of genotype on YKL‐40 levels.
For investigations of variation at CHI3L1 as potential determinants of incident vascular events, we used genetic data obtained from all 23 294 initially healthy women of European ancestry genotyped as part of the WGHS. Within this group, 900 incident major CVEs accrued during the follow‐up period (inclusive of 364 MIs, 402 thromboembolic strokes, and 277 confirmed CV deaths); analyses relating variation at CHI3L1 to all‐cause mortality included 1917 events. As in the plasma studies, we selected, on an a priori basis, rs4950928 as our lead SNP for the genetic association analyses. For these latter analyses, Cox's proportional hazard models assuming an additive effect across genotypes were used to generate per‐allele beta‐coefficients, SEs, hazard ratios (HRs), and associated confidence levels.
For both the plasma‐based and genetic analyses, all probability values are 2‐tailed and all confidence intervals (CIs) computed at the 95% level.
Results
Case and control women were matched on age (median, 63 years), smoking status (21% current smokers), and a history of HRT (43.7%). As expected, initially healthy women who subsequently developed CVEs (cases) were more likely at baseline to have a history of HTN, obesity, diabetes, or hyperlipidemia, when compared with women who remained free of reported disease (controls). With regard to concomitantly obtained measures of inflammatory biomarkers, case women also had significantly higher levels of CRP, fibrinogen, and sICAM‐1 (Table 1).
Table 1.
Baseline Clinical Characteristics of Study Participants Who Contributed to the Genetic Analysis (N=23 294) and of Those Study Participants Selected for the Plasma‐Based Case‐Control Analysis (N=718)
| Genetic Analysis Cohort (N=23 294) | Plasma‐Based Case‐Control Analysis | |||
|---|---|---|---|---|
| Control (N=359) | Cases (N=359) | P Value | ||
| Age, y | 52 (48, 59) | 63 (58, 68) | 63 (58, 68) | Matching variable |
| Smoking status, % | ||||
| Current | 11.6 | 20.9 | 20.9 | Matching variable |
| Past | 37.5 | 37.3 | 37.3 | |
| Never | 50.9 | 41.8 | 41.8 | |
| HRT use, % | 43.9 | 43.7 | 43.7 | Matching variable |
| Body mass index, kg/m2 | 24.9 (22.5, 28.3) | 25.0 (22.3, 28.9) | 26.2 (22.7, 29.3) | 0.005 |
| Diabetes, % | 2.5 | 2.8 | 13.9 | <0.0001 |
| Hypertension, % | 24.6 | 35.1 | 54.2 | <0.0001 |
| Hyperlipidemia, % | 30.0 | 39.6 | 41.2 | 0.72 |
| Family history, % | 13.0 | 9.6 | 15.5 | 0.04 |
| Total cholesterol, mg/dL | 208 (184, 236) | 219 (192, 241) | 222 (199, 250) | 0.04 |
| HDL‐C, mg/dL | 52 (43, 62) | 51 (43, 63) | 48 (40, 58) | 0.0004 |
| Triglycerides, mg/dL | 119 (84, 176) | 130 (93, 180) | 157 (104, 240) | <0.0001 |
| Apolipoprotein A1, mg/dL | 149 (132, 168) | 150 (134, 168) | 147 (130, 169) | 0.17 |
| Apolipoprotein B, mg/dL | 100 (84, 121) | 108 (90, 128) | 116 (93, 138) | <0.0001 |
| Lipoprotein(a), mg/dL | 10.4 (4.3, 32.2) | 9.9 (4.5, 35.1) | 12.4 (5, 49) | 0.12 |
| Homocysteine, umol/L | 10.5 (8.7, 12.9) | 11.3 (9.5, 13.8) | 11.5 (9.4, 14.7) | 0.05 |
| HbA1c, % | 5.0 (4.8, 5.2) | 5.1 (4.9, 5.3) | 5.1 (4.9, 5.4) | 0.01 |
| hsCRP, mg/L | 2.0 (0.8, 4.4) | 2.3 (1.2, 4.6) | 3.5 (1.7, 6.5) | <0.0001 |
| sICAM‐1, ng/mL | 343 (302, 395) | 359 (318, 415) | 377 (329, 441) | 0.0003 |
| Fibrinogen, mg/dL | 350 (307, 401) | 367 (322, 427) | 380 (331, 447) | 0.016 |
| YKL‐40, ng/mL | N/A | 33.6 (23.7, 51.2) | 41.4 (25.5, 69.6) | <0.0001 |
P‐value is for the comparison of women who remained free of cardiovascular disease during follow‐up (controls), as compared to women who developed incident myocardial infarction, stroke, or cardiovascular death (cases). Case and control participants were matched on age, smoking status, and use of hormone replacement therapy. HbA1c indicates hemoglobin A1c; HDL‐C, high‐density lipoprotein cholesterol; HRT, hormone replacement therapy; hsCRP, high‐sensitivity C‐reactive protein; LDL‐C, low‐density lipoprotein cholesterol; sICAM1, soluble intercellular adhesion molecule type 1.
The overall distribution of YKL‐40 is shown in Figure 1, before (left) and after (right) log transformation. The median value among our controls (33.6 ng/mL) and the interquartile range (23.7, 51.2) are comparable to those from other published general population studies and consistent with values described by the assay manufacturer (and in our pilot) using fresh plasma samples.
Figure 1.
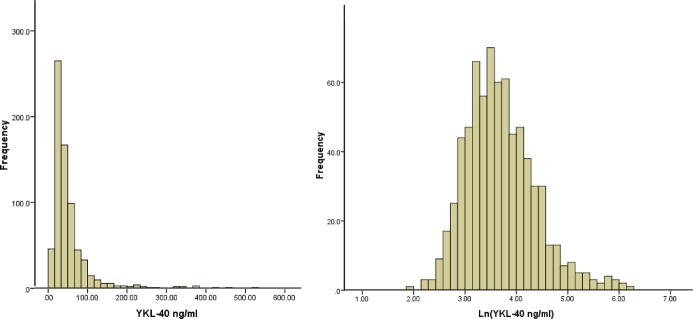
Distribution of baseline YKL‐40 levels (left) and lnYKL‐40 levels (right) in the study population. Values shown are comparable to those reported in other populations and in studies using fresh plasma.
Table 2 presents Spearman's correlation coefficients between YKL‐40 and measured lipid parameters, alternative inflammatory biomarkers, and other clinical characteristics. Among cases as well as controls, YKL‐40 levels correlated moderately with age (r=0.36, P<0.0001), BMI (r=0.10, P=0.009), HDL‐C (r=−0.10, P=0.006), TGs (r=0.18, P<0.001), homocysteine (r=0.21, P<0.001), glycated hemoglobin (HbA1c; r=0.18, P<0.001), and the inflammatory biomarkers, hsCRP (r=0.18, P<0.001) and sICAM‐1 (r=0.22, P<0.001). By contrast, no significant correlation was observed between YKL‐40 and total or LDL‐C, apolipoprotein B, or Lp(a). Consistent with earlier work, YKL‐40 levels were significantly higher among those with diabetes (median 56.1 versus 35.6; P<0.0001), HTN (42.1 versus 33.2; P<0.0001), or obesity (43.2 versus 35.8; P=0.0036), whereas no difference was observed according to alcohol consumption (P=0.56), exercise frequency (P=0.88), postmenopausal status (P=0.27), or smoking history (P=0.25).
Table 2.
Spearman's Correlation Coefficients Between YKL‐40 and Other Measured Plasma Biomarkers of Vascular Risk
| YKL‐40 | hsCRP | Fib | ICAM1 | TC | LDLC | ApoB | HDLC | ApoA | TG | Lp(a) | Hcyst | HbA1c | |
|---|---|---|---|---|---|---|---|---|---|---|---|---|---|
| YKL40 | 1.0 | ||||||||||||
| hsCRP | 0.18** | 1.0 | |||||||||||
| Fib | 0.12* | 0.42** | 1.0 | ||||||||||
| ICAM1 | 0.22** | 0.22** | 0.28** | 1.0 | |||||||||
| TC | 0.03 | 0.08 | 0.12* | 0.11* | 1.0 | ||||||||
| LDL‐C | −0.03 | 0.04 | 0.18** | 0.13* | 0.86** | 1.0 | |||||||
| ApoB | 0.06 | 0.21** | 0.28** | 0.26** | 0.74** | 0.76** | 1.0 | ||||||
| HDL‐C | −0.10* | −0.23** | −0.27** | −0.25** | 0.08* | −0.09* | −0.38** | 1.0 | |||||
| ApoA | −0.04 | −0.08* | −0.24** | −0.19** | 0.09* | −0.15* | −0.19** | 0.79** | 1.0 | ||||
| TG | 0.18** | 0.31** | 0.07 | 0.15* | 0.39** | 0.23** | 0.51** | −0.48** | −0.19** | 1.0 | |||
| LP(a) | −0.002 | −0.03 | 0.12* | 0.05 | 0.12* | 0.17** | 0.14* | −0.05 | −0.10* | −0.02 | 1.0 | ||
| Hcyst | 0.21** | 0.001 | 0.11* | 0.17** | 0.12* | 0.12* | 0.10* | −0.06 | −0.03 | 0.01 | −0.07 | 1.0 | |
| HbA1c | 0.18** | 0.22** | 0.23** | 0.18** | 0.09* | 0.13* | 0.18** | −0.27** | −0.24** | 0.18** | 0.05 | 0.04 | 1.0 |
Data are from the case‐control portion of the study. ApoA indicates apolipoprotein A1; ApoB, apolipoprotein B; Fib, fibrinogen; HbA1c, hemoglobin A1c; Hcyst, homocysteine; HDL‐C, high‐density lipoprotein cholesterol; hsCRP, high‐sensitivity C‐reactive protein; ICAM1, soluble intercellular adhesion molecule type 1; LDL‐C, low density lipoprotein cholesterol; TC, total cholesterol; TG, triglycerides; Lp(a), lipoprotein(a).
*P<0.05; **P<0.0001.
Table 3 presents ORs for future vascular events according to increasing quartiles of YKL‐40 at study entry. In multivariable analyses conditioned on age, smoking, and HRT, and further adjusted for blood pressure, HDL, and LDL‐C, diabetes, family history of premature CAD, and BMI, the ORs from lowest (referent) to highest baseline quartile of YKL‐40 for the overall combined endpoint of any major vascular event were 1.0, 1.14, 1.15, and 1.96, respectively (P‐trend=0.02). However, this effect was largely the result of an association of YKL40 with incident stroke; for this endpoint, the ORs from lowest (referent) to highest baseline quartile of YKL‐40 were 1.0, 1.50, 1.52, and 2.93, respectively (P‐trend across quartiles=0.019). By contrast, no significant association was observed between baseline levels of YKL‐40 and IMI; for this endpoint, the ORs from lowest (referent) to highest baseline quartile of YKL‐40 were 1.0, 0.96, 0.73, and 1.24, respectively (P‐trend across quartiles=0.81). These effects were not substantially attenuated with further adjustment for any of the alternative inflammatory biomarkers or for estimated glomerular filtration rate.
Table 3.
Multivariable Adjusted Odds Ratios for Increasing Baseline Quartiles of YKL‐40 and Incident Vascular Events
| Range (ng/mL) | Quartile 1 <23.7 | Quartile 2 23.7 to 33.6 | Quartile 3 33.7 to 51.2 | Quartile 4 >51.2 | P‐Trend |
|---|---|---|---|---|---|
| Any vascular event | |||||
| OR* | 1.00 | 1.14 | 1.15 | 1.96 | 0.021 |
| 95% CI | Referent | 0.66 to 1.96 | 0.66 to 1.98 | 1.12 to 3.43 | |
| P | Referent | 0.64 | 0.63 | 0.02 | |
| N | 70 | 67 | 84 | 138 | |
| Incident myocardial infarction | |||||
| OR* | 1.00 | 0.96 | 0.74 | 1.24 | 0.81 |
| 95% CI | Referent | 0.38 to 2.40 | 0.31 to 1.78 | 0.49 to 3.12 | |
| P | Referent | 0.93 | 0.50 | 0.64 | |
| N | 32 | 24 | 38 | 52 | |
| Incident stroke | |||||
| OR* | 1.00 | 1.50 | 1.52 | 2.93 | 0.019 |
| 95% CI | Referent | 0.63 to 3.54 | 0.62 to 3.72 | 1.23 to 7.01 | |
| P | Referent | 0.36 | 0.36 | 0.02 | |
| N | 28 | 30 | 30 | 58 | |
Data are from the case‐control portion of the study. HDL indicates high‐density lipoprotein; LDL, low‐density lipoprotein.
Odds ratios from the case‐control sample were matched for age, smoking, and hormone replacement therapy use and adjusted for systolic blood pressure (mm Hg), HDL‐cholesterol (mg/dL), LDL‐cholesterol (mg/dL), body mass index (kg/m2), diabetes, and parental history of myocardial infarction before age 60 years.
We compared the magnitude of effect of YKL‐40 on incident stroke to the magnitude of effect on this endpoint for fibrinogen, sICAM1, and hsCRP (Table 4). Despite intercorrelations between all of these factors, different effects were observed on incident stroke. Specifically, unlike YKL‐40, the associations with incident stroke observed across increasing quartiles of either sICAM‐1 or fibrinogen were small and not statistically significant (P‐trend values across quartiles of sICAM‐1 and fibrinogen, 0.21 and 0.63, respectively). By contrast, the effect of baseline hsCRP levels on incident stroke (multivariable adjusted OR for the top versus bottom quartile=3.42; P‐trend across quartiles=0.006) was greater than the effect for YKL‐40 (multivariable adjusted OR for the top versus bottom quartile=2.93; P‐trend across quartiles=0.019). These data are presented graphically in Figure 2; in fully adjusted models, the per‐quartile increase in OR for stroke associated with hsCRP was 52% (95% CI, 12 to 205), whereas the comparable value for YKL‐40 was 40% (95% CI, 6 to 186). These effects for CRP persisted after additional adjustment for YKL‐40 levels. Specifically, in further analyses controlling for baseline YKL‐40, the ORs (95% CI) for stroke for the lowest to highest baseline quartiles of CRP were 1.00 (referent), 1.34 (0.60 to 2.99), 1.52 (0.62 to 3.83), and 3.39 (1.32 to 8.66), respectively (P‐trend across quartiles, 0.007).
Table 4.
Multivariable Adjusted Odds Ratios for Increasing Baseline Quartiles of Fibrinogen, sICAM‐1, and hsCRP and Incident Stroke
| Quartile 1 | Quartile 2 | Quartile 3 | Quartile 4 | P‐Trend | |
|---|---|---|---|---|---|
| Fibrinogen | |||||
| mg/dL | <322 | 322 to 368 | 369 to 427 | >427 | |
| OR* | 1.00 | 0.99 | 1.14 | 1.18 | 0.63 |
| 95% CI | Referent | 0.46 to 2.13 | 0.54 to 2.40 | 0.51 to 2.72 | |
| P | Referent | 0.98 | 0.73 | 0.70 | |
| N | 30 | 26 | 41 | 41 | |
| sICAM‐1 | |||||
| ng/mL | <318 | 318 to 359 | 360 to 415 | >415 | |
| OR* | 1.00 | 1.27 | 1.51 | 1.58 | 0.21 |
| 95% CI | Referent | 0.62 to 2.61 | 0.69 to 3.29 | 0.78 to 3.21 | |
| P | Referent | 0.51 | 0.29 | 0.64 | |
| N | 29 | 32 | 34 | 43 | |
| hsCRP | |||||
| mg/L | <1.2 | 1.2 to 2.3 | 2.4 to 4.6 | >4.6 | |
| OR* | 1.00 | 1.40 | 1.48 | 3.42 | 0.007 |
| 95% CI | Referent | 0.64 to 3.12 | 0.59 to 3.67 | 1.35 to 8.71 | |
| P | Referent | 0.40 | 0.40 | 0.01 | |
| N | 20 | 28 | 35 | 60 | |
Data are from the case‐control portion of the study. LDL‐C indicates low‐density lipoprotein cholesterol; HDL‐C, high‐density lipoprotein cholesterol; HRT, hormone replacement therapy; hsCRP, high‐sensitivity C‐reactive protein; sICAM‐1, soluble intercellular adhesion molecule type 1.
Odds ratios (OR) were matched for age, smoking, and HRT and adjusted for systolic blood pressure (mm Hg), HDL‐C (mg/dL), LDL‐C (mg/dL), body mass index (kg/m2), diabetes, and parental history of myocardial infarction before age 60 years.
Figure 2.
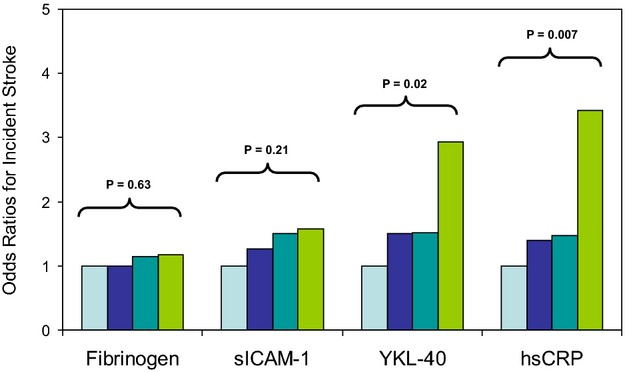
Multivariable adjusted odds ratios of incident stroke for increasing quartiles of baseline fibrinogen, sICAM‐1, YKL‐40, and hsCRP. hsCRP indicates high‐sensitivity C‐reactive protein; sICAM‐1, soluble intercellular adhesion molecule type 1.
Multiple SNPs at the CHI3L1 locus (many in LD with each other) were significantly associated with plasma YKL‐40 levels. For example, as shown in Figure 3 for the prespecified lead SNP at rs4950928, median levels of YKL‐40 were significantly higher for those with the CC (40.4 ng/mL) than with the GG genotype (17.5 ng/mL), whereas CG heterozygotes had intermediate YKL‐40 levels (31.0 ng/mL; P‐trend in plasma YKL‐40 levels across genotypes, <0.0001). Because genotypes at rs4950928 had been imputed, a second SNP (rs946263) at CHI3L1 that is in high LD with rs4950928, but genotyped directly, was queried and found to show a similar pattern of association with YKL‐40 levels. Among the remaining 39 SNPs evaluated at CHI3L1 for association with YKL‐40, rs10399805 had YKL‐40 levels of 33.4, 40.9, and 97.8 ng/mL for the TT, TA, and AA genotypes, respectively (P=1.9×10⁻⁸). This association remained significant after adjustment for either rs4950928 or rs946263 (Figure 3, left column). However, as also shown in Figure 3 (right 3 columns) and in Table 5, we did not observe, in the full sample set, a statistically significant association between polymorphism at rs4950928 and incident vascular events for the combined endpoint of all major vascular events (HR, 1.09; P=0.59), for CV deaths (HR, 1.05; P=0.69), for all‐cause mortality (HR, 0.96; P=0.35), or for either MI (HR, 1.09; P=0.34) or thromboembolic stroke (HR, 0.98; P=0.79). Similar data were observed for rs946263, rs10399805, and for the remaining 40 SNPs in CHI3L1 (Table 6). Also shown in Table 6 are imputed data for rs872129, an additional SNP at the CHI3L1 locus that has been used in at least 1 previous study of YKL‐40.9
Figure 3.

Median levels of YKL‐40 (from the case‐control study, left column) and rates for incident stroke, major cardiovascular events, and all‐cause mortality (from the total study population) according to variation in CHI3L1. Data are shown for the lead SNP rs4950928 and for rs946263 and rs10399805. CHI3L1 indicates chitinase 3‐like 1 gene; CV, cardiovascular; SNPs, single‐nucleotide polymorphisms.
Table 5.
Relationship of Genetic Variation at CHI3L1 to Incident Vascular Events and All‐Cause Mortality
| B | SE | HR | 95% CI | P Value | |
|---|---|---|---|---|---|
| rs4950928 | |||||
| Myocardial infarction | 0.0878 | 0.0929 | 1.09 | 0.91 to 1.31 | 0.34 |
| Thromboembolic stroke | −0.0247 | 0.0913 | 0.98 | 0.82 to 1.17 | 0.79 |
| Major cardiovascular events | 0.0372 | 0.0599 | 1.03 | 0.91 to 1.16 | 0.59 |
| Cardiovascular death | 0.0475 | 0.1179 | 1.05 | 0.83 to 1.32 | 0.69 |
| All‐cause mortality | −0.0395 | 0.0419 | 0.96 | 0.89 to 1.04 | 0.35 |
| rs946263 | |||||
| Myocardial infarction | 0.0706 | 0.0935 | 1.07 | 0.89 to 1.29 | 0.45 |
| Thromboembolic stroke | −0.0467 | 0.0922 | 0.95 | 0.80 to 1.14 | 0.61 |
| Major cardiovascular events | 0.0183 | 0.0603 | 1.02 | 0.90 to 1.15 | 0.76 |
| Cardiovascular death | 0.0401 | 0.1185 | 1.04 | 0.82 to 1.31 | 0.74 |
| All‐cause mortality | −0.0410 | 0.0420 | 0.96 | 0.88 to 1.04 | 0.33 |
| rs10399805 | |||||
| Myocardial infarction | 0.0819 | 0.1081 | 1.08 | 0.88 to 1.34 | 0.45 |
| Thromboembolic stroke | 0.1244 | 0.1013 | 1.13 | 0.93 to 1.38 | 0.22 |
| Major cardiovascular events | 0.1151 | 0.0679 | 1.12 | 0.98 to 1.28 | 0.90 |
| Cardiovascular death | 0.2689 | 0.1283 | 1.31 | 1.02 to 1.68 | 0.04 |
| All cause mortality | 0.0998 | 0.0470 | 1.10 | 1.01 to 1.21 | 0.34 |
Data are shown for the a priori selected lead SNP rs4950928 and for rs946263 and rs10399805 using age‐adjusted Cox proportional hazards models assuming an additive genetic effect across genotype. CHI3L1 indicates chitinase 3‐like 1 gene; HR, hazard ratio; SNP, single‐nucleotide polymorphism.
Table 6.
Relationship of Genetic Variation at CHI3L1 to Incident Vascular Events and All‐Cause Mortality
| B | SE | HR | 95% CI | P Value | |
|---|---|---|---|---|---|
| rs10399805 | |||||
| Myocardial infarction | 0.0819 | 0.1081 | 1.09 | 0.88 to 1.34 | 0.45 |
| Thromboembolic stroke | 0.1244 | 0.1013 | 1.13 | 0.93 to 1.38 | 0.22 |
| Major cardiovascular events | 0.1151 | 0.0679 | 1.12 | 0.98 to 1.28 | 0.09 |
| Cardiovascular death | 0.2689 | 0.1283 | 1.31 | 1.02 to 1.68 | 0.04 |
| All‐cause mortality | 0.0998 | 0.0470 | 1.10 | 1.01 to 1.21 | 0.03 |
| rs1065761 | |||||
| Myocardial infarction | −0.1124 | 0.1195 | 0.89 | 0.71 to 1.13 | 0.35 |
| Thromboembolic stroke | 0.0300 | 0.1079 | 1.03 | 0.83 to 1.27 | 0.78 |
| Major cardiovascular events | −0.0712 | 0.0748 | 0.93 | 0.80 to 1.08 | 0.34 |
| Cardiovascular death | −0.2047 | 0.1565 | 0.81 | 0.60 to 1.11 | 0.19 |
| All cause mortality | −0.0222 | 0.0504 | 0.98 | 0.89 to 1.08 | 0.66 |
| rs10800901 | |||||
| Myocardial infarction | −0.0443 | 0.0811 | 0.96 | 0.82 to 1.12 | 0.58 |
| Thromboembolic stroke | −0.0299 | 0.0770 | 0.97 | 0.83 to 1.13 | 0.70 |
| Major cardiovascular events | −0.0071 | 0.0513 | 0.99 | 0.90 to 1.10 | 0.89 |
| Cardiovascular death | 0.1160 | 0.1002 | 1.12 | 0.92 to 1.37 | 0.25 |
| All‐cause mortality | 0.0100 | 0.0350 | 1.01 | 0.94 to 1.08 | 0.77 |
| rs10920574 | |||||
| Myocardial infarction | −0.0896 | 0.1756 | 0.91 | 0.65 to 1.29 | 0.61 |
| Thromboembolic stroke | 0.0609 | 0.1570 | 1.06 | 0.78 to 1.45 | 0.70 |
| Major cardiovascular events | 0.1296 | 0.1016 | 1.14 | 0.93 to 1.39 | 0.20 |
| Cardiovascular death | 0.3561 | 0.1833 | 1.43 | 1.00 to 2.05 | 0.05 |
| All cause mortality | −0.0200 | 0.0745 | 0.98 | 0.85 to 1.13 | 0.79 |
| rs10920576 | |||||
| Myocardial infarction | 0.1318 | 0.1075 | 1.14 | 0.92 to 1.41 | 0.22 |
| Thromboembolic stroke | 0.0981 | 0.1037 | 1.10 | 0.90 to 1.35 | 0.34 |
| Major cardiovascular events | 0.1438 | 0.0682 | 1.15 | 1.01 to 1.32 | 0.03 |
| Cardiovascular death | 0.2124 | 0.1333 | 1.24 | 0.95 to 1.61 | 0.11 |
| All cause mortality | 0.0278 | 0.0488 | 1.03 | 0.93 to 1.13 | 0.57 |
| rs11587584 | |||||
| Myocardial infarction | 0.0941 | 0.1452 | 1.10 | 0.83 to 1.46 | 0.52 |
| Thromboembolic stroke | −0.0163 | 0.1446 | 0.98 | 0.74 to 1.31 | 0.91 |
| Major cardiovascular events | 0.0221 | 0.0952 | 1.02 | 0.85 to 1.23 | 0.82 |
| Cardiovascular death | −0.1775 | 0.2058 | 0.84 | 0.56 to 1.25 | 0.39 |
| All‐cause mortality | −0.0292 | 0.0664 | 0.97 | 0.85 to 1.11 | 0.66 |
| rs12026765 | |||||
| Myocardial infarction | 0.1361 | 0.1129 | 1.15 | 0.92 to 1.43 | 0.23 |
| Thromboembolic stroke | 0.0996 | 0.1091 | 1.10 | 0.89 to 1.37 | 0.36 |
| Major cardiovascular events | 0.1546 | 0.0714 | 1.17 | 1.01 to 1.34 | 0.03 |
| Cardiovascular death | 0.2607 | 0.1376 | 1.30 | 0.99 to 1.70 | 0.06 |
| All cause mortality | 0.0497 | 0.0510 | 1.05 | 0.95 to 1.16 | 0.33 |
| rs12123883 | |||||
| Myocardial infarction | 0.1126 | 0.1353 | 1.12 | 0.86 to 1.46 | 0.41 |
| Thromboembolic stroke | 0.0817 | 0.1307 | 1.09 | 0.84 to 1.40 | 0.53 |
| Major cardiovascular events | 0.0961 | 0.0868 | 1.10 | 0.93 to 1.30 | 0.27 |
| Cardiovascular death | 0.0011 | 0.1799 | 1.00 | 0.70 to 1.42 | 1.00 |
| All‐cause mortality | 0.0270 | 0.0614 | 1.03 | 0.91 to 1.16 | 0.66 |
| rs12141375 | |||||
| Myocardial infarction | −0.1130 | 0.0953 | 0.89 | 0.74 to 1.08 | 0.24 |
| Thromboembolic stroke | −0.0743 | 0.0895 | 0.93 | 0.78 to 1.11 | 0.41 |
| Major cardiovascular events | −0.0535 | 0.0594 | 0.95 | 0.84 to 1.06 | 0.37 |
| Cardiovascular death | −0.0023 | 0.1164 | 1.00 | 0.79 to 1.25 | 0.98 |
| All‐cause mortality | 0.0179 | 0.0399 | 1.02 | 0.94 to 1.10 | 0.65 |
| rs1340237 | |||||
| Myocardial infarction | −0.0903 | 0.0870 | 0.91 | 0.77 to 1.08 | 0.30 |
| Thromboembolic stroke | 0.0496 | 0.0797 | 1.05 | 0.90 to 1.23 | 0.53 |
| Major cardiovascular events | −0.0110 | 0.0541 | 0.99 | 0.89 to 1.10 | 0.84 |
| Cardiovascular death | 0.0699 | 0.1054 | 1.07 | 0.87 to 1.32 | 0.51 |
| All‐cause mortality | −0.0508 | 0.0375 | 0.95 | 0.88 to 1.02 | 0.18 |
| rs1340239 | |||||
| Myocardial infarction | −0.0350 | 0.1587 | 0.97 | 0.71 to 1.32 | 0.83 |
| Thromboembolic stroke | −0.0244 | 0.1499 | 0.98 | 0.73 to 1.31 | 0.87 |
| Major cardiovascular events | 0.0381 | 0.0973 | 1.04 | 0.86 to 1.26 | 0.70 |
| Cardiovascular death | 0.2334 | 0.1778 | 1.26 | 0.89 to 1.79 | 0.19 |
| All‐cause mortality | 0.0324 | 0.0671 | 1.03 | 0.91 to 1.18 | 0.63 |
| rs17532442 | |||||
| Myocardial infarction | −0.1827 | 0.1501 | 0.83 | 0.62 to 1.12 | 0.22 |
| Thromboembolic stroke | 0.0159 | 0.1314 | 1.02 | 0.79 to 1.31 | 0.90 |
| Major cardiovascular events | −0.1143 | 0.0927 | 0.89 | 0.74 to 1.07 | 0.22 |
| Cardiovascular death | −0.2307 | 0.1935 | 0.79 | 0.54 to 1.16 | 0.23 |
| All cause mortality | −0.0550 | 0.0620 | 0.95 | 0.84 to 1.07 | 0.37 |
| rs2250509 | |||||
| Myocardial infarction | 0.0190 | 0.1105 | 1.02 | 0.82 to 1.27 | 0.86 |
| Thromboembolic stroke | −0.0481 | 0.1078 | 0.95 | 0.77 to 1.18 | 0.66 |
| Major cardiovascular events | 0.0038 | 0.0707 | 1.00 | 0.87 to 1.15 | 0.96 |
| Cardiovascular death | −0.0746 | 0.1450 | 0.93 | 0.70 to 1.23 | 0.61 |
| All‐cause mortality | 0.0099 | 0.0483 | 1.01 | 0.92 to 1.11 | 0.84 |
| rs2297950 | |||||
| Myocardial infarction | −0.0337 | 0.0805 | 0.97 | 0.83 to 1.13 | 0.68 |
| Thromboembolic Stroke | −0.0113 | 0.0761 | 0.99 | 0.85 to 1.15 | 0.88 |
| Major cardiovascular events | −0.0221 | 0.0510 | 0.98 | 0.89 to 1.08 | 0.66 |
| Cardiovascular death | 0.0734 | 0.0994 | 1.08 | 0.89 to 1.31 | 0.46 |
| All‐cause mortality | −0.0392 | 0.0351 | 0.96 | 0.90 to 1.03 | 0.26 |
| rs2486072 | |||||
| Myocardial infarction | −0.1583 | 0.0791 | 0.85 | 0.73 to 1.00 | 0.05 |
| Thromboembolic stroke | −0.0789 | 0.0742 | 0.92 | 0.80 to 1.07 | 0.29 |
| Major cardiovascular events | −0.0639 | 0.0495 | 0.94 | 0.85 to 1.03 | 0.20 |
| Cardiovascular death | 0.0811 | 0.0966 | 1.08 | 0.90 to 1.31 | 0.40 |
| All‐cause mortality | −0.0075 | 0.0337 | 0.99 | 0.93 to 1.06 | 0.82 |
| rs2486948 | |||||
| Myocardial infarction | −0.0633 | 0.1042 | 0.94 | 0.77 to 1.15 | 0.54 |
| Thromboembolic stroke | −0.0090 | 0.0970 | 0.99 | 0.82 to 1.20 | 0.93 |
| Major cardiovascular events | 0.0089 | 0.0645 | 1.01 | 0.89 to 1.14 | 0.89 |
| Cardiovascular death | 0.0967 | 0.1240 | 1.10 | 0.86 to 1.40 | 0.44 |
| All‐cause mortality | 0.0038 | 0.0442 | 1.00 | 0.92 to 1.09 | 0.93 |
| rs2486949 | |||||
| Myocardial infarction | −0.1111 | 0.0740 | 0.89 | 0.77 to 1.03 | 0.13 |
| Thromboembolic stroke | −0.0692 | 0.0703 | 0.93 | 0.81 to 1.07 | 0.32 |
| Major cardiovascular events | −0.0615 | 0.0469 | 0.94 | 0.86 to 1.03 | 0.19 |
| Cardiovascular death | 0.0184 | 0.0931 | 1.02 | 0.85 to 1.22 | 0.84 |
| All‐cause mortality | 0.0093 | 0.0321 | 1.01 | 0.95 to 1.07 | 0.77 |
| rs2486962 | |||||
| Myocardial infarction | −0.1364 | 0.0742 | 0.87 | 0.75 to 1.01 | 0.07 |
| Thromboembolic stroke | −0.0529 | 0.0704 | 0.95 | 0.83 to 1.09 | 0.45 |
| Major cardiovascular events | −0.0591 | 0.0470 | 0.94 | 0.86 to 1.03 | 0.21 |
| Cardiovascular death | 0.0759 | 0.0934 | 1.08 | 0.90 to 1.30 | 0.42 |
| All‐cause mortality | −0.0079 | 0.0322 | 0.99 | 0.93 to 1.06 | 0.81 |
| rs2494287 | |||||
| Myocardial infarction | −0.1712 | 0.1250 | 0.84 | 0.66 to 1.08 | 0.17 |
| Thromboembolic stroke | −0.1513 | 0.1177 | 0.86 | 0.68 to 1.08 | 0.20 |
| Major cardiovascular events | −0.0882 | 0.0767 | 0.92 | 0.79 to 1.06 | 0.25 |
| Cardiovascular death | 0.1218 | 0.1406 | 1.13 | 0.86 to 1.49 | 0.39 |
| All‐cause mortality | −0.0157 | 0.0511 | 0.98 | 0.89 to 1.09 | 0.76 |
| rs2494295 | |||||
| Myocardial infarction | 0.1120 | 0.0747 | 1.12 | 0.97 to 1.29 | 0.13 |
| Thromboembolic stroke | 0.0856 | 0.0713 | 1.09 | 0.95 to 1.25 | 0.23 |
| Major cardiovascular events | 0.0954 | 0.0476 | 1.10 | 1.00 to 1.21 | 0.05 |
| Cardiovascular death | 0.0815 | 0.0949 | 1.08 | 0.90 to 1.31 | 0.39 |
| All‐cause mortality | 0.0378 | 0.0327 | 1.04 | 0.97 to 1.11 | 0.25 |
| rs2494302 | |||||
| Myocardial infarction | 0.1603 | 0.1693 | 1.17 | 0.84 to 1.64 | 0.34 |
| Thromboembolic stroke | 0.2621 | 0.1533 | 1.30 | 0.96 to 1.76 | 0.09 |
| Major cardiovascular events | 0.1976 | 0.1059 | 1.22 | 0.99 to 1.50 | 0.06 |
| Cardiovascular death | −0.0182 | 0.2319 | 0.98 | 0.62 to 1.55 | 0.94 |
| All‐cause mortality | 0.0521 | 0.0775 | 1.05 | 0.90 to 1.23 | 0.50 |
| rs2642531 | |||||
| Myocardial infarction | 0.1024 | 0.1075 | 1.11 | 0.90 to 1.37 | 0.34 |
| Thromboembolic stroke | 0.0589 | 0.1040 | 1.06 | 0.87 to 1.30 | 0.57 |
| Major cardiovascular events | 0.1155 | 0.0681 | 1.12 | 0.98 to 1.28 | 0.09 |
| Cardiovascular death | 0.1943 | 0.1322 | 1.21 | 0.94 to 1.57 | 0.14 |
| All‐cause mortality | 0.0263 | 0.0483 | 1.03 | 0.93 to 1.13 | 0.59 |
| rs2886117 | |||||
| Myocardial infarction | 0.1293 | 0.1060 | 1.14 | 0.92 to 1.40 | 0.22 |
| Thromboembolic stroke | 0.1238 | 0.1011 | 1.13 | 0.93 to 1.38 | 0.22 |
| Major cardiovascular events | 0.1368 | 0.0672 | 1.15 | 1.01 to 1.31 | 0.04 |
| Cardiovascular death | 0.2902 | 0.1271 | 1.34 | 1.04 to 1.71 | 0.02 |
| All‐cause mortality | 0.1073 | 0.0468 | 1.11 | 1.02 to 1.22 | 0.02 |
| rs3753472 | |||||
| Myocardial infarction | −0.0887 | 0.0790 | 0.92 | 0.78 to 1.07 | 0.26 |
| Thromboembolic stroke | 0.0179 | 0.0740 | 1.02 | 0.88 to 1.18 | 0.81 |
| Major cardiovascular events | −0.0119 | 0.0497 | 0.99 | 0.90 to 1.09 | 0.81 |
| Cardiovascular death | 0.0475 | 0.0984 | 1.05 | 0.86 to 1.27 | 0.63 |
| All‐cause mortality | −0.0192 | 0.0341 | 0.98 | 0.92 to 1.05 | 0.57 |
| rs3753473 | |||||
| Myocardial infarction | 0.0471 | 0.1511 | 1.05 | 0.78 to 1.41 | 0.76 |
| Thromboembolic stroke | 0.0417 | 0.1451 | 1.04 | 0.78 to 1.39 | 0.77 |
| Major cardiovascular events | 0.1106 | 0.0940 | 1.12 | 0.93 to 1.34 | 0.24 |
| Cardiovascular death | 0.5463 | 0.1587 | 1.73 | 1.27 to 2.36 | 0.00 |
| All‐cause mortality | 0.0212 | 0.0669 | 1.02 | 0.90 to 1.16 | 0.75 |
| rs3766539 | |||||
| Myocardial infarction | 0.0093 | 0.1288 | 1.01 | 0.78 to 1.30 | 0.94 |
| Thromboembolic stroke | −0.0147 | 0.1243 | 0.99 | 0.77 to 1.26 | 0.91 |
| Major cardiovascular events | 0.0392 | 0.0812 | 1.04 | 0.89 to 1.22 | 0.63 |
| Cardiovascular death | 0.1411 | 0.1556 | 1.15 | 0.85 to 1.56 | 0.36 |
| All‐cause mortality | 0.0569 | 0.0554 | 1.06 | 0.95 to 1.18 | 0.30 |
| rs3766553 | |||||
| Myocardial infarction | −0.0078 | 0.0738 | 0.99 | 0.86 to 1.15 | 0.92 |
| Thromboembolic stroke | 0.0469 | 0.0701 | 1.05 | 0.91 to 1.20 | 0.50 |
| Major cardiovascular events | 0.0505 | 0.0469 | 1.05 | 0.96 to 1.15 | 0.28 |
| Cardiovascular death | 0.1268 | 0.0936 | 1.14 | 0.95 to 1.36 | 0.18 |
| All‐cause mortality | −0.0073 | 0.0322 | 0.99 | 0.93 to 1.06 | 0.82 |
| rs3766560 | |||||
| Myocardial infarction | 0.1135 | 0.1050 | 1.12 | 0.91 to 1.38 | 0.28 |
| Thromboembolic stroke | 0.0635 | 0.1017 | 1.07 | 0.87 to 1.30 | 0.53 |
| Major cardiovascular events | 0.1259 | 0.0665 | 1.13 | 1.00 to 1.29 | 0.06 |
| Cardiovascular death | 0.1984 | 0.1290 | 1.22 | 0.95 to 1.57 | 0.12 |
| All‐cause mortality | 0.0171 | 0.0474 | 1.02 | 0.93 to 1.12 | 0.72 |
| rs3766562 | |||||
| Myocardial infarction | 0.0139 | 0.1820 | 1.01 | 0.71 to 1.45 | 0.94 |
| Thromboembolic stroke | 0.1656 | 0.1604 | 1.18 | 0.86 to 1.62 | 0.30 |
| Major cardiovascular events | 0.1405 | 0.1087 | 1.15 | 0.93 to 1.42 | 0.20 |
| Cardiovascular death | 0.0877 | 0.2214 | 1.09 | 0.71 to 1.68 | 0.69 |
| All‐cause mortality | 0.1518 | 0.0743 | 1.16 | 1.01 to 1.35 | 0.04 |
| rs3820145 | |||||
| Myocardial infarction | −0.0097 | 0.0953 | 0.99 | 0.82 to 1.19 | 0.92 |
| Thromboembolic stroke | −0.0563 | 0.0920 | 0.95 | 0.79 to 1.13 | 0.54 |
| Major cardiovascular events | −0.0061 | 0.0606 | 0.99 | 0.88 to 1.12 | 0.92 |
| Cardiovascular death | 0.2073 | 0.1137 | 1.23 | 0.98 to 1.54 | 0.07 |
| All‐cause mortality | −0.0294 | 0.0418 | 0.97 | 0.89 to 1.05 | 0.48 |
| rs4950937 | |||||
| Myocardial infarction | −0.0391 | 0.0830 | 0.96 | 0.82 to 1.13 | 0.64 |
| Thromboembolic stroke | −0.0387 | 0.0789 | 0.96 | 0.82 to 1.12 | 0.62 |
| Major cardiovascular events | −0.0297 | 0.0527 | 0.97 | 0.88 to 1.08 | 0.57 |
| Cardiovascular death | 0.0536 | 0.1026 | 1.06 | 0.86 to 1.29 | 0.60 |
| All‐cause mortality | −0.0002 | 0.0358 | 1.00 | 0.93 to 1.07 | 1.00 |
| rs4971226 | |||||
| Myocardial infarction | 0.0220 | 0.0743 | 1.02 | 0.88 to 1.18 | 0.77 |
| Thromboembolic stroke | −0.0275 | 0.0709 | 0.97 | 0.85 to 1.12 | 0.70 |
| Major cardiovascular events | 0.0105 | 0.0473 | 1.01 | 0.92 to 1.11 | 0.82 |
| Cardiovascular death | 0.0718 | 0.0934 | 1.07 | 0.89 to 1.29 | 0.44 |
| All‐cause mortality | 0.0088 | 0.0324 | 1.01 | 0.95 to 1.07 | 0.78 |
| rs6427997 | |||||
| Myocardial infarction | 0.0994 | 0.0777 | 1.10 | 0.95 to 1.29 | 0.20 |
| Thromboembolic stroke | 0.0568 | 0.0746 | 1.06 | 0.91 to 1.22 | 0.45 |
| Major cardiovascular events | 0.0581 | 0.0498 | 1.06 | 0.96 to 1.17 | 0.24 |
| Cardiovascular death | −0.0289 | 0.1007 | 0.97 | 0.80 to 1.18 | 0.77 |
| All‐cause mortality | 0.0206 | 0.0343 | 1.02 | 0.95 to 1.09 | 0.55 |
| rs6672661 | |||||
| Myocardial infarction | 0.1168 | 0.0760 | 1.12 | 0.97 to 1.30 | 0.12 |
| Thromboembolic stroke | 0.1053 | 0.0726 | 1.11 | 0.96 to 1.28 | 0.15 |
| Major cardiovascular events | 0.0926 | 0.0486 | 1.10 | 1.00 to 1.21 | 0.06 |
| Cardiovascular death | −0.0243 | 0.0983 | 0.98 | 0.80 to 1.18 | 0.80 |
| All‐cause mortality | 0.0328 | 0.0335 | 1.03 | 0.97 to 1.10 | 0.33 |
| rs6686206 | |||||
| Myocardial infarction | 0.1058 | 0.0984 | 1.11 | 0.92 to 1.35 | 0.28 |
| Thromboembolic stroke | −0.0397 | 0.0985 | 0.96 | 0.79 to 1.17 | 0.69 |
| Major cardiovascular events | 0.0684 | 0.0634 | 1.07 | 0.95 to 1.21 | 0.28 |
| Cardiovascular death | 0.1595 | 0.1223 | 1.17 | 0.92 to 1.49 | 0.19 |
| All‐cause mortality | −0.0155 | 0.0447 | 0.98 | 0.90 to 1.07 | 0.73 |
| rs7542294 | |||||
| Myocardial infarction | 0.1274 | 0.0992 | 1.14 | 0.94 to 1.38 | 0.20 |
| Thromboembolic stroke | 0.1108 | 0.0947 | 1.12 | 0.93 to 1.35 | 0.24 |
| Major cardiovascular events | 0.1396 | 0.0628 | 1.15 | 1.02 to 1.30 | 0.03 |
| Cardiovascular death | 0.2325 | 0.1212 | 1.26 | 1.00 to 1.60 | 0.05 |
| All‐cause mortality | 0.0491 | 0.0444 | 1.05 | 0.96 to 1.15 | 0.27 |
| rs762625 | |||||
| Myocardial infarction | 0.0224 | 0.0948 | 1.02 | 0.85 to 1.23 | 0.81 |
| Thromboembolic stroke | −0.0184 | 0.0914 | 0.98 | 0.82 to 1.17 | 0.84 |
| Major cardiovascular events | 0.0413 | 0.0600 | 1.04 | 0.93 to 1.17 | 0.49 |
| Cardiovascular death | 0.1837 | 0.1143 | 1.20 | 0.96 to 1.50 | 0.11 |
| All‐cause mortality | 0.0188 | 0.0413 | 1.02 | 0.94 to 1.10 | 0.65 |
| rs871850 | |||||
| Myocardial infarction | 0.0503 | 0.0737 | 1.05 | 0.91 to 1.22 | 0.50 |
| Thromboembolic stroke | 0.0222 | 0.0701 | 1.02 | 0.89 to 1.17 | 0.75 |
| Major cardiovascular events | 0.0463 | 0.0469 | 1.05 | 0.96 to 1.15 | 0.32 |
| Cardiovascular death | 0.0686 | 0.0930 | 1.07 | 0.89 to 1.29 | 0.46 |
| All‐cause mortality | 0.0221 | 0.0321 | 1.02 | 0.96 to 1.09 | 0.49 |
| rs880633 | |||||
| Myocardial infarction | 0.0375 | 0.0736 | 1.04 | 0.90 to 1.20 | 0.61 |
| Thromboembolic stroke | 0.0033 | 0.0699 | 1.00 | 0.87 to 1.15 | 0.96 |
| Major cardiovascular events | 0.0315 | 0.0468 | 1.03 | 0.94 to 1.13 | 0.50 |
| Cardiovascular death | 0.1061 | 0.0930 | 1.11 | 0.93 to 1.33 | 0.25 |
| All‐cause mortality | −0.0046 | 0.0321 | 1.00 | 0.93 to 1.06 | 0.89 |
| rs883389 | |||||
| Myocardial infarction | −0.0407 | 0.0851 | 0.96 | 0.81 to 1.13 | 0.63 |
| Thromboembolic stroke | −0.0188 | 0.0805 | 0.98 | 0.84 to 1.15 | 0.82 |
| Major cardiovascular events | −0.0194 | 0.0538 | 0.98 | 0.88 to 1.09 | 0.72 |
| Cardiovascular death | 0.0538 | 0.1048 | 1.06 | 0.86 to 1.30 | 0.61 |
| All‐cause mortality | −0.0009 | 0.0367 | 1.00 | 0.93 to 1.07 | 0.98 |
| rs946261 | |||||
| Myocardial infarction | 0.1603 | 0.0748 | 1.17 | 1.01 to 1.36 | 0.03 |
| Thromboembolic stroke | −0.0203 | 0.0726 | 0.98 | 0.85 to 1.13 | 0.78 |
| Major cardiovascular events | 0.0734 | 0.0479 | 1.08 | 0.98 to 1.18 | 0.13 |
| Cardiovascular death | 0.1489 | 0.0943 | 1.16 | 0.96 to 1.40 | 0.11 |
| All‐cause mortality | 0.0289 | 0.0330 | 1.03 | 0.96 to 1.10 | 0.38 |
| rs946263 | |||||
| Myocardial infarction | 0.0706 | 0.0935 | 1.07 | 0.89 to 1.29 | 0.45 |
| Thromboembolic stroke | −0.0467 | 0.0922 | 0.95 | 0.80 to 1.14 | 0.61 |
| Major cardiovascular events | 0.0183 | 0.0603 | 1.02 | 0.90 to 1.15 | 0.76 |
| Cardiovascular death | 0.0401 | 0.1185 | 1.04 | 0.83 to 1.31 | 0.74 |
| All‐cause mortality | −0.0410 | 0.0420 | 0.96 | 0.88 to 1.04 | 0.33 |
| rs872129 | |||||
| Myocardial infarction | 0.1384 | 0.1512 | 1.15 | 0.86 to 1.54 | 0.36 |
| Thromboembolic stroke | −0.1480 | 0.1627 | 0.86 | 0.63 to 1.19 | 0.36 |
| Major cardiovascular events | −0.0474 | 0.1041 | 0.95 | 0.78 to 1.17 | 0.65 |
| Cardiovascular death | −0.1923 | 0.2197 | 0.82 | 0.54 to 1.27 | 0.38 |
| All‐cause mortality | −0.0487 | 0.0716 | 0.95 | 0.83 to 1.10 | 0.50 |
Data are shown for the all additional SNPs evaluated using age‐adjusted Cox proportional hazards models assuming an additive genetic effect across genotype. CHI3L1 indicates chitinase 3‐like 1 gene; SNPs, single‐nucleotide polymorphisms.
Discussion
Chitinases are evolutionarily conserved hydrolytic enzymes that break down glycosidic bonds in chitin, a major component of insect and crustacean exoskeletons and of the cell wall of fungi. Although humans do not produce chitin, chitinases and chitinase‐like proteins (such as YKL‐40) are believed to play an important role in inflammation with expression of YKL‐40 induced by IL‐6 (but not tumor necrosis factor alpha).17 This family of glycosidases also are involved in fibrosis and tissue remodeling18–19 and are expressed in multiple diverse disease states, including asthma,16,20 sarcoidosis,21 schizophrenia,22 and cancer.23 YKL‐40 also inhibits oxidant‐induced injury, augments adaptive (Th2) immunity, and regulates apoptosis.24 With regard to vascular biology, macrophages within atherosclerotic plaques express YKL‐405 and YKL‐40 has been reported to stimulate alternative macrophage activation and function as an adhesion and migration factor for vascular smooth muscle cells.6–7
In this prospective epidemiological evaluation of apparently healthy women, elevated baseline plasma levels of YKL‐40 were associated with increasing ORs of thromboembolic stroke, but not MI. The association with stroke persisted after control for several lipid and nonlipid CV risk factors and had a magnitude of effect similar to that of the nonspecific inflammatory biomarker, hsCRP (Figure 2). In these analyses, both environmental and genetic factors influenced YKL‐40 levels, though SNPs associated with lifelong differences in plasma YKL‐40 levels, including the lead SNP at rs4950928, were not, in turn, significantly associated with incident vascular events.
Earlier clinical data relating plasma YKL‐40 to vascular disease and vascular risk factors have included cross‐sectional and retrospective studies. For example, in previous studies as in our data, YKL‐40 levels have been found to increase with age, blood pressure, and severity of insulin resistance.25–26 However, it is difficult in cross‐sectional or retrospective study designs to discern whether elevations of YKL‐40 precede or are a result of specific vascular or metabolic abnormalities. In our study, plasma samples were obtained several years before the onset of first‐ever vascular events, greatly reducing the likelihood of reverse causality.
Although prior prospective studies of YKL‐40 as a determinant of incident coronary and cerebral occlusive disease are limited, they are remarkably consistent with the potential differential effect observed on stroke, as compared to MI observed in the current data (Figure 4). In particular, investigators in the Copenhagen City Heart Study reported that elevated levels of plasma YKL‐40 were significantly associated with incident stroke, whereas no association was observed for MI.8 This differential effect has also been observed in a second independent prospective Danish cohort.9 Similarly, in a European population with stable CAD, YKL‐40 was again strongly associated with all‐cause mortality inclusive of stroke, but not with recurrent episodes of angina and only marginally with RMI.10 As with other inflammatory biomarkers, YKL‐40 has also consistently been shown to associate with all‐cause mortality, including among those with stable CAD.27–29
Figure 4.
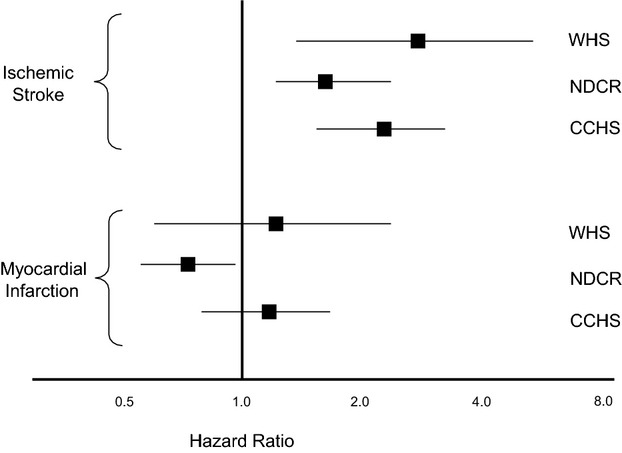
Associations between YKL‐40 and incident ischemic stroke and myocardial infarction in 3 cohorts: the Women's Health Study (WHS); the National Danish Civil Registry (NDCR); and the Copenhagen City Heart Study (CCHS). Data from the WHS and NDCR represent hazard ratios for the top quartile of YKL‐40, whereas data from the CCHS represent hazard ratios for the top decile of YKL‐40.
Despite expression in several disease states, the function of YKL‐40 in humans remains uncertain. In our data, and as shown in patients with or at risk for asthma,16 genetic polymorphism at CHI3L1 has a major effect on plasma YKL‐40 levels, with more than a doubling of levels when comparing individuals with the CC and GG genotypes at rs4950928. Yet, unlike earlier data for asthma, where genotypes associated with higher YKL‐40 levels were also associated with a higher prevalence of asthma,16 we were unable to detect a statistically significant influence of genotype on incident vascular events. However, the total number of vascular events is relatively modest in our secondary genomic analyses, particularly for events of thromboembolic stroke, where the plasma data are most informative. Thus, these latter data should not be construed to exclude a potential causal role for YKL‐40 in atherogenesis. Rather, we believe these data support ongoing work to investigate the possible role of YKL‐40 in several atherothrombotic states, in particular, stroke.
Potential limitations of the plasma component of our study include the fact that we relied on a single, frozen baseline blood sample and that we evaluated only postmenopausal women. However, observed YKL‐40 levels in our study are very similar to those expected in fresh plasma and in our pilot (Figure 1); these data suggest that our collection and storage procedures, which include freezing at −170°C, are sufficient to preserve the integrity of YKL‐40 in our samples. Furthermore, because we used plasma rather than serum samples, we avoided the release of YKL‐40 from activated neutrophils that can occur during coagulation. Nonetheless, because we studied only women and because sex‐specific findings for YKL‐40 might exist, care should be taken when generalizing these data to men. Beyond sample integrity, strengths of our study include its prospective nested case‐control design in which plasma samples for all study participants were obtained at study entry, many years before the occurrence of first‐ever vascular events. Such a study design considerably reduces potential biases inherent in retrospective studies where plasma sampling is done after, rather than before, the onset of disease. Furthermore, by matching case and control participants by age, smoking, and HRT use, it is highly unlikely that confounding effects resulting from any of these variables could explain our results.
Although YKL‐40 is involved in multiple inflammatory processes, it has been hypothesized that expression of this protein is particularly relevant in carotid atherosclerosis. For example, Michelson et al.30 report higher YKL‐40 expression in diseased carotid plaques, when compared to healthy individuals, and higher YKL‐40 levels among those with symptomatic carotid atherosclerosis, as compared to asymptomatic carotid disease; in this report, LDL‐C did not differentiate between groups, data consistent with the clinical observation that cholesterol is less relevant for stroke risk than coronary risk. Other work suggests that mechanical compression and stretch stimulates production of YKL‐40,31 an interesting observation because there are differences in the strain characteristics of carotid, as compared to coronary, plaques, with the former being more susceptible to HTN. However, YKL‐40 is also produced in macrophages, epithelial cells, and some neutrophils in nonatheromatous disease and may reflect fibrosis or extracellular tissue remodeling. Furthermore, in the genetic component of our data, we did not observe an association between polymorphisms in the CH13L1 locus encoding YKL‐40 and vascular events. Thus, whether the effects observed here are specific to carotid atherogenesis and late plaque development or represent a more global systemic response to inflammation will require further investigation.
Sources of Funding
Disclosures
Dr Ridker is listed as a coinventor on patents held by the Brigham and Women's Hospital that relate to the use of inflammatory biomarkers in CVD and diabetes that have been licensed to AstraZeneca and Siemens. The remaining authors report no additional conflicts.
References
- 1.Ridker PM, Hennekens CH, Buring JE, Rifai N. C‐reactive protein and other markers of inflammation in the prediction of cardiovascular disease in women. N Engl J Med. 2000; 342:836-843. [DOI] [PubMed] [Google Scholar]
- 2.Ridker PM, Rifai N, Stampfer MJ, Hennekens CH. Plasma concentration of interleukin‐6 and the risk of future myocardial infarction among apparently healthy men. Circulation. 2000; 101:1767-1772. [DOI] [PubMed] [Google Scholar]
- 3.Rost NS, Wolf PA, Kase CS, Kelly‐Hayes M, Silbershatz H, Massaro JM, D'Agostino RB, Franzblau C, Wilson PWF. Plasma concentration of C‐reactive protein and risk of ischemic stroke and transient ischemic attack: the Framingham Study. Stroke. 2001; 32:2575-2579. [DOI] [PubMed] [Google Scholar]
- 4.Everett BM, Kurth T, Buring JE, Ridker PM. The relative strength of C‐reactive protein and lipid levels as determinants of ischemic stroke compared with coronary heart disease in women. J Am Coll Cardiol. 2006; 48:2235-2242. [DOI] [PMC free article] [PubMed] [Google Scholar]
- 5.Boot RG, van Achterberg TA, van Aken BE, Renkema GH, Jacobs MJ, Aerts JM, de Vries CJ. Strong induction of members of the chitinase family of proteins in atherosclerosis: chitotriosidase and human cartilage gp‐39 expressed in lesion macrophages. Arterioscler Thromb Vasc Biol. 1999; 19:687-694. [DOI] [PubMed] [Google Scholar]
- 6.Malinda KM, Ponce L, Kleinman HK, Shackelton LM, Millis AJ. Gp38k, a protein synthesized by vascular smooth muscle cells, stimulates directional migration of human umbilical vein endothelial cells. Exp Cell Res. 1999; 250:168-173. [DOI] [PubMed] [Google Scholar]
- 7.Nishikawa KC, Millis AJ. gp38k (CHI3L1) is a novel adhesion and migration factor for vascular cells. Exp Cell Res. 2003; 287:79-87. [DOI] [PubMed] [Google Scholar]
- 8.Kjaergaard AD, Bojesen SE, Johansen JS, Nordestgaard BG. Elevated plasma YKL‐40 levels and ischemic stroke in the general population. Ann Neurol. 2010; 68:672-680. [DOI] [PubMed] [Google Scholar]
- 9.Rathcke CM, Thomsen SB, Linneberg A, Vestergaard H. Variations of CHI3L1, levels of the encoded glycoprotein YKL‐40 and prediction of fata and non‐fatal ischemic stroke. PLoS One. 2012; 8:e43498. [DOI] [PMC free article] [PubMed] [Google Scholar]
- 10.Kastrup J, Johansen JS, Winkel P, Hansen JF, Hildebrandt P, Jensen GB, Jespersen CM, Kjoller E, Kolmos HJ, Lind I, Nielsen H, Gluud C. High serum YKL‐40 concentration is associated with cardiovascular and all‐cause mortality in patients with stable coronary artery disease. Eur Heart J. 2009; 30:1066-1072. [DOI] [PubMed] [Google Scholar]
- 11.Ridker PM, Cook NR, Lee IM, Gordon D, Gaziano JM, Manson JE, Hennekens CH, Buring JE. A randomized trial of low‐dose aspirin in the primary prevention of cardiovascular disease in women. N Engl J Med. 2005; 352:1293-1304. [DOI] [PubMed] [Google Scholar]
- 12.Ridker PM, Chasman DI, Zee RY, Parker A, Rose L, Cook NR, Buring JE. Rationale, design, and methodology of the Women's Genome Health Study: a genome‐wide association study of more than 25,000 initially healthy american women. Clin Chem. 2008; 54:249-255. [DOI] [PubMed] [Google Scholar]
- 13.Suk Danik J, Rifai N, Buring JE, Ridker PM. Lipoprotein(a), measured with an assay independent of apolipoprotein(a) isoform size, and risk of future cardiovascular events among initially healthy women. JAMA. 2006; 296:1363-1370. [DOI] [PubMed] [Google Scholar]
- 14.Ridker PM, Stampfer MJ, Rifai N. Novel risk factors for systemic atherosclerosis: A comparison of C‐reactive protein, fibrinogen, homocysteine, lipoprotein(a), and standard cholesterol screening as predictors of peripheral arterial disease. JAMA. 2001; 285:2481-2485. [DOI] [PubMed] [Google Scholar]
- 15.Ridker PM, Hennekens CH, Roitman‐Johnson B, Stampfer MJ, Allen J. Plasma concentration of soluble intercellular adhesion molecule 1 and risks of future myocardial infarction in apparently healthy men. Lancet. 1998; 351:88-92. [DOI] [PubMed] [Google Scholar]
- 16.Ober C, Tan Z, Sun Y, Possick JD, Pan L, Nicolae R, Radford S, Parry RR, Heinzmann A, Deichmann KA, Lester LA, Gern JE, Lemanske RF, Jr, Nicolae DL, Elias JA, Chupp GL. Effect of variation in CHI3L1 on serum YKL‐40 level, risk of asthma, and lung function. N Engl J Med. 2008; 358:1682-1691. [DOI] [PMC free article] [PubMed] [Google Scholar]
- 17.Nielsen AR, Plomgaard P, Krabbe KS, Johansen JS, Pedersen BK. IL‐6, but not TNF‐α, increases plasma YKL‐40 in human subjects. Cytokine. 2011; 55:152-155. [DOI] [PubMed] [Google Scholar]
- 18.Zhu Z, Zheng T, Homer RJ, Kim YK, Chen NY, Cohn L, Hamid Q, Elias JA. Acidic mammalian chitinase in asthmatic Th2 inflammation and IL‐13 pathway activation. Science. 2004; 304:1678-1682. [DOI] [PubMed] [Google Scholar]
- 19.Johansen JS. Studies on serum YKL‐40 as a biomarker in diseases with inflammation, tissue remodelling, fibroses and cancer. Dan Med Bull. 2006; 53:172-209. [PubMed] [Google Scholar]
- 20.Chupp GL, Lee CG, Jarjour N, Shim YM, Holm CT, He S, Dziura JD, Reed J, Coyle AJ, Kiener P, Cullen M, Grandsaigne M, Dombret MC, Aubier M, Pretolani M, Elias JA. A chitinase‐like protein in the lung and circulation of patients with severe asthma. N Engl J Med. 2007; 357:2016-2027. [DOI] [PubMed] [Google Scholar]
- 21.Kruit A, Grutters JC, Ruven HJ, van Moorsel CC, van den Bosch JM. A CHI3L1 gene polymorphism is associated with serum levels of YKL‐40, a novel sarcoidosis marker. Respir Med. 2007; 101:1563-1571. [DOI] [PubMed] [Google Scholar]
- 22.Zhao X, Tang R, Gao B, Shi Y, Zhou J, Guo S, Zhang J, Wang Y, Tang W, Meng J, Li S, Wang H, Ma G, Lin C, Xiao Y, Feng G, Lin Z, Zhu S, Xing Y, Sang H, St Clair D, He L. Functional variants in the promoter region of Chitinase 3‐like 1 (CHI3L1) and susceptibility to schizophrenia. Am J Hum Genet. 2007; 80:12-18. [DOI] [PMC free article] [PubMed] [Google Scholar]
- 23.Johansen JS, Jensen BV, Roslind A, Nielsen D, Price PA. Serum YKL‐40, a new prognostic biomarker in cancer patients? Cancer Epidemiol Biomarkers Prev. 2006; 15:194-202. [DOI] [PubMed] [Google Scholar]
- 24.Lee CG, Da Silva CA, Dela Cruz CS, Ahangari F, Ma B, Kang MJ, He CH, Takyar S, Elias JA. Role of chitin and chitinase/chitinase‐like proteins in inflammation, tissue remodeling, and injury. Annu Rev Physiol. 2011; 73:479-501. [DOI] [PMC free article] [PubMed] [Google Scholar]
- 25.Rathcke CN, Vestergaard H. YKL‐40—an emerging biomarker in cardiovascular disease and diabetes. Cardiovasc Diabetol. 2009; 8:61. [DOI] [PMC free article] [PubMed] [Google Scholar]
- 26.Nielsen AR, Erikstrup C, Johansen JS, Fischer CP, Plomgaard P, Krogh‐Madsen R, Taudorf S, Lindegaard B, Pedersen BK. Plasma YKL‐40: a BMI‐independent marker of type 2 diabetes. Diabetes. 2008; 57:3078-3082. [DOI] [PMC free article] [PubMed] [Google Scholar]
- 27.Mygind ND, Iversen K, Kober L, Goetze JP, Nielsen H, Boesgaard S, Bay M, Johansen JS, Nielsen OW, Kirk V, Kastrup J. The inflammatory biomarker YKL‐40 at admission is a strong predictor of overall mortality. J Intern Med. 2013; 273:205-216. [DOI] [PubMed] [Google Scholar]
- 28.Rathcke CN, Raymond I, Kistorp C, Hildebrandt P, Faber J, Vestergaard H. Low grade inflammation as measured by levels of YKL‐40: association with an increased overall and cardiovascular mortality rate in an elderly population. Int J Cardiol. 2010; 143:35-42. [DOI] [PubMed] [Google Scholar]
- 29.Harutyunyan M, Gotze JP, WInkel P, Johansen JS, Hansen JF, Jensen GB, Hilden J, Kjoller E, Kolmos HJ, Gluud C, Kastrup J. Serum YKL‐40 predicts ong‐term mortality in patients with stable coronary disese: A prognostic study within the CLARICOR trial. Immunobiology. 2013; 218:945-951. [DOI] [PubMed] [Google Scholar]
- 30.Michelsen AE, Rathcke CN, Skjelland M, Holm S, Ranheim T, Krohg‐Sørensen K, Halvorsen B. Increased YKL‐40 expression in patients with carotid atherosclerosis. Atherosclerosis. 2010; 211:589-595. [DOI] [PubMed] [Google Scholar]
- 31.Park JA, Drazen JM, Tschumperlin DJ. The chitinase‐like protein YKL‐40 is secreted by airway epithelial cells at base line and in response to compressive mechanical stress. J Biol Chem. 2010; 285:29817-29825. [DOI] [PMC free article] [PubMed] [Google Scholar]